Abstract:Natural Gas is More Efficient than Other Forms of Fossil Fuel. Natural gas produces more energy than any of the fossil fuels. Although the primary use of natural gas is as a fuel, it is also a source of hydrocarbons for petrochemical feedstocks and a major source of elemental sulfur, an important industrial chemical. The process simulation and optimization of natural gas dehydration process including mono ethylene glycol (MEG) injection and its regeneration process is studied in this research work. This study also carried out the operation parameters and optimization. The simulation is carried out using Aspen-HYSYS. The effect of replacement MEG by DEG and influence of replacement of Chiller by a turbo expander refrigeration technique on the DPCU operation was studied. The result obtained for optimum parameters like inlet pressure and temperature of the LTS are studied and comparing chiller and expander to maximize NGL are presented. The study recommends to use the expander instead of the chiller. The the economic evaluation of the proposed modification is presented in this study. Index Terms: Diethylene glycol, Gas dehydration, Low temperature separator, Monoethylene glycol, Simulation.
I. INTRODUCTION
The natural gas is the most efficient fossil fuel, that offering much benefit instead of using the coal and oil (Mokhatab, S., Poe, W. and Mak, 2019). The natural gas produced from underground revisor and contain huge quantity of light hydrocarbon as methane and contain small amount of the heavy hydrocarbon like pentane and hexane C6+ and containing non hydrocarbon as water, nitrogen and hydrogen sulfide (Rahimpour, 2013; Wang, X. and Economides, 2013; Bahadori, 2014). And one of the main purposes of natural gas treatment is to improve the purity of the gas and to separate the heavy hydrocarbon from the light hydrocarbon and to remove the contained water vapor (Farag, H., Ezzat, M., Amer, H. and Nashed, 2011; Kong, Z., Mahmoud, A., Liu, S. and Sunarso, 2018; Shoaib, A., Bhran, A., Awad, M., El-Sayed, N. and Fathy, 2018). The water is big problem in the oil and gas industry it can accelerate the corrosion and for the natural gar the water can reduce the heating value of the natural gas and the main problem water causes the hydrate formation. So the dehydration process is must be included in gas processing. And the main purpose for the dehydration
Revised Manuscript Received on July 05, 2019
Ahmed Al Shehhi, MIE Department, College of Engineering, National
University of Science and Technology, Muscat ,Oman.
M.J.Varghese, Caledonian Center for Creativity and Innovation,
National University of Science and Technology, Muscat, Oman.
Lakkim Rao, MIE Department, College of Engineering, National
University of Science and Technology, Muscat ,Oman.
Santosh Walke, MIE Department, College of Engineering, National
University of Science and Technology, Muscat ,Oman. ..
including the hydrocarbon dew point control is to maintain the water content specification, to prevent the corrosion and to separate the heavy hydrocarbons and to prevent the formation of hydrate and to avoid the condensation if the water and heavy hydrocarbon in the gas transport pipeline (K.Abdulla, 2015). For the dehydration is three main methods as adsorption and absorption by using glycol solvent and the condensation by ricing the dew point temperature of the hydrocarbon and the water. Also, there are supersonic method and membrane method for the natural gas dehydration process. the current simulation study curried out using HYSYS v8.6 and aimed To study the influence of the operating conditions on Natural Gas Dehydration Process (S.M.Walke, 2012; Walke, 2012; Son, H., Kim, Y., Park, S., Binns, M. and Kim, 2018). To analyze the results after replacement MEG by DEG in Natural Gas Dehydration Process (RS Al Ziedi, 2018; Sakheta, A. and Zahid, 2018), evaluate the influence of replacement the Chiller by a turbo expander refrigeration technique on the DPCU operation(TK, I., RK2, A., FH, K. and IM, 2017) and to maximize the natural gas liquid production (Abu Bakar, W. and Ali, 2010; Basafa, M. and Pourafshari Chenar, 2014; Nemati Rouzbahani, A., Bahmani, M., Shariati, J., Tohidian, T. and Rahimpour, 2014).
II. PROCESSDESCRIPTION
Within the process package, the gas is treated to remove the water and heavy hydrocarbons to meet the sales gas water dew point and hydrocarbon dew point specifications (Abu Bakar, W. and Ali, 2010; Basafa, M. and Pourafshari Chenar, 2014; Nemati Rouzbahani, A., Bahmani, M., Shariati, J., Tohidian, T. and Rahimpour, 2014; Bhran, 2015; Felicia, R. & Evbuomwan, 2015; Sayed, 2017). The gas stream entering the process package is routed to the Inlet Knock out Drum to remove liquid that condensed in the upstream Inlet Cooler. The separated liquid is sent to the Inlet Separator for recovery. The gas stream is then passed through the Gas/Liquid Heat Exchanger tube side followed by the Gas/Gas Heat Exchanger tube side to cool down initially by cold process liquid and gas streams, respectively, from the Low Temperature Separator (LTS).
Lean MEG is injected onto the tube sheets of the exchangers within the process package to inhibit hydrate and ice formation at locations where pressure and temperature conditions are within the predicted hydrate/ice formation region.
Process Simulation and Optimization of
Natural Gas Dehydration Process using Aspen
Hysys
Figure 1: Simulation of MEG Plant These locations are the Gas/Liquid Heat Exchanger tube
[image:2.595.62.537.56.231.2]side inlet, the Gas/Gas Heat Exchanger tube side, and the Chiller tube side inlet to Pass One and tube side inlet to Pass Two. Lean MEG is supplied from the MEG Regeneration Unit (MRU). The gas is cooled further against propane in the Chiller to achieve the temperature required for gas dehydration and hydrocarbon dew pointing (Wang, X. and Economides, 2013). The cold propane is supplied from the Propane Refrigeration Unit (PRU).
Table 1: Feed composition
The cooled gas exiting the Chiller is passed to the LTS which performs final separation of liquid from the gas stream. The dew pointed gas from the LTS then flows through the Gas/Gas Heat Exchanger shell side where it is heated through exchange with the cold upstream gas on the tube side before being sent to the Sales Gas Compressors (SGCs) for compression to the export gas pipeline pressure. As it shown in fig1. Meanwhile, the separated liquid in the LTS flows to the Gas/Liquid Heat Exchanger to remove heat from the upstream process. It is then sent to a Condensate/Glycol Heater to be heated by hot oil, in order to improve the liquids separation performance between condensate and MEG in the Condensate/Glycol Separator. Separated condensate from the Condensate/Glycol Separator is sent to the CSU for treatment
while the separated rich MEG flows to the MRU for water inlet gas stream temperature is 30 ℃ and the pressure is 4000 kpa and molar flow 3984 kgmole/h equivalent to 80 MMSCFD as shown in Table 2:
Table 2: Feed Conditions
Temperature C 30
Pressure kPa 4000
Molar Flow kgmole/h 3984.56
7
Mass Flow kg/h 76540.1
3 Liquid Volume
Flow
m3/h 225.077
8
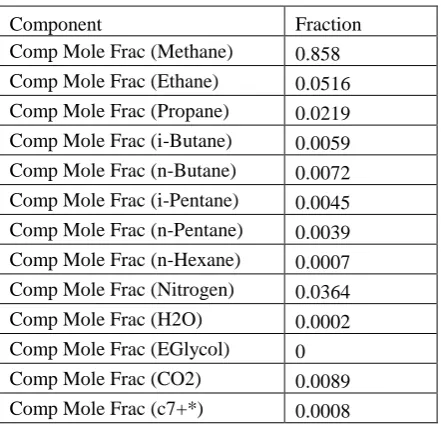
Composition is mainly methane with other components are shown in the table below including the H2O and the C7+ as it shown in Table 1.
Lean MEG is pumped from the MRU and injected into various heat exchangers within the gas dehydration process where it suppresses the hydrate formation temperature and allows the gas to be chilled without hydrate formation or freezing. Rich MEG is collected in the boot of the Condensate/Glycol Separator within the dehydration unit and is returned to the MRU, which is designed to remove water, small amounts of hydrocarbons and minor amounts of solids contaminants from the Rich MEG.
The Rich MEG is first heated in the Glycol Reflux Condenser Tube Bundle and the Glycol/Glycol Exchanger before passing to the Glycol Flash Separator to separate the entrained light hydrocarbons.
The flashed gas is sent to the LP flare. The MEG is then routed to the Glycol Still Column. The Rich MEG flows downwards through the Glycol Still Column packing and into the Glycol Regenerator for bulk water removal. The Glycol Regenerator temperature is maintained by circulating hot oil through its tube bundle. The heat vaporizes water from the MEG, thereby enabling the glycol-water separation and regenerating the MEG. The vaporized water continues through the overhead Reflux Condenser and is sent directly to the Flare. The Reflux Condenser condenses some water and MEG, reducing MEG losses.
The Lean MEG from the
Glycol Regenerator
Component Fraction
Comp Mole Frac (Methane) 0.858
Comp Mole Frac (Ethane) 0.0516
Comp Mole Frac (Propane) 0.0219
Comp Mole Frac (i-Butane) 0.0059
Comp Mole Frac (n-Butane) 0.0072
Comp Mole Frac (i-Pentane) 0.0045 Comp Mole Frac (n-Pentane) 0.0039
Comp Mole Frac (n-Hexane) 0.0007
Comp Mole Frac (Nitrogen) 0.0364
Comp Mole Frac (H2O) 0.0002
Comp Mole Frac (EGlycol) 0
Comp Mole Frac (CO2) 0.0089
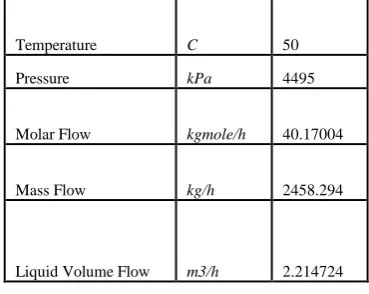
[image:2.595.51.272.391.603.2]overflows to the MEG outlet and is then cooled in the Glycol/Glycol Exchanger, through heat exchange with the Rich MEG, before it is sent to the Glycol Surge Drum. And the MEG injection stream quantity and temperature and flow rate are shown the Table 3
Table 3: MEG Injection Stream
Temperature C 50
Pressure kPa 4495
Molar Flow kgmole/h 40.17004
Mass Flow kg/h 2458.294
Liquid Volume Flow m3/h 2.214724
III. RESULTS AND DISCUSSIONS
[image:3.595.74.259.125.272.2]1. Optimum inlet pressure to maximize NGL. The result from this simulation applied on two technique which is dehydration and hydrocarbon dew point by using chiller which exchange the temperature with external refrigerant stream, and the second technique is by using expander to expand the pressure which will lead to drop the temperature. Here the variables were applied on different inlet pressure to find and maximize the natural gas liquid NGL production by increasing and reducing the inlet fluid temperature. And it was for both technique with chiller technique and expander technique. As the variables change was applied by linking Excel to aspen HYSYS as it was discussed in the previous chapter. Here in fig 2 it shows the influence of pressure of the inlet fluid changing on the quantity of the natural gas liquid NGL by chiller technology.
Figure 2: NGL vs Inlet Pressure
Different pressure forces was applied to find the optimum pressure to maximize the Natural gas liquid production NGL and the simulation results show the optimum inlet pressure is 5100 kpa which equals to 51 bar to produce 750 bbl./d of NGL while with low pressure as set on 3500 kpa or 35 bar 644 bbl./d with difference of 106 bbl./d and according to oil price in may 2019 as we assume the oil price is 65 US Dollar it will be exported and the profit will increase as extra 206700 US Dollar per month. And for more accuracy will be 2516572.5
[image:3.595.305.548.310.444.2]US Dollar per year as extra from changing the pressure of the inlet fluid from 35 bar to 51 bar. And here fig 3 shows the influence of pressure of the inlet fluid changing on the quantity of the natural gas liquid NGL by Expander technology. Different pressure forces was applied to find the optimum pressure to maximize the Natural gas liquid production NGL and the simulation results show the optimum inlet pressure is 9800 kpa which equals to 98 bar to produce 1195 bbl./d of NGL while with low pressure as set on 3500 kpa or 35 bar 478 bbl./d with difference of 717 bbl./d and according to oil price in may 2019 as we assume the oil price is 65 US Dollar it will be exported and the profit will increase as extra 1398150 US Dollar per month. And for more accuracy will be 17022476.25 US Dollar per year as extra from changing the pressure of the inlet fluid from 35 bar to 98 bar. But with pressure 8200 kpa 82 bar the natural gas liquid production was 1160 bbl./d which 35bbl./d less and 1600 kpa less 16 bar less which is safest and will lead to select equipment with pressure design less than that will be used for 98 bar which will be cheaper in the price and more safe to run the processing plant with lower pressure.
Figure 3: NGL vs Inlet pressure with expander
And as comparison between the two techniques as it shown in fig 4:
Figure 4: Expander vs Chiller to produce NGL from the simulation result it shows the optimum inlet pressure for the chiller technique is 51 bar with natural gas liquid production is 750 bbl./d and for the expander technique is 82 bar with natural gas liquid production 1160 bbl./d the difference is 410 bbl./d as if we assume the bbl. price 65 US dollars it will be extra 799500 US dollar per month and 9733912.5 US Dollar per
year. From changing
[image:3.595.52.286.496.671.2]expander. While for same pressure of the optimum inlet pressure to chiller applied to expander 51 bar for expander produce 834 bbl./d the difference is 84 bbl./d that will be 163800 US dollar per month and 1994265 US dollars per year. The votes go to use expander technique.
2. Glycol regenerator temperature.
[image:4.595.310.544.48.187.2]The result from this simulation applied on two solvent for moisture absorption and anti-freezing. Mono ethylene glycol MEG and Diethylene glycol DEG. And that was aimed to evaluate the glycol losses and the purity versus the regenerator temperate. As the regenerator working to heat up the glycol to evaporate the water content and the hydrocarbon content from the glycol to make it is lean glycol to recycled and reused within the process. And the result shows the mono ethylene glycol losses in fig 5:
Figure 5: Regenerator Temperature vs Glycol MEG losses
[image:4.595.50.284.261.418.2]The results shows the MEG solvent losses on 100℃, 24 litter per day and on 120℃ the losses is 34 Litter per day which is acceptable and the results shows that when the regenerator temperature increased the losses is increasing and on the temperature of the regenerator 130 ℃ the losses rich to 103 litter per day and according the outlet composition 120℃ perfect operating temperature for the regenerator and fig 6 shows the MEG purities versus the glycol regenerator temperature.
Figure 6: MEG Purities
Here fig 7 shows the influence of the variance glycol regenerator temperature of the Diethylene glycol DEG.
Figure 7: DEG losses vs glycol regenerator temp The simulation result shows the DEG losses when the regenerator temperature is 111℃ the losses is 6.5 litter per day and the lowest losses is 4.5 litter when the glycol regenerator temperature is 156℃. The difference only two litter. And the simulation shows when the glycol regenerator temperature is 156℃. The losses are 8.3 litter and the suggestion are to stick with 120℃ to avoid the huge energy consumption.
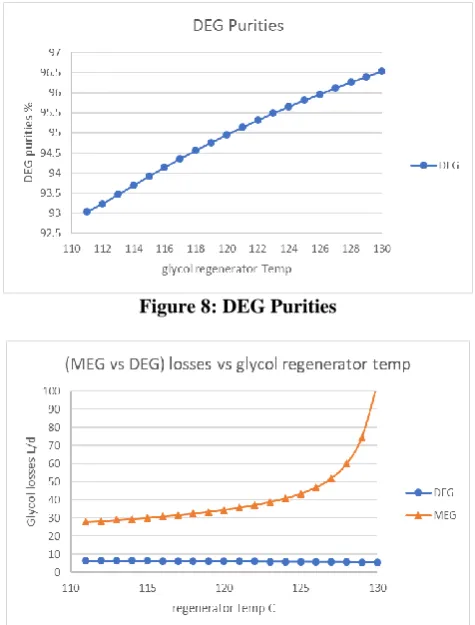
[image:4.595.307.545.352.665.2]Fig 8 shows the MEG purities versus the glycol regenerator temperature. And as comparison between the two solvent losses as it shown in fig 9:
Figure 8: DEG Purities
Figure 9: (MEG vs DEG) losses vs glycol regenerator temp
The compression between the losses of the Mono ethylene glycol MEG and diethylene glycol DEG shows the losses of the MEG is much more than the DEG. It shows on 110℃ for the MEG the losses are 28 litter while for same temperature for the DEG the losses are
[image:4.595.52.282.562.715.2]temperature for the DEG the losses are 6.2 litter. The suggestion and the vote is to use the DEG instead of using the MEG.
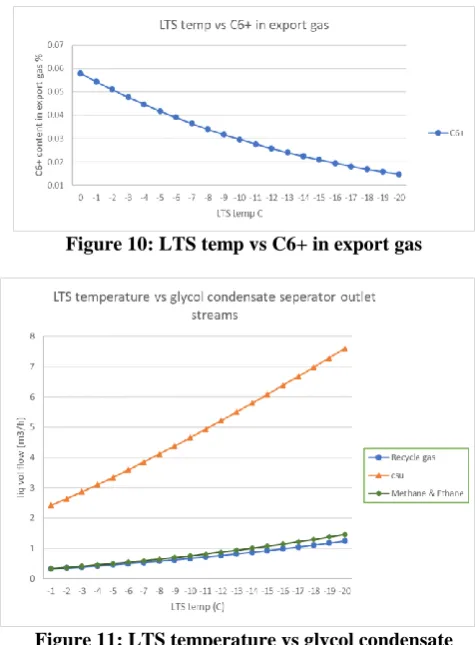
[image:5.595.304.548.248.405.2]3. Low Temperature Separator temperature. The simulation was aimed to study the influence of LTS temperature on the export gas and the glycol condensate separator. The results show the quantity of heavy hydrocarbon C6+ in the export gas and the quantity of light hydrocarbon C1 & C2 in the condensate stream that going to condensate stabilizer unit. The influence of LTS temperature on the export gas contaminated of the heavy hydro carbon as it shown in fig 10. The result shows when the temperature of the LTS is 0℃ the heavy hydrocarbon C6+ is 0.057% and when the LTS temperature is -10℃ the heavy hydrocarbon is 0.029% almost the half and when the temperature of the LTS is -20℃ the heavy hydrocarbon C6+ is 0.014%. while the -10℃ is really shows perfect results comparing with energy consumption. And here the results shows LTS temperature vs glycol condensate separator outlet streams and quantity of light hydrocarbon in the condensate stream and the recycle gas stream as it shown in fig 11:
[image:5.595.45.283.318.641.2]Figure 10: LTS temp vs C6+ in export gas
Figure 11: LTS temperature vs glycol condensate separator outlet streams
The results shows reducing the temperature of the LTS causes increasing of the NGL in condensate stream but also it increase the quantity of light hydrocarbon in the condensate stream which will lead to very unsterilized condensate which will be in the recycle gas again to reprocessed and also it shows the recycle gas stream of the glycol condensate separator get more gas to be recycled through recycle gas compressor. The results show when the temperature of the LTS is -1℃ the condensate stream has 2.41 m3/h equals to 363.8 bbl./d and the quantity of the light hydrocarbon
Methane and ethane in the condensate stream is 0.33 m3/h and the recycle gas stream shows same 0.33m3/h. and when the temperature of the LTS is -10℃ the condensate stream has 4.65 m3/h equals to 702 bbl./d and the quantity of the light hydrocarbon Methane and ethane in the condensate stream is 0.75 m3/h and the recycle gas stream shows 0.67m3/h. and when the temperature of the LTS is -20℃ the condensate stream has 7.5 m3/h equals to 1132 bbl./d and the quantity of the light hydrocarbon Methane and ethane in the condensate stream is 1.46 m3/h and the recycle gas stream shows 1.24 m3/h. which mean is very high quantity of the recycle gas and methane and ethane.
4. Feed versus the export
The results show the Feed stream versus the export gas stream and the quantity of butane and pentane and water that has been separated by the simulation as it shows in fig 12 and Table 4:
Figure 12: Feed Vs Export
Table 4: Feed vs Export
Component Mole Fraction
Feed Export
Comp Mole Frac (Methane) 0.858 0.867476
Comp Mole Frac (Ethane) 0.0516 0.051242
Comp Mole Frac (Propane) 0.0219 0.020499
Comp Mole Frac (Butane) 0.0131 0.010447
Comp Mole Frac (Pentane) 0.0084 0.004354
Comp Mole Frac (n-Hexane) 0.0007 0.000146 Comp Mole Frac (Nitrogen) 0.0364 0.036889
Comp Mole Frac (H2O) 0.0002 0.000003
Comp Mole Frac (EGlycol) 0 0
Comp Mole Frac (CO2) 0.0089 0.008901
Comp Mole Frac (c7+*) 0.0008 0.000043
The results shows that the butane in the feed was 0.0131 mole fraction and in the export stream is 0.01044 mole fractions and the pentane in the feed was 0.0084 mole fractions and in the export stream is 0.004354 mole fraction which is almost the half and the n-hexane in
[image:5.595.310.543.444.679.2]almost 80% separated. And the water from 0.0002 mole fraction in the feed stream to 0.000003 mole fraction in the export stream. And the C7+ component contained in the feed was 0.0008 and in the export stream is 0.000043 almost 95% separated.
According to Aspen process economic analyzer the cost shown in the result is based on 2013 third quarter. And it shows that the expander has more cost to purchase and install than that for the chiller but the chiller will need external refrigerant as propane compressor and that has another cost to spend for purchasing and maintenance while the expander has only its own and it will generate more profit from the increasing the NGL production.
CONCLUSION.
This study carried to study the influence of the operating conditions on Natural Gas Dehydration Process. The results after replacement MEG by DEG are analysed and critical evaluation of the influence of replacement the Chiller by a turbo expander refrigeration technique on the DPCU operation is studied for maximization of the NGL production. The optimum inlet pressure obtained of refrigeration process was 51 bar and for the Expander it was 82 bar. The MEG losses was 34 litter per day when the regenerator temperature is 120℃, while the DEG losses was very less as 6.1 when the regenerator temperature is 120℃ and the suggestions to use DEG instead of MEG to avoid the huge losses. For maximizing the natural gas liquid the chiller was produce 750 bbl./d while the expander process produces 1160 bbl./d with optimum inlet pressure. The study suggest to use expander to get more profit, and also the best option is to use the turbo expander to recover the waste energy from the export gas compressors. The study carried to find the influence of LTS temperature on the naturel gas liquid which shows that the reducing the temperature of the LTS causes increase in the NGL in condensate stream but also it increase the quantity of light hydrocarbon in the condensate stream which will lead to very unsterilized condensate which will be in the recycle gas again to reprocessed and also it shows the recycle gas stream of the glycol condensate separator get more gas to be recycled through recycle gas compressor.
REFERENCES
1. J. Mokhatab, S., Poe, W. and Mak, Process Modeling and Simulation of Gas Processing Plants Handbook of Natural Gas Transmission and Processing. 2019.
2. R. Rahimpour, “Improvement of natural gas dehydration performance by optimization of operating conditions: A case study in Sarkhun gas processing plant.,” Nat. Gas Sci. Eng., vol. 15, no. 11, pp. 118–126, 2013.
3. A. Bahadori, Natural gas processing. Amsterdam: GPP: Gulf Professional Publ./Elsevier, 2014.
4. M. Wang, X. and Economides, Advanced Natural Gas Engineering. Burlington: Elsevier Science, 2013.
5. A. Farag, H., Ezzat, M., Amer, H. and Nashed, “Natural gas dehydration by desiccant materials,” Alexandria Eng. J., vol. 50, no. 4, pp. 431–439, 2011.
6. T. Shoaib, A., Bhran, A., Awad, M., El-Sayed, N. and Fathy, “Optimum operating conditions for improving natural gas dew point and condensate throughput.,” J. Nat. Gas Sci. Eng., vol. 49, pp. 324–330, 2018.
7. J. Kong, Z., Mahmoud, A., Liu, S. and Sunarso, “Revamping existing glycol technologies in natural gas dehydration to improve the purity and absorption efficiency: Available methods and recent developments.,” J. Nat. Gas Sci. Eng., vol. 56, p. .486-503, 2018.
8. S. W. K.Abdulla, “Simulation of Pumps by Aspen Plus,” Int. J. Eng. Sci. Innov. Technol., vol. 4, no. 3, 2015.
9. T. A. and S. Walke, “Simulation of Process Equipment by using Hysys,” Int. J. Eng. Res. Appl., vol. 1, no. 1, 2012.
10. [10] V. S. S. S.M.Walke, “Experimental Study on Comparison of Rising Velocity of Bubbles and Light Weight Particles in the Bubble Column,” Int. J. Chem. Eng. Appl., vol. 3, no. 1, pp. 15–25, 2012. 11. J. Son, H., Kim, Y., Park, S., Binns, M. and Kim, “Simulation and
modeling of MEG (Monoethylene Glycol) regeneration for the estimation of energy and MEG losses.,” Energy, vol. 157, pp. 10–18, 2018.
12. S. W. RS Al Ziedi, “Design and Simulation of Hydrogen Peroxide Plant,” J. Adv. Civ. Eng., vol. 4, no. 1, pp. 32–36, 2018.
13. U. Sakheta, A. and Zahid, “Process simulation of dehydration unit for the comparative analysis of natural gas processing and carbon capture application,” Chem. Eng. Res. Des., vol. 137, pp. 75–88, 2018. 14. K. TK, I., RK2, A., FH, K. and IM, “The Impact of Stripping Gas Flow
Rate on Triethylene Glycol Losses from Glycol Regeneration Unit: Simulation Study.,” J. Chem. Eng. Process Technol., vol. 8, no. 13, 2017.
15. R. Abu Bakar, W. and Ali, Natural Gas. 2010.
16. M. Basafa, M. and Pourafshari Chenar, “Modeling, Simulation, and Economic Assessment of Membrane-Based Gas Dehydration System and Comparison with Other Natural Gas Dehydration Processes,” Sep. Sci. Technol., vol. 49, no. 16, pp. 2465–2477, 2014.
17. M. Nemati Rouzbahani, A., Bahmani, M., Shariati, J., Tohidian, T. and Rahimpour, “Simulation, optimization, and sensitivity analysis of a natural gas dehydration unit,” J. Nat. Gas Sci. Eng., vol. 21, pp. 159–169, 2014.
18. A. Sayed, “Integrated process development for an optimum gas processing plant,” Chem. Eng. Res. Des., vol. 124, no. 10, pp. 114–123, 2017.