Original Article
The associations of single nucleotide polymorphism
rs2295080 in mTOR with cancer risk:
an updated meta-analysis
Kaihong Wang1*, Jianjun Xiao2*, Lingzhi Jiang3*, Ju Guo1, Yida Zhang1, Hao Jiang1, Kanghua Li1, Runfu Cao1
1Department of Urology, The First Affiliated Hospital of Nanchang University, Nanchang, Jiangxi, People’s Republic of China; 2Department of Urology, People’s Hospital of Suichuan County, Suichuan, Jiangxi, People’s Republic of China; 3Department of General, First Affiliated Hospital of Nanchang University, Nanchang, Jiangxi, People’s
Republic of China. *Equal contributors.
Received January 26, 2019; Accepted April 11, 2019; Epub July 15, 2019; Published July 30, 2019
Abstract: Many studies have examined the association of the mTOR gene rs2295080 (T/G) polymorphism with
cancer susceptibility, but the findings have been inconsistent. To evaluate the effect of the mTOR rs2295080 poly
-morphism on cancer risk, fifteen articles (containing 9207 cases and 10739 controls) were examined for this meta-analysis. To assess the degree of association, odds ratios (ORs) with 95% confidence intervals (CIs) were calculated
using the random effects model. In total, our results indicated that rs2295080 is associated with a decreased risk of cancer in the dominant-model and in the heterozygous-model (TG + GG versus TT: OR = 0.88, 95% CI 0.79-0.99 P = 0.035; TG versus TT: OR = 0.89, 95% CI 0.81-0.98 P = 0.021). Performing a sub-group analysis based on sys-temic cancer type, we observed that the rs2295080 polymorphism decreased the cancer risk in urogenital system cancers (TG + GG versus TT: OR = 0.72, 95% CI 0.58-0.90 P = 0.004; G versus T: OR = 0.75, 95% CI 0.58-0.97 P = 0.026; TG versus TT: OR = 0.77, 95% CI 0.69-0.86 P = 0.000). It is noteworthy that we found the rs2295080
poly-morphism significantly increased the risk in blood system cancers (GG versus TG + TT: OR = 2.25, 95% CI 1.30-3.91
P = 0.004; G versus T: OR = 1.24, 95% CI 1.05-1.47 P = 0.013; GG versus TT: OR = 2.25, 95% CI 1.33-3.82 P =
0.003). However, we did not find a correlation between the rs2295080 polymorphism and cancer risk of the diges
-tive system in any of the five models. Thus, possible additional factors related to the risk of cancer of the diges-tive
system should be investigated in further studies.
Keywords: mTOR, rs2295080, polymorphism, cancer, risk
Introduction
The mammalian target of rapamycin (mTOR) located on chromosome 1p36.2, is composed of 2549 amino acids and is arranged in a highly conservative structural domain [1, 2]. mTOR is a molecular downstream PI3K/AKT signaling pathway, which plays a vital role in cellular physiological processes, for example angiogen-esis, metabolism, proliferation, migration, and apoptosis [3-8]. An abnormal mTOR signaling pathway is connected with the formation and progression of multiple tumors [9, 10]. It includes many malignancies, such as bladder tumors, acute lymphocytic leukemia (ALL), prostate gland cancer, colorectal cancer, es- ophageal cancer, etc. On the one hand, the mTOR pathway inhibits the apoptosis of normal
cells and promotes the carcinogenesis of nor-mal cells. On the other hand, it also promotes the proliferation rate of cancer cells [3], thus making people more susceptible to cancer. Most of these SNPs of mTOR, located in the unknown function effect of exons and introns, which affect the transcription factor (transcrip-tional factor, TF) after the combining ability and genetic transcription.
risk of cancer. But their results were not consis-tent [15-17]. Since then, there have been 6 studies on the correlation between rs2295080 and tumors. For example, Liu et al. found that the GT genotype of mTOR rs2295080 G > T provided more protection against prostate cancer than the TT genotypes [18]. These newly published studies reveal potential fea-tures of rs2295080 polymorphisms and ques-tion the conclusions from the meta-analyses that were published before. Accordingly, we performed this updated meta-analysis to ree- valuate the role of SNP rs2295080 in tumori-genesis and to provide a more accurate correla-tion assessment.
Materials and methods
Search identification and selection
The eligible studies was collected by searching the PubMed database, Google Scholar, and
ria, and all questions were discussed and han-dled by three reviewers.
Data extraction
Two researchers (K.H.W and L.Z.J) indepen-dently extracted data from all the eligible stud-ies. If a dispute remained unresolved, the third investigator (J.J.X) would be take part to adjudi-cate the disagreements. All the selected data
were drawn up in a unified format, and the fol
-lowing contents were collected: first author’s
name, year of publication, source of the con-trols, ethnicity, genotypic method, the number of cases and controls, genotype frequency (TT, TG, GG). Of course, the outcomes of the Hardy-Weinberg equilibrium (HWE) test were also included.
Statistical analysis
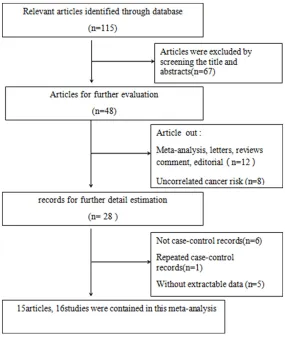
[image:2.612.90.375.71.409.2]When the frequency of the control genotype Figure 1. Flow diagram of the process for study selection. A total of 15
ar-ticles were identified and one of the arar-ticles contained two studies. So, there
were 16 studies included in our meta-analysis.
the keywords “mTOR” or “rs- 2295080”, “Polymorphisms” or “SNP”, “cancer or carcino-ma or tumor” and “risk” as well as their combinations published up through Dece- mber 2018 in any language. We looked for studies that revealed the correlation bet- ween SNP rs2295080 and the risk of cancer.
Inclusion and exclusion
criteria
Studies were selected in this meta-analysis if they met the criteria: 1. Case-control stud-ies; 2. Studies that offered genotype frequencies to co- unt the value of odds ratios
(ORs) and 95% confidence
crite-Table 1. Main characteristics of studies (containing 9207 cases and 10739 controls ) selected in the meta-analysis
Author Year Genotypic method Country ethnicity Cancer type Source of controls TT CasesTG GG TTControlsTG GG of HWEP value *
Chen et al. [24] 2012 RFLP-PCR CHINA (Han) Prostate HB 429 209 28 413 259 36 0.69
Huang et al. [25] 2012 RFLP-PCR CHINA (Han) All HB 254 140 23 353 180 21 0.52
Cao et al. [13] 2012 aqMan assay CHINA (Han) RCC HB 454 218 38 438 277 45 0.08
Li et al. [26] 2013 RFLP-PCR CHINA (Han) Prostate PB 653 311 40 617 382 52 0.70
Xu et al. [12] 2013 RFLP-PCR CHINA (Han) Gastric HB 482 246 25 497 305 52 0.35
Xu et al. [27] 2015 RFLP-PCR CHINA (Han) Colorectal HB 482 225 30 459 273 45 0.56
Zhu et al. [28] 2015 TaqMan assay CHINA (Han) ESCC HB 674 390 49 702 362 49 0.43
Zhao et al. [14] 2015 RFLP-PCR CHINA (Han) ALL HB 68 50 15 173 111 12 0.22
Zhao et al. [14] 2015 RFLP-PCR CHINA (Han) AML HB 27 14 6 173 111 12 0.07
Wang et al. [29] 2015 RFLP-PCR CHINA (Han) Gastric HB 568 394 40 607 355 41 0.00
Zhao et al. [30] 2016 Sequencing CHINA (Han) Breast HB 351 197 12 345 212 26 0.01
Zhao et al. [21] 2017 TaqMan assay CHINA (Han) Gastric HB 178 90 15 174 86 11 0.42
Liu et al. [18] 2017 RFLP-PCR CHINA (Han) Prostate HB 236 145 32 454 316 37 0.15
Wen et al. [20] 2017 RFLP-PCR CHINA (Han) Thyroid HB 366 170 24 295 176 29 0.45
Qi et al. [22] 2017 RFLP-PCR CHINA (Han) Gastric HB 194 279 101 297 441 174 0.97
Bizhani et al. [23] 2018 RFLP-PCR IRANIAN (Caucasian) Bladder PB 65 90 80 26 76 152 0.00
Note: RFLP-PCR, restriction fragment length Polymorphism-polymorphism chain reaction; ALL, Acute lymphocytic leukemia; AML, Acute myeloid leukemia; RCC, Renal cell cancer; ESCC, Esophageal squamous cell carcinoma; HB, Hospital based; PB, Population based; *HWE, Hardy-Weinberg equilibrium; P > 0.05 indicates that the
[image:3.612.91.521.97.304.2]participants in the case group met the HWE.
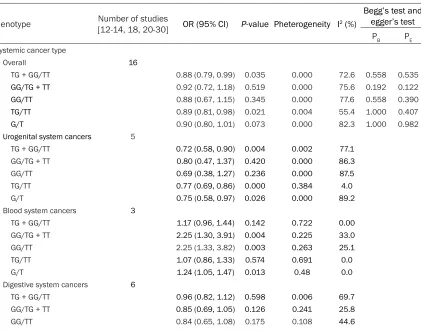
Table 2. Meta-analysis of the association between the rs4986790 polymorphism and cancer risk.
The results were Odd ratio (OR), 95% confidence interval (95% CI) and P-value were tested to evalu-ate the association
Genotype Number of studies [12-14, 18, 20-30] OR (95% CI) P-value Pheterogeneity I2 (%)
Begg’s test and egger’s test
PB PE
Systemic cancer type
Overall 16
TG + GG/TT 0.88 (0.79, 0.99) 0.035 0.000 72.6 0.558 0.535
GG/TG + TT 0.92 (0.72, 1.18) 0.519 0.000 75.6 0.192 0.122
GG/TT 0.88 (0.67, 1.15) 0.345 0.000 77.6 0.558 0.390
TG/TT 0.89 (0.81, 0.98) 0.021 0.004 55.4 1.000 0.407
G/T 0.90 (0.80, 1.01) 0.073 0.000 82.3 1.000 0.982
Urogenital system cancers 5
TG + GG/TT 0.72 (0.58, 0.90) 0.004 0.002 77.1
GG/TG + TT 0.80 (0.47, 1.37) 0.420 0.000 86.3
GG/TT 0.69 (0.38, 1.27) 0.236 0.000 87.5
TG/TT 0.77 (0.69, 0.86) 0.000 0.384 4.0
G/T 0.75 (0.58, 0.97) 0.026 0.000 89.2
Blood system cancers 3
TG + GG/TT 1.17 (0.96, 1.44) 0.142 0.722 0.00
GG/TG + TT 2.25 (1.30, 3.91) 0.004 0.225 33.0
GG/TT 2.25 (1.33, 3.82) 0.003 0.263 25.1
TG/TT 1.07 (0.86, 1.33) 0.574 0.691 0.0
G/T 1.24 (1.05, 1.47) 0.013 0.48 0.0
Digestive system cancers 6
TG + GG/TT 0.96 (0.82, 1.12) 0.598 0.006 69.7
GG/TG + TT 0.85 (0.69, 1.05) 0.126 0.241 25.8
[image:3.612.97.518.388.720.2]ORs with 95% CIs were calculated to evaluate the assessment between the SNP rs2295080 and cancer risk [19]. The pooled ORs were cal-culated for the dominant model (TG + GG vs TT), recessive models (GG vs TG + TT), homozy-gote models (GG vs TT), heterozyhomozy-gote model (TG vs GG), additive model (G vs T). The
statisti-cal significance was evaluated using a Z test.
On the side, a subgroup analysis was
conduct-ed according to the systematic tumor
classifi-cation of the participants. Q and I2 statistical
magnitudes were customized to assess hetero-geneity to measure the tightness of the genetic links. Theoretically speaking. The CIs ratio cal-culated by the random effects model is larger
than the fixed effect model. In addition, the
results of the random effect model are more conservative. Therefore, we selected random
language [14, 20-22]. The studies and the main characteristics in this meta-analysis are pre-sented in Table 1.
Meta-analysis results
We gathered statistics from 16 studies (con-taining 9207 cases and 10739 controls) to investigate the relationship between the mTOR rs2295080 polymorphism and cancer risk. The consequences of rs2295080 with cancer risk
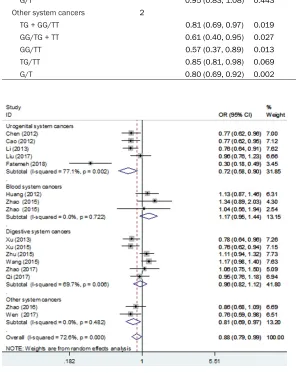
in five models are provided in Table 2. A forest plot of the overall and subgroup analyses with different models is shown in Figures 2-6. It demonstrated that the rs2295080 polymor-phism has a connection with the reduction of cancer risk among the whole populace in the dominant-model and heterozygous-model (TG
TG/TT 0.98 (0.85, 1.13) 0.773 0.026 60.7
G/T 0.95 (0.83, 1.08) 0.443 0.003 72.2
Other system cancers 2
TG + GG/TT 0.81 (0.69, 0.97) 0.019 0.482 0.0
GG/TG + TT 0.61 (0.40, 0.95) 0.027 0.333 0.0
GG/TT 0.57 (0.37, 0.89) 0.013 0.400 0.0
TG/TT 0.85 (0.81, 0.98) 0.069 0.381 0.0
[image:4.612.88.384.91.464.2]G/T 0.80 (0.69, 0.92) 0.002 0.928 0.0
Figure 2. Overall and individual systemic meta-analysis of the mTOR rs0095080 polymorphism and cancer risk in the dominant-model.
effects model. In addition,
Begg’s funnel plot test and Egger’s regression test are
used to assess publication bias, P < 0.05 is supposed to indicate publication bias. We used STATA software (version 12.0, Stata Corporation, Co- llege Station, TX). All values of test were two sided.
Results
Study characteristics
+ GG versus TT: OR = 0.88, 95% CI 0.79-0.99 P = 0.035; TG versus TT: OR = 0.89, 95% CI 0.81-0.98 P = 0.021).
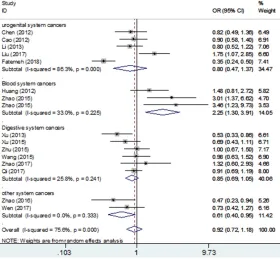
[image:5.612.92.372.73.332.2]MTOR is a key part of the P13K/AKT/mTOR sig-naling pathway. By altering gene expression widely distributed in mTOM, protein function Figure 3. Overall and individual systemic meta-analysis of the mTOR
rs0095080 polymorphism and cancer risk in the recessive-model.
A subgroup analysis showed that the rs2295080 gene polymorphism reduced the ri- sk of urogenital system can-cers (TG + GG versus TT: OR = 0.72, 95% CI 0.58-0.90 P = 0.004; G versus T: OR = 0.75, 95% CI 0.58-0.97 P = 0.026; TG versus TT: OR = 0.77, 95% CI 0.69-0.86 P = 0.000). But, it is noteworthy that we fou- nd the rs2295080
polymor-phism significantly increased
the cancer risk in blood sys-tem cancers (GG versus TG + TT: OR = 2.25, 95% CI 1.30-3.91 P = 0.004; G versus T: OR = 1.24, 95% CI 1.05-1.47 P = 0.013; GG versus TT: OR = 2.25, 95% CI 1.33-3.82 P =
0.003). However, we didn’t
observe any connection bet- ween SNP rs2295080 and cancer risk in the digestive system in any of the models.
Evaluation of heterogeneity
The P value is Cochran’s Q
te-st for between-te-study hetero-geneity in every genetic com-parison model. As shown in Tables 1, 2 and Figures 2-6, obvious heterogeneities exist-ed in the overall meta-ana- lysis model. The random ef- fects model was selected. An- other analysis we performed was the further sub-group an- alysis.
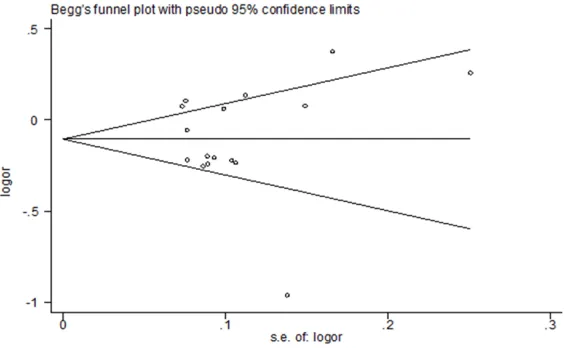
Publication bias
Begg’s funnel plots were used
for evaluating publication bias in different models. As dis-played in Table 2 and Figures 7-11, these studies have no
significant publication bias.
[image:5.612.93.371.379.634.2]Discussion Figure 4. Overall and individual systemic meta-analysis of the mTOR
was affected. The mutated mTOR protein in
mTOR’s kinase domain has been shown to
involve constitutive activation [31-33], which
has been shown to influence the cell size and
[image:6.612.93.371.72.328.2]genotype of mTOR rs2295080 G > T was more of a safeguard than the TT genotypes to pros-tate cancer [18], and Wen et al. showed that the G allele may be a protective gene in the Figure 5. Overall and individual systemic meta-analysis of the mTOR
rs0095080 polymorphism and cancer risk in the homozygous-model.
cycle progression of human tumor cells [31]. Studies have shown that SNP can be ap-
plied to different organs’
tu-mor cellular physiological pro-cesses, that rs2295080 in the promoter region of the mTOR gene is associated with tumors [3, 12, 13]. XU et al. showed that the mTOR rs22- 95080 promoter region poly-morphism is connected with a
significant risk for gastric can -cer. Meanwhile, the single nu-
cleotide site effectively influ -enced the expression of mTOR and the change of the G allele loci through the combination of some transcription factors
that may affect or significantly
change the mTOR gene tran-scription activity, and the T allele and body mTOR mRNA expression level is higher [12]. In the previous three
meta-analyses, first a meta-analysis
only contained 5 studies pre-sented that the rs2295080 G allele is related to a decreased cancer risk [15], and the other one included eight studies suggesting that rs2295080 G allele increased the risk of acute leukemia and decrea- sed the risk of genitourinary
cancers [16], and the final
meta-analysis results showed a substantial reduction risk between rs2295080 TG, GG genotype, and the GG/TG gen-otypes and whole cancer and the subgroup of urinary tem tumors and digestive sys-tem tumors [17]. The above results of the three articles is not consistent; meanwhile, there were 6 studies on the correlation between rs2295- 080 and tumors. For example, Liu et al. found that the GT Figure 6. Overall and individual systemic meta-analysis of the mTOR
[image:6.612.93.372.375.632.2]Figure 7. Funnel plot analysis to detect publication bias for rs2995080 (TG + GG/TT) polymorphism associated with cancer risk.
pathogenesis of thyroid can-cer [20]. Zhao et al. suggested that SNP rs2295080 was not relevant with the risk of non-cardia gastric cancer [21],
whereas Qi et al. confirmed
that the rs2295080 polymor-phisms were associated with gastric cancer risk [22]. Bi- zhani et al. observed that the mTOR rs2295080 (G/T) vari-ant notably increased bladder tumor risk in the Iranian popu-lation [23].
The results of our research had the same and different
findings as other studies.
Ac-cording to 16 studies with 9207 cases and 10739 con-trols about the correlation of the mTOR rs2295080 poly-morphism with cancer risk, this meta-analysis offered st- rong evidence of the associa-tion that rs2295080 (TG, GG genotype, G allele and TG/GG genotypes) was a protective factor for overall cancer. It is the same point with the previ-ous meta-analysis [15, 17]. Another example, in the sub-group analysis, the results of our research show that the rs2295080 polymorphism is able to decrease the risk of urogenital system cancers.
But significantly, it increases
the risk of cancers in the blood system. This could be
attrib-uted to the cancer-specific
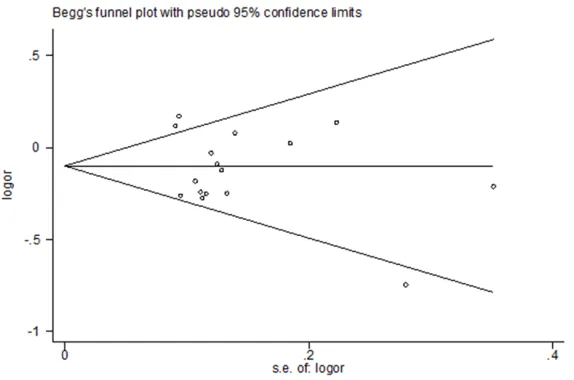
[image:7.612.91.374.299.479.2]characteristics. The differen- ce was that the conclusion of this meta-analysis was the opposite of the previous meta-analysis between rs2295080 and digestive system tumor risk, and we did not observe that rs2295080 is a protec-tive or risk factor for digesprotec-tive system tumors, but rs2295- 080 was correlated with de- creasing the risk of digestive system tumor in a previous meta-analysis [17]. That is to Figure 8. Funnel plot analysis to detect publication bias for rs2995080 (GG/
TG + TT) polymorphism associated with cancer risk.
[image:7.612.92.375.530.704.2]say, there were different conclusions among different studies on the same topic. On the one hand, country, gender and ethnic differences in
the study population may influence the results
of the study. On the other hand, usually for a
study, a sufficient sample size is an important
guarantee of the accuracy of the results. The larger the sample size, the more convincing the results, and different sample sizes will lead to different results in different studies. In addi-tion, cancer diagnostic methods, genotyping methods, and statistical analysis methods can play an important role in the results of each study. Using different research methods, the
final result may be different.
risk in urogenital system cancers, but it in- creased the risk in blood system cancers, Therefore, our conclusion is that the biological
effects of rs2295080 may be cancer-specific. It is worth noting that the significant differenc -es regarding rs2295080 in the cancer of the digestive system. Some studies have shown that SNP rs2295090 can reduce cancer risk, but others have shown the opposite. Maybe a
more detailed classification on the basis of
[image:8.612.90.371.71.259.2]region, age, upper and lower alimentary canal cancer, pathological, histological, and molecu-lar characteristics are helpful to illuminate the connection between rs2295080 and gastrointes- tinal tumors and other tumors.
Figure 10. Funnel plot analysis to detect publication bias for rs2995080 (TG/ TT) polymorphism associated with cancer risk.
There is prominent heteroge-neity in the meta-analysis. Heterogeneity covers many sides, such as tumor type, sample size, race, lifestyle, environment, etc. Thus, a sub-group analysis was performed according to the tumor type to
find the source of heterogene -ity. In addition, there are some limitations of meta-analyses. First, the number of tumor samples is not large enough to affect the effectiveness and reliability of the results. Second, a subgroup analysis is based only on systemic can-cer types. Third, ethnicity, life-style, dietary habits, and envi-ronment may affect gene ex- pression, causing differing re- sults. Therefore, to get more precise results, additional st- udies on the association of mTOR rs2295080 with can- cer risk are needed about dif-ferent ethnicities, cancer ty- pes, life-style, diet and envi- ronment.
In conclusion, our results indi-cate that rs2295080 is con-nected with a decrease in the whole cancer risk in the domi-nant-model and heterozygous-model, A subgroup analysis was performed by cancer sys-temic type, and we observed that the rs2295080 polymor-phism decreased the cancer Figure 11. Funnel plot analysis to detect publication bias for rs2995080
[image:8.612.91.378.309.499.2]Acknowledgements
This study was supported by the Jiangxi Pr- ovincial Department of Education Science and Technology Research Project (GJJ160134). Disclosure of conflict of interest
None.
Address correspondence to: Dr. Runfu Cao, Depart-
ment of Urology, The First Affiliated Hospital of
Nanchang University, 17 Yongwai Street, East Lake,
Nanchang 330006, Jiangxi, People’s Republic of
China. Tel: 88698407; Fax: +86-0791-88698407; E-mail: [email protected]
References
[1] Dancey JE. Therapeutic targets: MTOR and re-lated pathways. Cancer Biol Ther 2006; 5: 1065-73.
[2] Hudes GR. Targeting mTOR in renal cell carci-noma. Cancer 2009; 115: 2313-2320. [3] Sanghera KP, Mathalone N, Baigi R, Panov E,
Wang D, Zhao X, Hsu H, Wang H, Tropepe V, Ward M and Boyd SR. The PI3K/Akt/mTOR pathway mediates retinal progenitor cell sur-vival under hypoxic and superoxide stress. Mol Cell Neurosci 2011; 47: 145-153.
[4] Yu J, Yaba A, Kasiman C, Thomson T, Johnson J. mTOR controls ovarian follicle growth by reg-ulating granulosa cell proliferation. PLoS One 2011; 6: e21415.
[5] Kudo M. mTOR inhibitor for the treatment of hepatocellular carcinoma. Dig Dis 2011; 29: 310-315.
[6] Le Tourneau C, Faivre S, Serova M and Ray-mond E. mTORC1 inhibitors: is temsirolimus in renal cancer telling us how they really work? Br J Cancer 2008; 99: 1197-1203.
[7] Schatz JH. Targeting the PI3K/AKT/mTOR
pathway in non-Hodgkin’s lymphoma: results,
biology, and development strategies. Curr On-col Rep 2011; 13: 398-406.
[8] Martelli AM, Evangelisti C, Chiarini F, Grimaldi C, Manzoli L, McCubrey JA. Targeting the PI3K/ AKT/mTOR signaling network in acute myelog-enous leukemia. Expert Opin Investig Drugs 2009; 18: 1333-1349.
[9] Guertin DA and Sabatini DM. Defining the role
of mTOR in cancer. Cancer Cell 2007; 12: 9-22.
[10] Hsieh AC, Liu Y, Edlind MP, Ingolia NT, Janes MR, Sher A, Shi EY, Stumpf CR, Christensen C, Bonham MJ, Wang S, Ren P, Martin M, Jessen K, Feldman ME, Weissman JS, Shokat KM, Rommel C and Ruggero D. The translational landscape of mTOR signalling steers cancer
initiation and metastasis. Nature 2012; 485: 55-61.
[11] Guo F, Li J, Zhang S, Du W, Amarachintha S, Sipple J, Phelan J, Grimes HL, Zheng Y and Pang Q. mTOR kinase inhibitor sensitizes T-cell lymphoblastic leukemia for chemotherapy-in-duced DNA damage via suppressing FANCD2 expression. Leukemia 2014; 28: 203-206. [12] Xu M, Tao G, Kang M, Gao Y, Zhu H, Gong W,
Wang M, Wu D, Zhang Z, Zhao Q. A polymor-phism (rs2295080) in mTOR promoter region and its association with gastric cancer in a Chi-nese population. PLoS One 2013; 8: e60080. [13] Cao Q, Ju X, Li P, Meng X, Shao P, Cai H, Wang
M, Zhang Z, Qin C and Yin C. A functional vari-ant in the MTOR promoter modulates its ex-pression and is associated with renal cell can-cer risk. PLoS One 2012; 7: e50302.
[14] Zhao P, Lei X, Xiong H, Li J, Li H, He X. Analysis of polymorphism of mTOR gene in children with leukemia. Journal of Clinical Pediatrics 2015; 5: 423-425.
[15] Shao J, Li Y, Zhao P, Yue X, Jiang J, Liang X, He X. Association of mTOR polymorphisms with cancer risk and clinical outcomes: a meta-analysis. PLoS One 2014; 9: e97085.
[16] Zining J, Lu X, Caiyun H. Genetic polymor-phisms of mTOR and cancer risk: a systematic review and updated meta-analysis. Oncotarget 2016; 7: 57464
[17] Zhang Z, Chen Q, Zhang J, Wang Y, Hu X, Yin S, He M, Guan S, Qin W, Xiao Q, Zhao H, Yao W, Wu H and Wei M. Associations of genetic poly-morphisms in pTEN/AKT/mTOR signaling pathway genes with cancer risk: a meta-analy-sis in Asian population. Sci Rep 2017; 7: 17844.
[18] Liu T, Gulinaer A, Shi X, Wang F, An H, Cui W, Li Q. Gene polymorphisms in the PI3K/AKT/ mTOR signaling pathway contribute to prostate cancer susceptibility in Chinese men. Oncotar-get 2017; 8: 61305-61317.
[19] DerSimonian R. Meta-analysis in clinical trials. Control Clin Trials 1986; 7: 177-188.
[20] Wen J, Shi L. Association of genetic polymor-phisms in the mTOR promoter region with thy-roid cancer morbidity in han population. Guizhou Med J 2017; 42: 1149-1154.
[21] Zhao H, Chen Y, Dang T, Jia Y. Association study between SNP rs2295080 in mTOR gene and non-cardiagastric cancer. Clinical Research and Practice 2017; 4: 6-8.
[22] Qi L, Sun K, Zhuang Y, Yang J, Chen J. Study on the association between PI3K/AKT/mTOR sig-naling pathway gene polymorphism and sus-ceptibility to gastric cancer. J BUON 2017; 22: 1488-1493.
polymor-phisms in the PI3K/AKT/mTOR pathway and bladder cancer risk in a sample of Iranian population. EXCLI J 2018; 17: 3-13.
[24] Chen J, Shao P, Cao Q, Li P, Li J, Cai H, Zhu J, Wang M, Zhang Z, Qin C and Yin C. Genetic variations in a PTEN/AKT/mTOR axis and pros-tate cancer risk in a Chinese population. PLoS One 2012; 7: e40817.
[25] Huang L, Huang J, Wu P, Li Q, Rong L, Xue Y, Lu Q, Li J, Tong N, Wang M, Zhang Z and Fang Y. Association of genetic variations in mTOR with risk of childhood acute lymphoblastic leuke-mia in a Chinese population. Leuk Lymphoma 2012; 53: 947-951.
[26] Li Q, Gu C, Zhu Y, Wang M, Yang Y, Wang J, Jin L, Zhu ML, Shi TY, He J, Zhou X, Ye DW and Wei Q. Polymorphisms in the mTOR gene and risk of sporadic prostate cancer in an Eastern Chi-nese population. PLoS One 2013; 8: e71968. [27] Xu M, Gao Y, Yu T, Wang J, Cheng L, Cheng L,
Cheng D and Zhu B. Functional promoter rs2295080 T > G variant in MTOR gene is as-sociated with risk of colorectal cancer in a Chi-nese population. Biomed Pharmacother 2015; 70: 28-32.
[28] Zhu J, Wang M, Zhu M, He J, Wang JC, Jin L, Wang XF, Xiang JQ and Wei Q. Associations of PI3KR1 and mTOR polymorphisms with esoph-ageal squamous cell carcinoma risk and gene-environment interactions in Eastern Chinese populations. Sci Rep 2015; 5: 8250.
[29] Wang MY, Li QX, He J, Qiu LX, Wang YN, Li J, Sun MH, Wang XF, Yang YJ, Wang JC, Jin L and Wei QY. Genetic variations in the mTOR gene contribute toward gastric adenocarcinoma susceptibility in an Eastern Chinese popula-tion. Pharmacogenet Genomics 2015; 25: 521-530.
[30] Zhao Y, Diao Y, Wang X, Lin S, Wang M, Kang H, Yang P, Dai C, Liu X, Liu K, Li S, Zhu Y, Dai Z. Impacts of the mTOR gene polymorphisms rs2536 and rs2295080 on breast cancer risk in the Chinese population. Oncotarget 2016; 7: 58174-58180.
[31] Sato T, Nakashima A, Guo L, Coffman K and Tamanoi F. Single amino-acid changes that confer constitutive activation of mTOR are dis-covered in human cancer. Oncogene 2010; 29: 2746-2752.
[32] Ohne Y, Takahara T, Hatakeyama R, Matsuzaki T, Noda M, Mizushima N and Maeda T. Isola-tion of hyperactive mutants of mammalian tar-get of rapamycin. J Biol Chem 2008; 283: 31861-31870.
[33] Urano J, Sato T, Matsuo T, Otsubo Y, Yamamoto M and Tamanoi F. Point mutations in TOR
con-fer Rheb-independent growth in fission yeast