International Journal of Innovative Technology and Exploring Engineering (IJITEE) ISSN: 2278-3075, Volume-8, Issue-9S4, July 2019
Abstract: Generally, Air pollution alludes to the issue of toxins into the air that are harmful to human well being and the entire planet. It can be described as one of the most dangerous threats that the humanity ever faced. It causes damage to animals, crops, forests etc. To prevent this problem in transport sectors have to predict air quality from pollutants using machine learning techniques. Subsequently, air quality assessment and prediction has turned into a significant research zone. The aim is to investigate machine learning based techniques for air quality prediction. The air quality dataset is preprocessed with respect to univariate analysis, bi-variate and multi-variate analysis, missing value treatments, data validation, data cleaning/preparing. Then, air quality is predicted using supervised machine learning techniques like Logistic Regression, Random Forest, K-Nearest Neighbors, Decision Tree and Support Vector Machines. The performance of various machine learning algorithms is compared with respect to Precision, Recall and F1 Score. It is found that Decision Tree algorithm works well for predicting air quality. This application can help the meteorological Department in predicting air quality. In future, this work can be optimized by applying Artificial Intelligence techniques.
Keywords: classification, air quality index, python, accuracy, forecasting.
I. INTRODUCTION
Machine learning is to predict the future from past data. Computer studying (ML) is a style of artificial intelligence (AI) that delivers computers the capability to gain knowledge of without being explicitly programmed. Machine finding out makes a speciality of the progress of pc applications that can alternate when exposed to new information and the basics of laptop studying, implementation of a easy laptop finding out algorithm utilising python. Process of coaching and prediction involves use of specialised algorithms. It feed the training data to an algorithm, and the algorithm uses this training knowledge to offer predictions on a brand new test information. Machine finding out can be roughly separated in to three classes. There are supervised learning, unsupervised finding out and reinforcement finding out. Supervised studying software is each given the input knowledge and the corresponding labeling to be trained data must be labeled with the aid of a person previously. Unsupervised learning isn't any labels.
Revised Manuscript Received on July 13, 2019.
K. Mahesh Babu, UG Student, Department of Computer Science & Engineering, Saveetha School of Engineering.
J. Rene Beulah, Assistant Professor, Department of Computer Science & Engineering, Saveetha School of Engineering
It provided to the learning algorithm. This algorithm has to figure out the clustering of the input knowledge. Subsequently, Reinforcement learning dynamically interacts with its environment and it receives positive or bad suggestions to toughen its efficiency.
Data scientists use many one of a kind types of computing device learning algorithms to observe patterns in python that lead to actionable insights. At a high stage, these specific algorithms can also be labeled into two companies situated on the way they “gain knowledge of” about data to make predictions: supervised and unsupervised learning. Classification is the method of guessing the class of given information points. Lessons are in many instances referred to as goals/ labels or classes. Classification predictive modeling is the task of approximating a mapping function from enters variables(X) to discrete output variables(y). In computer studying and facts, classification is a supervised studying technique in which the pc software learns from the information input given to it after which makes use of this studying to classify new statement. This data set could without problems be bi-classification (like deciding upon whether the man or woman is male or female or that the mail is unsolicited mail or non-spam) or it may be multi-classification too. Some examples of multi-classification problems are: speech consciousness, handwriting awareness, bio metric identification, file classification and so forth.
II. EXISTING SYSTEM
Urban air pollutant attention forecast is coping with a surge of large ecological monitoring data and intricate alterations in air pollution. This necessitates effective estimating methods to strengthen prediction accuracy and avoid grave contamination episodes, thereby improving ecological administration resolution-making capacity. A brand new contaminant concentration estimation process is established on sizeable amounts of ecological knowledge and deep learning approaches. This integrates colossal data using two forms of deep networks. This system is situated on a design that uses a Convolutional Neural community as the bottom layer, routinely extracting features of enter information. An extended quick term reminiscence network is used for the output layer to keep in mind the time dependence of pollution. It consists of these two deep networks. With performance optimization, the model can predict future particulate topic (PM2:5) concentrations as time series. Sooner or later, the estimation outcome are related with the outcome of numerical models. The applicability and benefits of the mannequin are also analyzed.
Air Quality Prediction based on Supervised
Machine Learning Methods
Experimental outcome show that it improves prediction efficiency in comparison with basic models. Air pollution has attracted huge concentration involving the everyday lifetime of men and women. It has terrible influence on human health and everyday lifestyles throughout episodes of severe air pollution with the broaden of reasons and kinds of air pollutants, the complication of pollutant attention prediction has elevated. As a result, it's imperative to make use of ecological analyzing data to more appropriately guess city air pollution levels. Conventional prediction methods, such as numerical evaluation and machine learning, are commonly used in this kind of prediction. Nevertheless, a few drawbacks of those methods were recently recognized as given below. First, numerical prediction ways are situated on knowledge as abridged with the aid of historic information or the nature of pollutant exchange.
III. LITERATURE SURVEY
[1]Recurrent Neural Networks (RNN) has shown its effectiveness in dealing with temporal data. But, data from future which may come up later that the present time is needed for prediction. RNNs can partly acquire this via postponing the output with the aid of a specific amount of time frames to incorporate future understanding. Hypothetically, a huge lengthen could be applied but in observe, it's located that prediction outcomes drip if the extend is too big. At the same time deferring the yield by way of some borders has been applied efficiently to make stronger outcome for consecutive information, the surest extend is duty elegant and have to be received by way of the experimental and blunder process. Likewise, two distinct networks, one for each and every track would be informed on all input expertise and then the outcomes can be combined by applying arithmetic or geometric mean for ultimate forecast. Nevertheless, it's complex to receive most excellent combining considering the fact that exceptional networks trained on the identical knowledge can now not be viewed as unbiased. To overcome these obstacles, it proposed bidirectional recurrent neural community (BRNN) that may be proficient utilizing all on hand input know-how previously and future of a special time frame. Pollutant knowledge like every other sensor data shouldn't be permitted from lacking normal and anomalous values. The indiscretions may just occur due to influential mistake or any other outside reasons similar to energy-blocking or compensation of connectivity and so on. There have been occasions the place pollutant data used to be no longer suggested by a source observing post. These lacking values were incorporated making use of systematic data values of previous occasions. If a value lies out of scope, the allowable variety for an attribute is handled as an anomalous worth. Irregular values can be changed with the aid of rolling natural of prior three instances. It offered a robust manner of predicting the severity of pollution through the readings received from different sensors in 6, 12 and 24 hour upfront making use of Deep learning items. This claim is verified over the data from pollution Department from New Delhi, India via forecasting the concentration of PM2.5 pollutant. We gift our investigations with assessment to reference line method over distinct posts and over
exceptional time phases. Additionally, we have now awarded a Collaborative process which achieves good in lots of the circumstances, and also attests to be extra effective.
[2] It's apparent that folks that labor in a company or concern are possible to be exposed to the hazard of breathing damaging chemical compounds and air because of their constant acquaintance to pollutants. Air pollution provides to the hazardous situation that creates negative influence on dwelling items. It is likely an actual consideration for the whole earth. Contamination of the air is a global trouble even for multi-national companies, governments, and the mass media. Making use of ordinary possessions at a better fee than the character's capability to rebuild it can cause pollution of vegetation, air, and water. As opposed to the works done by people, there are other causes that result in the release of harmful toxins. Apart from quests made by men, natural calamities reminiscent of many kinds may have an outcome in infecting the air. Technology has advanced in almost all areas and movements of living organisms. In the current world everything is completed making use of new science with a view to satisfy the demand of person, institution, manufacturer and so on. Internet of matters (IoT) is without doubt one of the predominant exchanging information traits within the last ten years. By means of this thought, it's feasible to attach numerous embedded objects that consume less power.
[3] Outside air nice performs an essential role in human well being. Air pollution reasons colossal raises in scientific costs, disease and is assessed to intent nearly 800,000 yearly hastydemises global (Cohen et al., 2005). The outside air commonly includes physically expressively phases of numerous pollution together with particulates (PM10 or PM2.5), ozone, carbon monoxide, oxides of nitrogen and sulfur, bioaerosols, metals, volatile organics and pesticides. A gigantic proportion of those pollution are formed by way of anthropogenic events. Though most persons devote nearly every hour inside their houses, outside air exceptional may disturb the air inside to a tremendous measure. Furthermore many sufferers corresponding to asthmatics, patients with allergies and chemical sensitivities, COPD patients, heart and stroke sufferers, diabetics, pregnant women, the aged and children are mainly vulnerable.
International Journal of Innovative Technology and Exploring Engineering (IJITEE) ISSN: 2278-3075, Volume-8, Issue-9S4, July 2019
Three machine learning (ML) algorithms are analysed to construct precise estimation of items for single and various steps ahead of concentrations of floor-degree ozone (O3), nitrogen dioxide (NO2), and sulfur dioxide (SO2). These ML algorithms are support vector machines, M5P model bushes, and artificial neural networks (ANN). Two forms of simulation are tried out: 1) uni-variate and 2) multivariate. The parameters used for analyzing the performance are prediction pattern accuracy and root mean squarer error (RMSE). The outcome proves that utilizing unique attributes in multivariate simulation with M5P algorithm yields good estimation. Air satisfactory is an fundamental crisis that immediately influences human health. Air exceptional knowledge are gathered wirelessly from monitoring motes. These information are analyzed and used in forecasting awareness values of pollutants using clever desktop to computer platform. The platform makes use of ML-centered algorithms to build the forecasting items by studying from the amassed information.
[5] Assessing air pollution in cities is a critical errand. Source records are not up to data and are not available. Because of this, the forecast results of numerical models may not be accurate and sufficient. Hence we cannot get advantage from such methods. To overcome this problem, this research work proposes a complete analysis system to make the forecast results stronger and accurate. Experimentations on distinct attribute organizations have given findings which are very much helpful. It was tested with the air pollution data from China and some other metropolitan cities from around the world. The parameter air quality index (AQI) is used to measure the amount of pollution in air in a particular urban area. This will be helpful for the Government to assess the condition of quality of air and to take the necessary steps to control pollution in urban areas. Thus this work is helpful to the society as a whole for all living organisms.
IV. PROBLEM STATEMENT
Observing and retaining high standard air has become the crucial challenge in metropolitan areas which have more industries, companies and population. As there is a rise in population, there is an increase in the transportation, usage of electricity and fuels. There is a lot of waste dumped in the land which we are well aware of. The air is also highly contaminated which causes a more serious threat to all kinds of living organisms in the earth. This gives rise to the need for monitoring and assessing the quality of air and accordingly the government should be given alert to take necessary actions. This research work concentrates on performing an effective analysis on all the major works done in this aspect using machine learning algorithms.
V. PROPOSED SYSTEM
Exploratory Data Analysis of Air Quality Prediction A couple of datasets from exclusive sources can be combined to type a generalized dataset, and then one of a kind computing device finding out algorithms can be utilized to extract patterns and to receive outcome with maximum accuracy.
Data Wrangling
On this component to the record will load in the information, determine for cleanliness, and then trim and easy given dataset for evaluation. Make sure that the file steps carefully and justify for cleansing decisions.
Data collection
Air Quality data is collected from UCI machine learning repository which lists many datasets for performing machine learning in almost all disciplines like disease prediction dataset, intrusion detection dataset and many others of the like.
Preprocessing
The data we get from different sources may contain inconsistent data, missing values and repeated data. To get proper prediction result, the dataset must be cleaned, missing values must be taken care of either by deleting or by filling with mean values or some other method. Also redundant data must be removed or eliminated so as to avoid biasing of the results. Some dataset may have some outlier or extreme values which also have to be removed to get good prediction accuracy. Classification and clustering algorithms and other data mining methods will work well only if all this preprocessing is done on the data.
Building the classification model
1. The predicting the air excellent obstacle, choice tree algorithm prediction mannequin is effective on account that of the following factors: It presents higher outcome in classification difficulty.
2. First we have to divide the data set into training and testing set. The predicting model is first trained with the training dataset. Later it will be tested with the testing set. Otherwise k-fold cross validation can also be used
3. After testing the model, the accuracy of the model is estimated by using parameters like detection rate, precision, recall, F-Measure and overall accuracy.
Construction of a Predictive Model
VI. MODULE DESCRIPTION
Variable Identification Process
Exploration data analysis of visualization
Probability of Loan Analysis
Outlier detection process
Comparing Algorithm with prediction in the form of best accuracy result
Variable Identification Process
Validation strategies in computing device finding out are used to get the error expense of the computing device finding out (ML) mannequin, which can also be regarded as practically the actual error fee of the dataset. If the data quantity is colossal enough to be representative of the populace, you may no longer need the validation methods. Nonetheless, in real-world eventualities, to work with samples of knowledge that will not be a real representative of the populace of given dataset. To discovering the lacking value, duplicate price and description of data variety whether it's waft variable or integer.
It as desktop finding out engineers use this information to best-tune the model hyper parameters. Data assortment, knowledge evaluation, and the process of addressing information content material, best, and constitution can add up to a time-drinking to-do record. In the course of the system of knowledge identification, it helps to comprehend your knowledge and its houses; this potential will aid you decide on which algorithm to make use of to construct your model. For instance, time sequence information may also be analyzed by way of regression algorithms; classification algorithms can be utilized to investigate discrete knowledge. For example to show the info sort structure of given dataset.
Data Validation/ Cleaning/Preparing Process
Importing the library packages with loading given dataset. To analyzing the variable identification by using knowledge shape, information sort and evaluating the missing values, duplicate values. A tuning model's and procedures that you should use to make the nice use of validation and scan datasets when evaluating your units. Information cleaning / getting ready by means of rename the given dataset and drop the column etc. To research the uni-variate, bi-variate and multi-variate procedure. The steps and procedures for data cleansing will range from dataset to dataset. The main purpose of information cleansing is to realize and get rid of errors and anomalies to increase the worth of knowledge in analytics and selection making.
Exploration data analysis of visualization
Data visualization is a most important talent in applied facts and laptop learning. Statistics does indeed focus on quantitative descriptions and estimations of knowledge. Knowledge visualization provides an essential suite of instruments for gaining a qualitative understanding. This may also be precious when exploring and getting to know a dataset and may help with opting for patterns, corrupt knowledge, outliers, and much more. With a little area advantage, knowledge visualizations can be used to precise and exhibit key relationships in plots and charts which are extra visceral and stakeholders than measures of association or significance. Information visualization and exploratory knowledge evaluation are whole fields themselves and it'll advise a deeper dive into some the books mentioned at the finish.
There are many fine plotting libraries in Python and it suggest exploring them with a view to create presentable graphics. For rapid and soiled plots meant on your own use, it recommends making use of the matplotlib library. It is the groundwork for a lot of different plotting libraries and plotting aid in greater-degree libraries corresponding to Pandas. The matplotlib presents a context, one where a number of plots can be drawn earlier than the photo is proven or saved to file and context may also be accessed via features on pyplot.
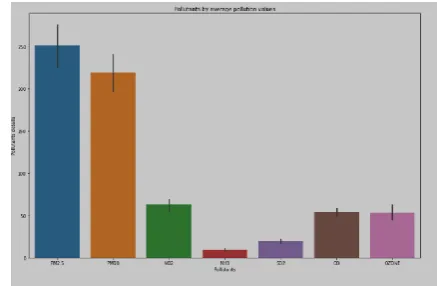
Bar Chart:
[image:4.595.315.534.445.588.2]A bar chart is commonly used to gift relative quantities for more than one classes. The x-axis represents the classes and are spaced evenly. The y-axis represents the wide variety for every category and is drawn as a bar from the baseline to the proper degree on the y-axis.
Fig. 1 Pollutants by average pollution values
Box and Plot
International Journal of Innovative Technology and Exploring Engineering (IJITEE) ISSN: 2278-3075, Volume-8, Issue-9S4, July 2019
Fig. 2 Average pollution range of each pollutant
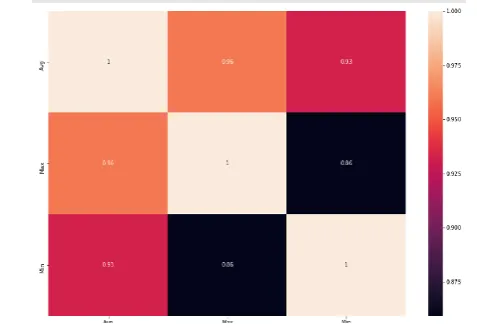
Heat map
[image:5.595.309.543.263.385.2]A heat map is a graphical portrayal of information where the individual qualities contained in a lattice are spoken to as hues. It is somewhat similar to looking an information table from above. It is extremely valuable to show a general perspective on numerical information, not to remove explicit information point. It is very straight forward to make a heat map, as appeared on the models underneath.
Outlier detection process
Many machine studying algorithms are touchy to the range and distribution of attribute values within the input knowledge. Outliers in enter information can skew and misinform the educational procedure of machine studying algorithms resulting in longer training instances, less accurate units and eventually poorer outcome.
Indeed, even before prescient models are good to go on instructing information, exceptions can result in tricky portrayals and thus tricky translations of gathered data. Exceptions can slant the unique conveyance of trait esteems in clear certainties like mean and typical deviation and in plots like histograms and scatterplots, compacting the body of the data. Subsequently, outliers can represent examples of information circumstances that are critical to the concern reminiscent of anomalies in the case of fraud detection and computer safety.
It couldn’t fit the model on the learning information and might’t say that the mannequin will work appropriately for the actual knowledge. For this, we need to guarantee that our mannequin obtained the right patterns from the data, and it's not getting up an excessive amount of noise. Cross-validation is a technique where we instruct our model making use of the subset of the info-set and then overview utilising the complementary subset of the info-set.
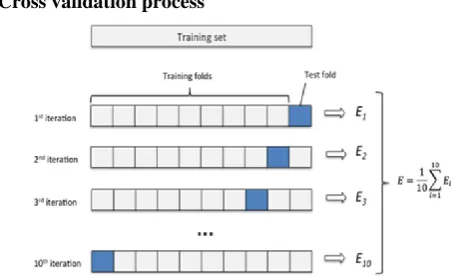
The three steps involved in cross-validation are as follows:
1. Reserve some portion of sample data-set. 2. Using the rest data-set train the model.
3. Test the model using the reserve portion of the data-set.
Advantages of train/test split
1. This runs ok occasions faster than go away One Out go-validation considering that okay-fold cross-go-validation repeats the train/experiment break up k-times.
2. Less difficult to examine the specific results of the checking out process.
Advantages of cross-validation:
1. Extra accurate estimate of out-of-sample accuracy. 2. More “efficient” use of knowledge as every commentary is used for both coaching and trying out.
Fig.3 Air Quality good Vs Air quality bad Pre-processing refers back to the transformations utilized to our knowledge earlier than feeding it to the algorithm. Information Preprocessing is a manner that's used to transform the raw knowledge into a smooth information set. In different phrases, each time the info is gathered from exceptional sources it's amassed in uncooked layout which isn't viable for the analysis. To reaching higher outcome from the utilized model in computer learning procedure of the data has to be in a proper manner. Some particular computing device finding out mannequin wants knowledge in a distinct structure, for illustration, Randomwoodland algorithm does no longer help null values. For this reason, to execute random wooded area algorithm null values have to be managed from the long-established uncooked knowledge set. And one other facet is that information set must be formatted in such a way that a couple of computing device studying and Deep studying algorithms are done in given dataset.
False Positives (FP): When the air quality is actually good and if our prediction algorithm predicts that it is poor, then it is called false positive.
False Negatives (FN): If the air quality is actually bad and if our prediction algorithm predicts that it is good then it is called false negative.
True Positives (TP): If the air quality is bad and if it is correctly predicted to be bad then it is true positive
[image:5.595.46.285.283.450.2]First we have to calculate the values of FP, FN, TP and TN. Then based on these values, by applying formulas we can compute detection rate, false positive rate, precision, recall, f-measure and other parameters.
Comparing Algorithm with prediction in the form of best accuracy result
It's predominant to examine the performance of more than one special computer finding out algorithms always and it'll realize to create a experiment harness to compare multiple extraordinary computer finding out algorithms in Python with scikit-study. It could use this experiment harness as a template on your possess desktop finding out problems and add extra and distinct algorithms to compare. Each model may have special performance characteristics. Utilizing resampling ways like pass validation that you could get an estimate for the way accurate each and every mannequin may be on unseen data. It wants to be in a position to use these estimates to prefer one or two best models from the suite of models that you've got created. When have a brand new dataset, it's a just right idea to imagine the information utilizing unique systems with the intention to seem on the information from one of a kind perspectives. The same proposal applies to mannequin choice. You should utilize a quantity of extraordinary ways of watching at the estimated accuracy of your laptop learning algorithms in order to prefer the one or two to finalize. A technique to try this is to make use of one-of-a-kind visualization methods to exhibit the natural accuracy, variance and other homes of the distribution of mannequin accuracies.
In the next part you are going to notice exactly how you can do that in Python with scikit-study. The key to a reasonable assessment of computer learning algorithms is ensuring that each and every algorithm is evaluated in the identical approach on the same information and it may possibly achieve this by using forcing each and every algorithm to be evaluated on a consistent test harness.
Prediction result by accuracy
Logistic regression algorithm also makes use of a linear equation with impartial predictors to foretell a value. The expected price may also be anywhere between poor infinity to optimistic infinity. It want the output of the algorithm to be categorised variable knowledge. Better accuracy predicting result is logistic regression model with the aid of comparing the great accuracy.
Cross validation process
Over-becoming is a customary quandary in computer learning which can occur in most items. K-fold go-validation can be conducted to confirm that the model isn't
over-equipped. In this procedure, the data-set is randomly partitioned into k mutually exclusive subsets, each and every roughly equal dimension and one is saved for checking out while others are used for training. This method is iterated for the duration of the whole ok folds.
True Positive Rate (TPR) = TP / (TP + FN) False Positive rate (FPR) = FP / (FP + TN)
Accuracy: The proportion of the complete number of predictions that's right otherwise overall how as a rule the model predicts properly defaulters and non-defaulters.
Accuracy calculation
Accuracy = (TP + TN) / (TP + TN + FP + FN)
Accuracy is essentially an important efficiency parameter and it is without problems. It is the ratio of properly expected commentary to the total number of records. We may think that, if we've got excessive correctness then the mannequin is exceptional.
Precision: The percentage of confident predictions which can be surely right.
Precision = TP / (TP + FP)
It is the ratio of safely envisioned constructive records to the complete predicted optimistic records. Recall: The proportion of positive observed values correctly predicted. (The proportion of actual defaulters that the model will correctly predict)
Recall = TP / (TP + FN)
F-Measure: F1 rating is the weighted typical of Precision and recall. Actually a good predictor should have detection rate and low false positive rate. F-Measure give a tradeoff between the two most important parameters.
General Formula:
F- Measure = 2TP / (2TP + FP + FN) F1-Score Formula:
F1 Score = 2*(Recall * Precision) / (Recall + Precision)
[image:6.595.48.285.611.749.2]VI. SYSTEM ARCHITECTURE
Fig. 4 System Architecture
International Journal of Innovative Technology and Exploring Engineering (IJITEE) ISSN: 2278-3075, Volume-8, Issue-9S4, July 2019
the excellent option to effectively translate necessities in to a completed application product. Design creates a representation or mannequin, presents element about software information structure, architecture, interfaces and add-ons which are vital to put into effect a procedure.
Advantages
Analyzes ongoing visitors, recreation, transactions, and conduct for anomalies. Skills to discover earlier unknown varieties of assaults. Catalogs the diversities between baseline behavior and ongoing exercise. An sensible procedure to maximize the awareness fee of community attacks.
VII. FUTURE ENHANCEMENT
India meteorological department wants to automate the detecting the air quality is good or not from eligibility process (real time).
To automate this process by show the prediction result in web application or desktop application.
To optimize the work to implement in Artificial Intelligence environment.
VII. CONCLUSION
The analytical procedure began from information cleaning and processing, incomplete records, detailed evaluation and in the end model constructing and evaluation. The first-rate accuracy on public test set is good parameter values of decision tree method process by way of accuracy with classification record. This application can help India meteorological division in predicting the way forward for air nice and its reputation and will depend on that they are able to take motion.
REFERENCE
1. V. M. Niharika and P. S. Rao, “A survey on air quality forecasting techniques,”International Journal of Computer Science and Information Technologies, vol. 5, no. 1, pp.103-107, 2014.
2. NAAQS Table. (2015). [Online]. Available:
https://www.epa.gov/criteria-air-pollutants/naaqs-table
3. E. Kalapanidas and N. Avouris, “Applying machine learning techniques in air quality prediction,” in Proc. ACAI, vol. 99, September 2017.
4. Questioning smart urbanism: Is data-driven governance a panacea? (November 2, 2015). [Online]. Available:http://chicagopolicyreview.org/2015/11/02/questioning-smart-urbanism-is-data-driven-governance-a-panacea/
5. D. J. Nowak, D. E. Crane, and J. C. Stevens, “Air pollution removal by urban trees and shrubs in the United States,”Urban Forestry &Urban Greening, vol. 4, no. 3, pp. 115-123, 2014`.
6. T. Chiwewe and J. Ditsela, “Machine learning based estimation of Ozone using spatio-temporal data from air quality monitoring stations,” presented at 2016 IEEE 14th International Conference on Industrial Informatics (INDIN), IEEE, 2016.