International Journal of Innovative Technology and Exploring Engineering (IJITEE) ISSN: 2278-3075,Volume-8 Issue-11, September 2019
Abstract:The producer and the consumers show their interest in accepting the lot with good quality by checking the lot with minimum sample size. In this paper for given Acceptance Sampling Limit and Limiting Quality Limit we have designed the multiple deferred sampling plans using Truncated Poisson distribution to minimize the risk by considering the sample size in account. Here overall risk for wrong decision is considered as optimization criteria. Tables and procedures are derived using Truncated Poisson distribution and also it is compared with the existing Poisson distribution to find optimum result
.
Keywords : Acceptable Quality Level (AQL), Attribute Plan, Limiting Quality Level (LQL), Minimum Risk Plan, Multiple Deferred State Sampling plan(MDS-1), Truncated Poisson Distribution.
I. INTRODUCTION
Acceptance sampling is the common quality control techniques used in an industry to maintain the quality of the product. During the acceptance sampling it leads to two types of inspection. The lot is inspected before the product supplied to the customer is outgoing inspection, if the quantity of product is inspected by the customers after they received the product from the vendor is incoming inspection. In multiple sampling plans pre-determined samples are taken to make the decision about the acceptance and the rejection of the product produced. Acceptable quality level (AQL) and Rejectable quality level (RQL) are the two important quality indices for the consumer and producer in taking the quality decision of the product. Operating Characteristic (OC) curve is used to visualize the performance of the various sampling plans. By considering the Economical, Managerial and Practical issues Golub[10] have fixed the size of the sample to design the single sampling plan using the binomial distribution to reduce the risk of both producer and the consumer for fixed AQL and LQL .In Golub[10] have found larger sum of producer and consumer risk, so Soundararajan [11] extended this work to Poisson distribution to reduce the risk. Wortham and Basker[12] have introduced the concept of MDS plan. Similarly Rembert Vaesert [13] has given the MDS-1(c1, c2) plan which was the prolongation of Dodge [14] chain sampling type – 1. In single sampling plan Soundararajan and Govindaraju[15] modified the work of Golub[10] for specified level to reduce the risk of producers and consumers. Soundararajan and Vijayaraghavan [16]
Revised Manuscript Received on September2, 2019.
Dr. K. Subramani , Department of Statistics, Government Arts College, Coimbatore, India. Email: [email protected]
Mrs.S.Ambika,Department of Mathematics,Sri Krishna Arts and Science College, Coimbatore, India.. Email: [email protected]
Dr. Haridoss Venugopal, Department of Statistics, Madras Christian College,Chennai, India. Email: [email protected]
have developed table of MDS-1 fixed values of the parameter which reduce the risk for np1 and np2 values gives the operating ratio p2/p1. Using Poisson distribution Subramani and Govindaraju [17] has developed the table of MDS-1 with fixed AQL and LQL which reduce the sum of risk.
A. Review of the Lecturer
MohdAzriPawan Teh, et.al [1] made a study on Group chain sampling plan to reduce the cost and time for gamma distribution. Optimal Parameter of RGS plan for Variable inspection was developed using Capability indices by M. S. Fallah Nezhad , S. Seifi [2], they also developed and compared the DSP and MDS plan for resubmitted lot . R. Afshari ,B. Sadeghpour Gildeh[3], given thefuzzy multiple deffered state sampling plan for proportional uncertain parameter, it is compared with fuzzy single, double and sequential sampling plan. Followed to this Robab Afshari et.al[4], proposed FMDS for defective items of uncertain proportion and designed the OC curve by using theory of fuzzy mathematics. The quality based coefficient of variation and non-linear optimization model is used to solve the parameters of the developed MDS plan by Yan et al. [5]. Based on Bayesian methodology S.Balamurali [6] proposed the MDS plan using Gamma poison distribution. Saminathan Balamurali [7] developed the MDS plan based on current and successive lot sample information, the product quality is measured by median life.
Robab Afshari, et.al.[8] , designed the Fuzzy MDS plan with null and unit acceptance number is more powerful while comparing the good and the bad lot of the already existing (FSSP). S.Balamurali, et.al [9] has proposed the MDS plan and constructed the table for different unification of producer's and consumer's risks using Weibull distribution with test based on time truncation. Subrmani.K and Haridoss.V[18] developed the table for RGS plan using Weighted Poisson distribution to reduce the risk for fixed sample size. Subrmani.K and Haridoss.V[19] has given the idea for vendor and buyers to minimize the risk using Weighted Poisson distribution for Single sampling plan. Subrmani.K and Haridoss.V [20] & [21] has extended their work for Multiple Deferred sampling plan and Tightened-Normal-Tightened system using Weighted Poisson Distribution.
Designing Optimal Multiple Deferred State
Mds–1 Sampling Plan using Truncated Poisson
Distribution
II. SOP OF MDS-1 PLAN
MDS-1 plans are prolongation of Dodge Chain sampling plan. It is applicable to Type B situations for which the quality of the lot submitted for inspection has the same quality of product. Reduction in sample size is similar for both MDS-1 and ChSP comparing to SSP and DSP. The MDS–1 plan SOP is as follows
1. n units of samples are selected from the submitted lot to test for conformance of the specific
requirement.
2. If d, the observed number of nonconformities is atmost c1 accept the lot, if d is greater than c2 reject the lot
3. The consignment is accepted if c1 < d ≤ c2, when the samples are taken from or ‘m’ preceding or succeeding lots, the number of nonconformities found atmost to c1. Otherwise the lot is declined.
III. TRUNCATED POISSON DISTRIBUTION When k > 0, the truncation stipulates and the truncated distribution will become the Truncated Poisson distribution. From the standard Poisson distribution the PMF of the truncated distribution can be derived as follows
The Zero Truncated Poisson distribution is also known as Positive Poisson Distribution or Conditional Poisson distribution, since it is a discrete distribution which supports the group of positive integers. If the value of the random variable is positive then the Truncated Poisson distribution will be the joint Probability distribution of the discrete random variable with the condition of the Poisson distribution.
A. Selection of Minimum Risk MDS–1 Plan
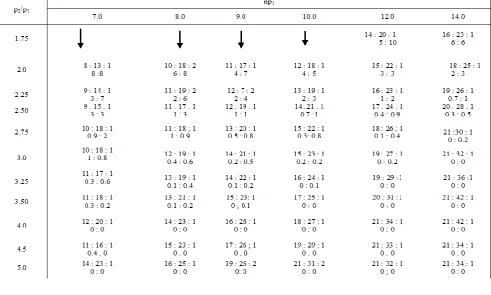
Truncated Poisson distribution is used to select an MDS-1 Plan system for given AQL (p1) and LQL (p2) which involves in reducing the sum of risks. For this plan Table-1 is constructed by assuming the risk of producers and consumers to at most 10% of each. The parameters of the MDS–1 plan m,c1, and c2 is furnished in Table 1 for the
exact values of p2/p1.The associated producer’s risk and consumer’s risk (α & β respectively) in the body of the table against the product of sample size (n) and AQL (np1). With the given p1, p2 α and β one can find MDS–1 as follows.
1. Calculate p2/p1 as the operating ratio
2. Identify the value of p2/p1 in Table-1 which is just less or equal to the calculated value in previous step 3. Find the parameter of MDS-1 by identifying row of the
Table 1 from left to right. The producer and consumer risk given will be equal or just below the assumed risk value.
4. From the parameters obtained from step 3, the values of np1 are used to find the sample size by n=np1/p1
Example:
If p1= 0.02(2%) and p2 = 0.05(5%) fixed for α = 0.01(1%) and β = 0.02(2%) , from the Table-1 the MDS-1 plan for truncated distribution is given as
1. p2/p1 = 0.05/0.02 = 2.5
2. In the Table -1 find the value of the operating ratio 2.5
3. Corresponding to the operating ratio the parameters are found from Table-1 as c1 = 12, c2 =19, m =1 with α = 1% and β = 1% against the fixed value of α = 1% and β = 2%. 4. Sample size n = np1/p1= 9/0.02 = 450
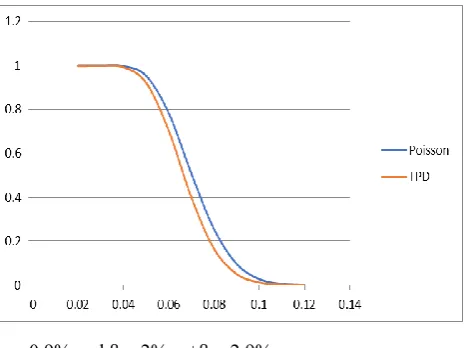
B. Comparison of MDS-1 Truncated Poisson distribution with MDS-1 Poisson distribution:
The operating ratio p2/p1 assumed in the Table-1 to find the parameters of the MDS-1 for the corresponding minimum sum of consumers and producers risk is compared with the table developed in 1990 by Subramani and
Govindaraju for selection of MDS-1 using the Poisson distribution.
For Example: In the MDS-1 Plan using Poisson distribution of Subramain and Govindaraju(1990) work, If we fixes the values of p1= 0.02, p2=0.03, α = 0.01 and β = 0.03 we get n= 150, c1 = 0, c2 = 9, m= 1 with α = 2% and β = 3%, α+β = 5% .
Under the same condition for MDS-1 Plan using truncated Poisson distribution we get n= 150, c1 = 5, c2 = 9, m= 1 with
[image:2.595.302.536.392.566.2]α = 0.9% and β = 2%, α+β = 2.9%.
International Journal of Innovative Technology and Exploring Engineering (IJITEE) ISSN: 2278-3075,Volume-8 Issue-11, September 2019
Table-1 Comparison of MDS-1(c1, c2) Sampling Plans
C. MDS-1 Plan Selection for Fixed sample size: Table-1 constructed using truncated Poisson distribution csn used for practical and administrative purpose of fixed sample size. If n =40, AQL =0.025 and LQL = 0.05 is fixed then we get np1 = (40)(0.025)= 1 and p2/p1 = 0.5/0.025 = 20. The plan with minimum risk from Table-1 is obtained as
n=40, c1=4, c2= 10 , m=1 (α = 0%, β= 0%) For the various values of α and β, Table -2 illustrates the comparison between two models
D. Construction of the Table-1:
The OC curve of the MDS–1 plan using truncated distribution is constructed in Table 1.
(1) Where,
(2)
(3)
Sum of producers and consumers risk expression is shown as (4)
The value of np2 for known operating ratio and np1 are given as
(5)
Thus, the expression (4) for the minimum sum of risks in expression (4) can be written in terms of p2/p1 and np1 as
(6) Expression (6) is used to construct table-1 for c1 = 0(1)30, c2 = c1 + 1(1) c1 + 15 and m = 0(1)10, computerized coding is used to identify the minimum sum of risk for fixed values of np1 and p2/p1. The minimum sums of producer’s and consumer’s risks are identified corresponding to c1, c2 and m values.
Given Values K.Govindaraju and K.Subramani (1990) Poisson Distribution Truncated Poisson distribution
p1 p2 α β c1 c2 m Α β c1 c2 m α β
0.01 0.03 0.01 0.03 0 7 1 0.01 0.01 5 11 2 0.04 0.007
0.01 0.03 0.05 0.05 0 5 1 0.06 0.06 4 7 1 0.02 0.03
0.01 0.06 0.05 0.05 0 5 2 0(<0.1%) 0.05 3 6 1 0(<0.1%) 0.03
TABLE 2: Parameters of MDS – 1 Plan for given p2/p1 and np1 using Truncated Poisson Distribution
p2/p1
np1
1.0 1.5 2.0 2.5 3.0 4.0 5.0 6.0
2.25 6 :10 :1
7 : 9
8 : 15 : 2 4 : 8
2.50 5 : 9 : 1
5 : 9
7 : 13 : 2 3 : 7
8 : 13 : 1 2: 4
2.75 4 : 9 : 2
6 : 9
5 : 9 : 1 5 : 5
7: 11: 1 2 : 4
8 : 14: 1 2: 2
3.0 3 : 6 : 1
8 : 7
4 : 7 : 1 4 : 6
6 : 12 : 2 2 : 5
7 : 12 : 1 2 : 2
9 : 14 : 1 0.8 : 1
3.25 4 : 8 : 2
2: 9
4 : 8 :1 4 : 4
6 : 10 ; 1 1 : 3
8 : 16 :2 0.9 : 1
9 : 16 : 1 0.7 : 0.7
3.50 3 : 7 : 2
5 : 8
4 : 9 : 2 2 : 6
5 : 9 : 2 1 : 5
6 : 11 : 1 1 : 1
8 : 13 :1 0.5 : 1
10 : 20 : 2 0.3 : 0.6
4.0 2 : 5 : 1
6 : 8
3 : 6 : 1 2 : 5
4 : 7 : 1 2 : 3
5 : 9 : 1 0.9 : 1
7 : 11 : 1 0 :1
9 : 14 : 1 0.1 : 0.6
10 : 18 : 1 0.1 : 0.1
4.5 2 : 4 : 2
3 : 17
2 :5 :1 6 : 4
3 : 7 : 1 2 : 2
4 : 8 : 1 2 : 2
5 : 10 :1 0.8 : 0.9
7 : 13 : 1 0.2 : 0.3
9 : 16 : 1 0.1 : 0.1
11 : 19 : 1 0 : 0
5.0
2 : 5 : 2 3 : 12
3 : 7 : 2 1 : 6
4 : 9 : 2 0.7 : 2
5 : 11 : 2 0.4 : 1
6 : 10 :1 0.2 :0.8
8 : 13 :1 0 : 0.2
10 : 18 : 1 0 : 0
12 : 22 :1 0 :0
[image:4.595.60.552.390.685.2]International Journal of Innovative Technology and Exploring Engineering (IJITEE) ISSN: 2278-3075,Volume-8 Issue-11, September 2019
p2/p1
np1
0.15 0.20 0.25 0.40 0.50 0.60 0.75 1.0 1.5 2.0 2.5
5.5 1 : 3 : 1
12 : 9
2 : 5: 2 3 : 9
3 : 7 : 2 1 : 4
4 : 7 : 1 0.4 : 2
5 : 9 : 1 0.2 : 0.7
6.0 1 : 3 : 1
12 : 6
2 : 6 : 2 3 ; 6
3 : 6 : 1 0.8 : 3
4 : 8 : 1 0.4 : 0.9
5 : 10 : 1 0.2 : 0.3
6.5 1 : 3 ; 1
8 : 11
2: 4 : 2 1 : 13
2 : 4 : 1 2 : 5
3 : 6 : 1 0.8 : 1
4 : 8 :1 0.4 : 0.4
5 : 10 : 1 0.2 : 0.1
7.0 1 : 3 : 1
8 : 8
2 : 4 :2 1 : 10
2 : 4 : 1 2 : 3
3 : 7 : 1 0.7 : 0.8
4 : 9 : 1 0.3 : 0.2
6 : 11 : 1 0 : 0.1
8.0 1 : 3 : 1
6 : 10
1 : 3 : 1 7 : 5
2 : 4 : 2 1: 6
2 : 5: 1 2 : 2
4 : 9 :2 0.1 : 0.8
5 : 9 : 1 0 : 0.1
6 : 12 : 1 0 : 0
9.0 1 : 3 : 1
5 ; 6
2 : 4 : 2 0.6 : 9
2 : 6 : 2 1 : 4
3 : 7 ; 2 0.2 : 2
4 : 8 : 1 0 : 0.3
5 : 10 : 1 0 : 0
7 : 13 : 1 0 : 0
10.0 1 : 3 : 1
6 : 4
2 : 5 : 2 0.5 : 6
2 : 4 : 1 0.7 : 2
3 : 8 : 2 0.1 : 1
4 : 9 : 1 0 : 0
6 : 11 : 1 0 : 0
7 : 14 : 1 0 : 0
12.0 1 : 3 : 2
3 : 10
1 : 3 : 1 4 : 5
2 : 4 : 2 0.3 : 2
2 : 5 : 2 0 : 1
2 : 5 : 1
0 : 0.6 3 : 7 : 1
0 : 0.2
5 : 9 : 1 0 : 0
6 : 13: 1 0 : 0
8 : 16 : 1 0 : 0
15.0 1 : 2 : 2
2 : 16
1 : 3 : 2 3 : 9
1 : 3 : 1 4 : 2
2 : 5 : 2 0.2 : 2
2 : 5 ; 1 0 : 0
3 : 8 : 2 0 : 0
4 : 7 : 1 0 : 0
6 : 12 :2 0 : 0
8 : 14 :2 0 : 0
10 : 17 : 2 0 : 0
17.0 1 : 3 : 2
2 ; 12
1 : 3 :2 3 : 6
2 : 5 : 2 0.1 : 3
2 : 4 : 1 0.1: 0.9
2 : 5 : 1 0 : 0
3 : 6 : 1 0 : 0.1
4 : 8 : 1 0: 0
6 : 12 : 1 0 : 0
8 : 16 : 1 0: 0
10 : 19 : 1 0 : 0
20.0 1 : 2 : 2
1 : 16
1 : 3 :2 2 : 8
1 : 3 : 1 1 : 4
2 :5 : 2 0.1 : 1
2 : 5 : 1 0.1 : 0.3
3 : 7 :2 0 : 0
3 : 7 : 1 0 : 0
4 : 10 : 1 0 : 0
7 : 14 :2 0 : 0
9 : 18 : 2 0 : 0
12: 20 : 2 0 : 0
IV. CONCLUSION
Minimizing the overall risk of taking wrong decision by the consumers and producers who belongs to same organization of same area of interest for fixed AQL and LQL is considered as the main objective of this paper. In our work we constructed the table-1 for multiple deferred sampling plan -1 (c1,c2) using Truncated Poisson. We have analyzed the work and found that MDS-1 using truncated Poisson distribution reduces the risk of producer and consumer compare to MDS-1 plan using Poisson distribution.
REFERENCES
1. MohdAzriPawan Teh, Nazrina Aziz, Zakiyah Zain , “Constructing Group Chain Acceptance Sampling Plans (GChSP) for Gamma Distribution”, International Journal of Innovative Technology and Exploring Engineering (IJITEE), ISSN: 2278-3075, Volume-8 Issue-5S March, 2019
2. M. S. Fallah Nezhad and S. Seifi , “Designing Different Sampling Plans Based on Process Capability Index”, IJE Transactions B Applications Vol. 29, No. 8, pp.1120-1130, July 2016
3. R. Afshari ,B and Sadeghpour Gildeh , “Designing a Multiple Deferred State Attribute Sampling Plan in a Fuzzy Environment”, American Journal of Mathematical and Management Sciences, Volume 36, Issue 4, July 2017.
4. Robab Afshari, Bahram Sadeghpour Gildeh and Majid Sarmad ,
“Multiple Deferred State Sampling Plan with Fuzzy Parameter”, International Journal of Fuzzy Systems, Volume 20, Issue 2, pp. 549–557,2018.
5. Aijun Yan, Sanyang Liu and Xiaojuan Dong , “Designing a multiple dependent state sampling plan based on the coefficient of variation”, Yan et al. SpringerPlus, August 2016.
6. Balamurali, S., Jeyadurga and P., Usha , M., “Designing of Bayesian multiple deferred state sampling plan based on Gamma Poisson distribution”. Am. J. Math. Manag. Sci. Volume 35, Issue 1,
pp.77–90 ,2015
7. Saminathan Balamurali,P. Jeyadurga and Mahalingam Usha ,
“Designing of multiple deferred state sampling plan for generalized inverted exponential distribution”, Sequential Analysis Design Methods and Applications Volume 36, Issue 1 pp. 76-86,December 2017
8. Robab Afshari, Bahram Sadeghpour Gildeh and Majid Sarmad ,
“Multiple Deferred State Sampling Plan with Fuzzy Parameter”,
International Journal of Fuzzy Systems, Volume 20, Issue 2, pp. 549–557,2018.
9. S.Balamurali,P. Jeyadurga & M.Usha , “Optimal Designing Of A Multiple Deferred State Sampling Plan For Weibull Distributed Life Time Assuring Mean Life , American Journal Of Mathematics and Mangment Science”, Volume 36, 2017 - Issue 2,December 2017. 10. Golub,A , “ Designing Single Sampling Inspection Plans When the
Sample Size is Fixed”, Journal of the America Statistical Association, 48, 278-288,April 2012.
11.Soundararajan, V. , “Sample Inspection Plans when Sample size is fixed”, Journal of Madras University, B Volume 44, pp.9-19,1981. 12.Wortham,W.A. & Baker,R.C., “ Multiple Deferred state sampling
inspection”, The International journal of production Research, Volume 14, pp. 719-731,1976.
13.Vaerst, R. , “ A procedure to construct multiple deferred state sampling plans”, Methods of Operations Research, Volume 37, pp. 477-485,1982.
14.Dodge, H.F. , “Chain sampling inspection plan”, Industrial Quality Control, 11, pp. 10-13,1955.
15.Sondararajan, V. & Govindaraju,C. , “ Procedure and tables for construction and selection of Multiple Deferred State [ MDS-1(c1,c2)] plans”, QR Journal, Volume 10, pp. 101-105,1983
16.Soundararajan, V. & Vijayaragavan, R , “Construction and Selection of Multiple Deferred (dependent) State Sampling Plan”, Journal of Applied Statistics, Volume 17, pp.397-409,1990.
17.Govindaraju, K. & Subramani,K., “ Selection Of Multiple Deferred state MDS-1 sampling plan for given Acceptable quality level and Limiting Quality Level involving Minimum risks” , Journal of Applied Statistics, Volume17, pp. 427-434,1990.
18.Subrmani.K and Haridoss.V,. “Selection of Repetitive Group Sampling (RGS) plan for given AQL and LQL with minimum sum of risks using Weighted Poisson distribution”. International conference proceedings onMathematical Modeling and Applied Soft Computing, Volume 2, pp. 187-194,2012.
19. Subrmani.K and Haridoss.V, “Selection of single sampling attributes plan for given AQL and LQL with minimum sum of risks using Weighted Poisson distribution”, Volume 30, Issue 1, pp. 47 – 58, June 2013.
20. Subrmani.K and Haridoss.V,
“Development of multiple
given AQL and LQL” Int. J. Quality Engineering and Technology, ISSN: 1800-6450,Volume 3, Issue 2, pp.168-180,2012.
21. Subrmani.K and Haridoss.V, “Selection of a
Tightened-Normal-Tightened system for given values of the Acceptable Quality Level and Limiting Quality Level using Weighted Poisson distribution” , Int. J. Decision Sciences, Risk and Management, Volume 4, pp. 300-313,2012.
AUTHORSPROFILE
Dr. K. Subramani pursued M.Sc, M.Phil & Ph.D from Bharathiar University in 1985, 1987 & 1993. He is currently working as a Assistant Professor in the Department of Statistics , Government Arts college , Coimbatore - 18 from 2007. He is a life member of IAPQR since 1997. He served as a Reviewer in the International Journal of Quality and Reliability Management. He has published more than 25 research papers in reputed international journals including Communication in Statistics (USA), Journal of Applied Statistics (UK) & IJQRM (UK). His main research work focuses on Statistical Quality
Mrs. S.Ambika pursued M.Sc, M.Phil & MBA from Bharathiar University in 2005, 2010, &2012. She is currently pursuing PartTime Ph.D in the Department of Statistics, Government Arts College, Coimbatore-18. She has 10 years of teaching experience and is currently working as Assistant Professor in the Department of Mathematics and Statistics, Sri Krishna Arts and Science College, Coimbatore- 08. She has published more than 8 papers in National and International journals and is available online.