International Journal of Innovative Technology and Exploring Engineering (IJITEE) ISSN: 2278-3075, Volume-8 Issue-11, September 2019
Abstract: This study presents, two load shedding scheme that are simulated on IEEE-14 bus systems are voltage dependent priority based approach and voltage and frequency based NVSI methods. The frequency-based method is designed to consider the rate of change of frequency to estimate the power loss and thereby trigger the load shedding when the frequency or rate of change of frequency exceeds the corresponding thresholds. A novel method voltage and frequency-based load shedding scheme is designed to estimate the real and reactive power losses using frequency. After estimating the power loss, the buses are indexed using the Novel Voltage Stability Index (NVSI) to select the load buses for load shedding. The loads to be shed at each of the buses are determined using the improved self adaptive harmony search(ISAHS) algorithm. Simulation results of voltage and frequency based NVSI method are presented in comparison with voltage dependent priority based approach.
Keywords : Optimal Load Shedding, Improved self adaptive Harmony Search Algorithm, Voltage collapse, Active and Reactive power. Voltage-frequency.
I. INTRODUCTION
Distributed generations (DGs) are contributors to the improvement in the quality of power supplied. With the integration of DGs, it results in only smaller losses in power and hence reduces the consumption of fossil fuels [1, 2]. However, these advantages come along with some disadvantages as well. The main issue in the integration of DGs is Islanding occurrence [3]. During islanding, there will be an imbalance in power generated and power in demand. When the difference is negative, that is when the power demand is higher than the power generated voltage, the frequency of the system drops significantly. System response will become slow and will not be able to recover so that generated power could be increased. Hence, only a possible scenario to stop the drop in voltage and frequency is to shed the load to some extent [4, 5, 6]. Initially, load shedding was limited only to transmission systems but of late; the load shedding is extended to distribution systems [7-9] as well. While frequency stability alone can be considered for load shedding in transmission systems, both frequency and
Revised Manuscript Received on September 03, 2019
* Correspondence Author
Raghu C N, Electrical & Electronics Engineering, Research Scholar, JAIN University , Assistant Professor , REVA University, Bengaluru, Karnataka, INDIA.
A Manjunatha, Electrical & Electronics Engineering, Sri Krishna Institute of Technology, Visvesvaraya technological university, Karnataka, INDIA.
G Raghavendra, Electrical & Electronics Engineering, Sapthagiri college of Engineering , Visvesvaraya technological university, Karnataka, INDIA.
voltage stability based schemes are needed for distribution systems. This is for the reason that, transmission systems are equipped with a large set of capacitor banks and high capacity generators. Reactive power is supplied back to the grid from the large set of capacitor banks and high capacity generators. Hence the voltage drop is controlled quickly in transmission systems. Whereas in the case of distribution systems, when a loss happens in the grid, the limit of reactive power is reached fast and hence voltage drop cannot be controlled or stopped. Therefore voltage drops rapidly in distribution systems. If the voltage drop is not recovered immediately, generator trips and there is a possibility of system collapse.
There are many research studies that focused on dealing with islanding scenarios [10-13]. In these different research studies, reliability of the islanded systems have been studied, control strategies have been developed and methods were proposed to separate bulk power system into subsystems.
The load shedding schemes can be designed based on two methods, namely, Under Frequency Load Shedding (UFLS) and Under Voltage Load shedding (UVLS). Under frequency load shedding scheme (UFLS) [1, 2, 14, 18] is one of the most popular frequency based load shedding schemes to handle the islanding occurrence. In the UFLS method, only frequency is considered for load shedding and the voltage is not given any importance. Hence there is a possibility that frequency is restored, while the voltage may not. This results in an adverse effect on the distribution system. Frequency gradient method was discussed in [2] and the analysis was presented in detail. Similarly, in [1, 14], optimal values of the load shedding was derived. In [16], the relation between the power drop and the frequency gradient was derived. Equivalent inertia constants were used in [17] to derive the multi-stage under frequency load shedding scheme.
One of the important steps in load shedding methodologies was to estimate the magnitude of disturbance with the Rate of Change of Frequency (ROCOF). The methods to derive ROCOF can be found in [15, 19]. But there is again a limitation in this method. It depends on the system frequency to calculate the amount of load shedding. System frequency needs to be calculated at every time step to estimate the actual power loss. Voltage stability (VS) is another important method to determine the load shedding process. This method involved the restoration of power by improving the VS margin [19]. In [20], multi-objectives were introduced that minimizes the sum of VS and total load. To achieve this, a Genetic Algorithm (GA) was
proposed by the researchers.
Voltage and Frequency Based Optimal Load
Shedding using Improved Self Adaptive
Harmony Search Algorithm
In [21], line VSI (Voltage Stability Index) was proposed as a method to load shed that avoids the maximum loading point. L-indicator method was modified in [22] and VSI was used as load margin in [23]. In all the above algorithms, either frequency is considered in load shedding or voltage is considered. While frequency is considered, the voltage may not be given importance and vice versa. In [24], both frequency and VS are considered in the load shedding scheme. However, this research work focused on transmission system only.
Most of the approaches discussed above either used VSI or frequency-based approach. This approach does not suit the DGs. In order to address loss generation in DGs, both voltage and frequency-based load shedding scheme is implemented by ranking the buses based on Novel Voltage Stability Index (NVSI). The approach adopted to rank the bus system based on NVSI and power drop based on frequency is described in Sec. II. In Sec. III, simulation results are presented. Finally, important conclusions are drawn in Sec. IV.
II. VOLTAGEANDFREQUENCY-BASEDLOAD
SHEDDINGUSING VOLTAGESTABILITYINDEX
When a generator is lost in the bus system, it leads to a drop in the system frequency. Practically, it is possible to measure the drop in frequency and ROCOF can be calculated based on reading the frequency of the system at every millisecond. Hence
or
or
(1)
where
: Rate of change of frequency at step i : System frequency at step i
: System frequency at step i-1 : System frequency at step i+1
Drop in power supplied can be estimated using swing equation
(2) where
: Drop in Real Power : Inertia of ith rotor : System normal frequency
The drop in real power can also be expressed as
(3) where
: Real Power at any instant : Real Power in normal condition
The real power at any instant can be expressed as
(4)
From the above equation, change in system voltage can be determined as
(5)
(6)
The drop in reactive power can be expressed as
(7)
Using Eqs. 6 and 7,
(8)
where
: Coefficient of the frequency of real power : Coefficient of the voltage of real power : Coefficient of the frequency of reactive power
: Coefficient of the voltage of reactive power
From Eqs. 5 and 8, the drop in real power and reactive power can be estimated. With this loss of power introduced into the system in the simulations, the buses can be ranked using NVSI. Procedure for calculating NVSI is given below:
When there is an appreciable change in real and reactive loads and neglecting the resistance in the transmission line,
(9) where
: Real power at the receiving side : Reactive power at the receiving side : Reactance of the line
: Voltage at sending side
The value of NVSI is less than 1.0 and all the buses are ranked in descending order. Higher the NVSI, weaker the bus. Buses with higher NVSI are the probable buses for load shedding.
A. Algorithm proposed:
1. Initialize the normal frequency of the system. 2. Set the threshold for frequency below which load
shedding is triggered.
3. Set the threshold for Rate of change of frequency (ROCOF) below which load shedding is triggered. 4. As the generator loss triggers, read frequency at
every time step and estimate . 5. Calculate the ROCOF at every time step.
6. Check if the frequency and ROCOF at any instance are below the thresholds. If either frequency or ROCOF is less than thresholds, calculate the drop in real power using
.
7. Set the values for coefficients , , and . Using the coefficients , , ; ,
and determine .
8. Estimate NVSI values for all the buses.
9. Rank the buses in descending order using NVSI values
International Journal of Innovative Technology and Exploring Engineering (IJITEE) ISSN: 2278-3075, Volume-8 Issue-11, September 2019
adaptive harmony search algorithm.
B. Improved Self Adaptive Harmony Search Algorithm(ISAHS):
In any harmony search algorithm, the objective is to minimize the aesthetic standard or objective function. That is
such that (10)
where N is the number of decision variables. Each decision variable has a range starting from to .
is the lower limit for the decision variable and is the upper limit. is the range of values that can take. has the values between and . The following parameters and definitions are important to understand the harmony search algorithm.
The vector is called as Harmony and set of is known as Harmony memory. The Harmony memory or HM is the matrix that holds the set of . The size of HM is Harmony memory size M. The size of HM matrix is then M x N. Therefore HM may be written as
(11)
The HM matrix is initialized with random values with
(12)
The RAND1[0, 1] is the random number generator, usually, a uniform distribution random generator is used. The value of
is used for each of the vectors in the HM. New Harmony is generated and the objective function value of this new harmony is evaluated. If the objective function value of the new harmony is better than the worst harmony in terms of objective function value, in HM, then the worst harmony in HM is replaced with the new harmony . This process is repeated for a certain number of iterations. The number of iterations can also be considered as one of the parameters of the HS algorithm. Now the challenge is to generate the new harmony . The following steps are followed to generate the new harmony .
There are two ways that can be generated. The first one is to select the from HM and then mutate it. The second method is to randomly select it from the generic set . The harmony considerate rate [HMCR] is the probability that
is selected from HM and [1-HMCR] is the probability that it is selected from the generic set . When the is selected with a probability of HMCR, it is mutated as below when is continuous.
(13)
where BW is the arbitrary bandwidth. The BW is chosen separately for each of the decision variables.
When Xi is discrete,
(14)
Based on HMCR, the decision about is to be generated form HM or is taken and, if it is chosen from HM, the PAR is used to decide if it to be mutated or not. Hence HMCR, PAR, and BW play an important role in determining the convergence rate of the solution. The improved adaptive harmony search algorithm (ISAHS) [17], in which the HMCR, PAR, and BW is calculated as
(15)
(16)
(17) Where
=Maximum harmony memory considerate rate
=Minimum harmony memory considerate rate
=Maximum pitch adjustment rate
= Minimum pitch adjustment rate
=Maximum bandwidth
= Minimum bandwidth = Number of iterations
The IAHS algorithm can be summarized as
1. Initialize the parameter of HS algorithm 2. Populate the HM with the random vectors
3. Determine the HMCR, PAR, and BW based on the parameters and the iteration count using equations 15, 16 and 17.
4. Generate new solutions using equations 12, 13 and 14.
5. Determine the objective function value as per the equation 9. If the objective function value is better than the worst vector present in HM, then replace the worst vector with the new vector. Else repeat step 4.
6. Verify if the termination condition of a maximum number of iterations is met and terminate the algorithm. Else, repeat steps 4 and 5.
In this research work, the network power flow equations are solved using MATPOWER and the load shedding is performed using the ISAHS.
III. SIMULATIONRESULTS
Simulations are performed in MATLAB and
MATPOWER, and results are discussed in this section. Two bus systems, namely, IEEE-14 Bus and 1EEE-30 Bus systems are simulated for load shedding. Two types of load shedding schemes are simulated. In the first case, the load shedding is based on the priority based voltage stability index and the other method is frequency based NVSI method. In both the load shedding schemes, the optimal loads are determined using an ISAHS
dropped below a certain threshold value in a frequency based method. Loss of real and reactive power is estimated by measuring the frequency and then calculating the ROCOF at every time instant. The power estimated using ROCOF is the minimum amount of load to be shed to regain the frequency back to normal frequency.
For the purpose of comparison, the power drop estimated using ROCOF is input to the voltage dependent priority based approach. Shedding of loads at each bus is determined using both voltage dependent priority based approach and Voltage and frequency based NVSI methods.
Various parameters used in ISAHS are:
HMS or M =100
=0.9;
=0.2 =0.4
=0.9
= 0.0001 =1.0
= 5000
In voltage dependent priority based approach, loads are shed more in those buses where the voltage drop is less. Hence higher penalties are imposed in buses in which the voltage drop is high. Buses are ranked based on the voltage drop in each bus.
A. Simulations Results for IEEE-14 Bus
The 14-Bus system has 2 Generators, 3 Transformers, 3 Synchronous Condensers 20 Lines and 1 Static Capacitor. Various parameters used or derived in frequency and priority-based method are in simulations are:
Frequency Threshold = 49.9 Hz
ROCOF threshold = 45 Hz/sec
Frequency when load shedding triggered =49.954 Hz
ROCOF when load shed triggered = 46 Hz/sec
Real power loss at ROCOF of 46 Hz/sec =73.6 MW
Reactive power loss at ROCOF of 46 Hz/sec = 20.886 MVAR
Table 1: Active and Reactive Supply for IEEE 14-Bus System under Normal Operating Condition Buss
No
Voltag e Mag (pu)
Real Power
Gen (MW)
Reactive Power
Gen (MVAR)
Load P (MW)
Load Q (MVAR)
1 1.06 198.8 -9.29 - - 2 1.045 72 31.2 21.7 12.7 3 1.01 0 25.02 94.2 19 4 1.018 - - 47.8 -3.9
5 1.02 - - 7.6 1.6
6 1.07 0 12.71 11.2 7.5
7 1.062 - - - -
8 1.09 0 17.6 - -
9 1.056 - - 29.5 16.6
10 1.051 - - 9 5.8
11 1.057 - - 3.5 1.8 12 1.055 - - 6.1 1.6 13 1.05 - - 13.5 5.8 14 1.036 - - 14.9 5
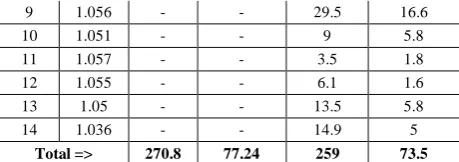
Total => 270.8 77.24 259 73.5 Table 1 shows the real power and reactive powers generated in IEEE-14 Bus system. Also, the real loads and reactive loads in the bus system are shown in Table 1. There is a real power generation of 270.8 MW and a real load demand of 259 MW. Similarly, the reactive power generated is 77.24 MVAR and the reactive load demand is 73.5 MVAR. There are 5 generators in the system. Generators are connected to buses 1, 2, 3, 6 and 8.
[image:4.595.312.542.50.131.2]When there is a loss of generated power, frequency starts falling. Time for a drop to reach threshold frequency depends on the rate of change of frequency. The threshold frequency is the frequency below which the load shedding is triggered. Hence if the ROCOF is high, the threshold frequency is reached very fast and hence load shedding is triggered when either the threshold frequency or threshold ROCOF is reached. In the present simulations, a threshold frequency and threshold ROCOF are set as 49.9Hz and 45 Hz/sec respectively.
Table 2: Active and Reactive Supply for IEEE 14-Bus System under Abnormal Operating Condition (loss of generation) after load shedding with Priority-VSI based
method Bus
s No
Voltage Mag(pu)
Real Power
Gen (MW)
Reactive Power
Gen (MVAR)
Load P (MW)
Load Q (MVAR) 1 1.06 144.86 -12.5 - - 2 1.045 52.52 32.56 15.49 7.27 3 1.01 0 18.74 69.36 11.86 4 1.024 - - 34.33 -2.96 5 1.026 - - 5.73 1.22 6 1.07 0 9.48 8.28 5.06
7 1.068 - - - -
8 1.09 0 13.14 - -
9 1.065 - - 23.28 14.84 10 1.06 - - 7.39 3.78 11 1.062 - - 2.55 1.5 12 1.06 - - 4.45 1.43 13 1.057 - - 9.47 3.5 14 1.049 - - 10.73 3.61
Total => 197.38 61.42 191.06 51.11
Table 3: Active and Reactive Supply for IEEE 14-Bus System under Abnormal Operating Condition (loss of generation) after load shedding with Frequency-NVSI
method
Buss No
Voltage Mag(pu)
Real Power
Gen (MW)
Reactiv e Power
Gen (MVAR
)
Load P (MW)
Load Q (MVAR
)
1 1.06 152.14 -12.5 - - 2 1.045 52.52 32.56 15.89 9.07 3 1.01 0 18.74 67.41 16.88 4 1.023 - - 40.89 -2.29 5 1.024 - - 7.1 1.25 6 1.07 0 9.48 8.54 7.04
[image:4.595.313.541.408.593.2]International Journal of Innovative Technology and Exploring Engineering (IJITEE) ISSN: 2278-3075, Volume-8 Issue-11, September 2019
8 1.09 0 13.14 - -
9 1.063 - - 22.27 16.6 10 1.059 - - 6.9 4.16 11 1.062 - - 2.7 1.41 12 1.06 - - 4.72 1.07 13 1.057 - - 10.64 3.17 14 1.048 - - 10.82 3.2
Total => 204.66 61.42 197.88 61.56
[image:5.595.56.284.50.137.2]ROCOF threshold is reached first though the frequency of the system is still at 49.954Hz. The loss power is estimated quickly using ROCOF and load shedding is triggered. Loss of real and reactive powers estimated to be at 73.6 MW and 20.886 MVAR respectively at the ROCOF of 46 Hz/sec. Table 2 shows the load shedding by the priority based voltage stability index method. The final real and reactive loads are determined as 191.06 MW and 51.11 MVAR respectively.
[image:5.595.315.555.60.252.2]Similarly, when the both voltage and frequency-based load shedding scheme used, final real and reactive loads are determined as 197.88 MW and 61.56 MVAR respectively. The individual loads at each bus in the IEEE-14 Bus system is shown in Table 3. It can be observed from both Tables 2 and 3 that voltage and frequency-based load shedding method has yielded better results than voltage dependent priority based approach. The total real load is 197.88 MW in voltage and frequency-based load shedding and 191.06 MW in voltage dependent priority based approach , which is 6.82 MW higher in frequency based method. Similarly, the reactive power is also higher by 10.45 MVAR in the proposed method.
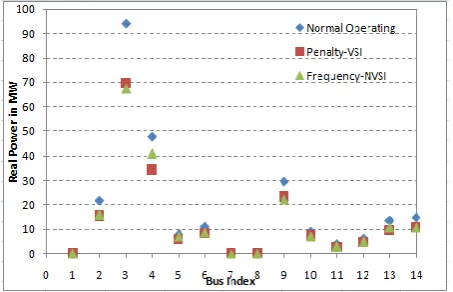
Figure 1: Real loads at 14 buses in IEEE-14 Bus System in normal conditions, priority and proposed approaches
Figure 2: Reactive loads at 14 buses in IEEE-14 Bus System in normal conditions, priority, and frequency
based approaches
Figure 3: Frequency recovery after load shedding is triggered
Figs. 1 and 2 shows the real and reactive power demand in normal conditions, after load shedding using voltage dependent priority based approach and proposed approach respectively. It can be observed from the Figs. 1 and 2 that loads in frequency based approach are either close to or better than the voltage dependent priority based approach.
Fig. 3 shows the recovery of frequency after the load shedding is triggered. A frequency of 49.996 Hz is reached in 30 ms. The frequency recovery is slow up to 5 ms. The recovery rate increases from 5 to 15 ms and thereafter, the frequency reaches a stable state at 30ms. Finally, a frequency of 50Hz is reached at a time beyond 30ms.
IV. CONCLUSIONS
In this work, voltage dependent priority based approach method is considered as the baseline method and a new method based on voltage and frequency. The f voltage and frequency-based NVSI approach is demonstrated to be superior to voltage dependent priority based method. The frequency at every instant after the power loss is recorded and the corresponding rate of change of frequency is estimated at every time instant. Based on the rate of change of frequency, real and reactive power loss is estimated and load shedding is triggered when the frequency or rate of change of frequency is below the corresponding thresholds. When the proposed method is tested on IEEE-14 bus system, the total new real load required to recover the frequency back to normal frequency is 197.88 MW in frequency based method and 191.06 MW in voltage dependent priority based method. From this, it can be concluded that proposed method uaing NVSI methods require less load shedding of real load by 6.82 MW than a voltage dependent priority based method. The voltage and frequency-based approach needs less load shedding of reactive load by 10.45 MVAR than voltage dependent priority based method. Hence based on the simulations performed for IEEE-14 bus systems, voltage dependent priority based method using NVSI approach is better than the voltage
[image:5.595.62.289.417.563.2] [image:5.595.59.289.610.752.2]REFERENCES
1. Mahat P, Chen Z, Bak-Jensen B. “Underfrequency load shedding for an islanded distribution system with distributed generators”. IEEE T Power Deliver 2010; 25: 911-918.
2. Rudez U, Mihalic R. “Analysis of under-frequency load shedding using a frequency gradient”. IEEE T Power Deliver 2011; 26: 565-575. 3. IEEE. “Recommended Practice for Utility Interface of Photovoltaic (PV) Systems”. IEEE Standard 929-2000. New York, NY, USA: IEEE, 2000.
4. Hagh MT, Galvani S. “Minimization of load shedding by sequential use of linear programming and particle swarm optimization”. Turk J Elec Eng Co 2011; 19: 551-563.
5. Majidi M, Aghamohammadi MR, Manbachi M. “New design of intelligent load shedding algorithm based on critical line overloads to reduce network cascading failure risks”. Turk J Elec Eng Co 2014; 22: 1395-1409.
6. Raghu C N, A Manjunatha, “Assessing Effectiveness of Research for Load Shedding in Power System” International Journal of Electrical and Computer Engineering (IJECE), ,Vol. 7, No. 6, pp. 2017; 3235-3245.
7. Karimi M, Mohamad H, Mokhlis H, Bakar A. “Under-frequency load shedding scheme for islanded distribution network connected with mini-hydro”. International Journal of Electrical Power & Energy Systems 2012; 42:127–138.
8. Mahat P, Chen Z, Bak-Jensen B. “Underfrequency load shedding for an islanded distribution system with distributed generators”. IEEE Transactions on Power Delivery 2010; 25:911–918.
9. Rudez U, Mihalic R. “Analysis of under-frequency load shedding using a frequency gradient”. IEEE Transactions on Power Delivery 2011; 26:565–575.
10. Atwa YM, El-Saadany EF. “Reliability evaluation for distribution system with renewable distributed generation during islanded mode of operation”. IEEE T Power Syst 2009; 24: 572-581.
11. Balaguer IJ, Lei Q, Yang S, Supatti U, Peng FZ. “Control for grid-connected and intentional islanding operations of distributed power generation”. IEEE T Ind Electron 2011; 58: 147-157. 12. Jabari F, Seyedi H, Ravadanegh SN. “Large-scale power system
controlled islanding based on backward elimination method and primary maximum expansion areas considering static voltage stability”. Int J Elec Power 2015; 67: 368-380.
13. Karimi H, Nikkhajoei H, Iravani R. “Control of an electronically-coupled distributed resource unit subsequent to an islanding event”. IEEE T Power Deliver 2008; 23: 493-501. 14. Laghari JA, Mokhlis H, Karimi M, Abu Bakar AH, Mohamad H. “A
new under-frequency load shedding technique based on combination of xed and random priority of loads for smart grid applications”. IEEE T Power Syst 2015; 30: 2507-2515.
15. Mokari-Bolhasan A, Seyedi H, Mohammadi-ivatloo B, Abapour S, Ghasemzadeh S. “Modied centralized ROCOF based load shedding scheme in an islanded distribution network”. Int J Elec Power 2014; 62: 806-815.
16. Ketabi A, Fini MH. “An underfrequency load shedding scheme for islanded microgrids”. Int J Elec Power 2014; 62: 599-607.
17. Raghu C N, Manjunatha A, G Raghavendra. “A Penalty based Self Adaptive Harmony Search Algorithm for Optimal Load Shedding”. International Journal of Engineering and Advanced Technology (IJEAT)2019; 8: 2249-895
18. Karimi M, Mohamad H, Mokhlis H, Bakar AHA. “Under-frequency load shedding scheme for islanded distribution network connected with mini hydro”. Int J Elec Power 2012; 42: 127-138.
19. Fu X, Wang X. “Determination of load shedding to provide voltage stability”. Int J Elec Power 2011; 33: 515-521.
20. Kanimozhi R, Selvi K, Balaji K. “Multi-objective approach for load shedding based on voltage stability index Consideration”. Alexandria Engineering Journal 2014; 53: 817-825.
21. Mageshvaran R, Jayabarathi T. “Optimal load shedding based on line voltage stability index using harmony search algorithm”. J Eng Technol 2015; 10: 533-551.
22. Raj P, Sudhakaran M. “Optimum load shedding in power system strategies with voltage stability indicators”. Engineering 2010; 2: 12. 23. Kaffashan I, Mortezaee SMTM, Amraee T. “A robust undervoltage
load shedding scheme against voltage instability”. Turk J Elec Eng Co 2016; 24: 3309-3320.
24. Tang J, Liu J, Ponci F, Monti A. “Adaptive load shedding based on combined frequency and voltage stabilityassessment using synchrophasor measurements”. IEEE T Power Syst 2013; 28: 2035-2047.
AUTHORSPROFILE
Raghu C N did his BE from Adhichunchanagiri Institute of Technology in 2006 and MTech degree in Digital Electronics form Sri Siddhartha Institute of Technology Tumkur in 2011. He is currently an as Assistant Professor in School of Electrical & Electronics Engineering department in REVA University Bangalore. And pursuing his PhD in Jain University. His research interests are Power systems security, Power system stability, Power quality etc. Email: [email protected], Mob: 9844628735
A Manjunatha did his BE from Mysore University, ME in Power Systems from Bangalore University, andPhD from Dr.M.G.R University Chennai. He is currently working as principal at Sri Krishna institute of technology, Bangalore; Karnataka.He is currently guiding PhD and MSc engineering students in the area of power system operation and control, power system reliability evolution, power system deregulation and power quality. He is the life member of Indian Society for Technical Education also member of Institute of Engineers (India).