Rochester Institute of Technology
RIT Scholar Works
Theses
Thesis/Dissertation Collections
Winter 2007
Information visualization for business applications
Ramesh Gopalakrishnan
Follow this and additional works at:
http://scholarworks.rit.edu/theses
This Thesis is brought to you for free and open access by the Thesis/Dissertation Collections at RIT Scholar Works. It has been accepted for inclusion
in Theses by an authorized administrator of RIT Scholar Works. For more information, please contact
Recommended Citation
Rochester Institute of Technology
B. Thomas Golisano College
of
Computing and Information Sciences
Master of Science in Information Technology
Thesis Approval Form
Student Name
:
Ramesh Gopalakrishnan
Thesis Title:
Information Visualization for Business Applications
Thesis Committee
Name
Signature
Date
Prof. Elouise Oyzon, M.S. (RIT, NY)
Elouise R.
Oyzon
V/os
Chair
Jonathan Schull
Dr. Jonathan Schull, Ph.D. (RIT, NY)
Committee Member
Dr. Tao Lin, Ph.D. (SAP Research, CAl
Committee Member
T
LO
Information
Visualization for
Business
Applications
By
Ramesh Gopalakrishnan
Thesis
submitted
in
partial
fulfillment
of
the
requirements
for the
degree
of
Master
of
Science in Information
Technology
Rochester
Institute
of
Technology
B. Thomas
Golisano College
of
Computing
and
Information
Sciences
Thesis Reproduction Permission Form
Rochester Institute of Technology
B. Thomas Golisano College
of
Computing and Information Sciences
Master of Science in Information Technology
Information Visualization for
Business Applications
I, Ramesh Gopalakrishnan, hereby grant permission to the Wallace Library of the
Rochester Institute of Technology to reproduce my thesis in whole or in part
.
Any reproduction must not be for commercial use or profit.
TABLE OF CONTENTS
1.
Abstract
6
2.
Hypotheses
7
3.
Introduction
8
4.
Introduction to
Supply
Chain
Management
9
5.
Supply
Chain Process
10
6.
Complexity
of
Supply
Chain Data
11
6.1. Distribution Network Configuration
11
6.2. Information Flow
11
6.3.
Inventory
Management
11
6.4.
Manufacturing
Flow Management
11
6.5. Sales Order Fulfillment Process
11
7. Use Cases
for
an
SCM Application
12
8. Case
Study
on
Manufacturers
Supply
Chain Application
13
9. Research
Study
1: Microsoft Dynamics SCM
14
10. Research
Study
2: SAP SCM
21
11.
Research Implementation
23
11.1.
Introduction
23
11.1.1.
Technical
Problems Addressed
23
11.1.2. Innovations for this Implementation
25
11.1.3.
Related
Work
25
11.2. Scenario:
Real Time
Manufactory
Monitoring
27
11.2.1.
Global
Supply
Chain
Mapping
Layer
27
11.2.2.
Manufacturer
Shop
Floor
35
11.2.3.
Assembly
Line
40
11.3. Architecture: Web-based Information System for Manufacturer
44
11.4.1.
Introduction
44
11.4.2. Technologies
45
11.4.3.
Dynamic
Visualization
Framework
49
11.4.4.
MVC Design
Pattern
50
12.
Discussions
51
13.
Future
Roadmap
54
14. Conclusion
55
15. Selected
Code from MVC
56
16. Supplemental Storage Media
60
1. Abstract:
Business
applications are
generating
ever-increasing
amounts
of
data,
and
more
and
more
of
this
data
are
in
real-time
data. Data mining is
a
standard
feature
in
most
data
management system
for retrieving
complex
information
but
the
challenge
is
about
how to
represent
these information in
an
effective
way for better
analysis and
decision
making.
With this
rich
information,
the
challenge still
remains
to
derive
the
most
business
value
from
ever-increasing
amount
of
available
information.
Information
visualization
can
significantly
solve
this
problem
for
handling
such
complex
and
high
volumes
of
data to
be
represented
in
business
applications.
Through this research,
an
attempt
will
be
made
to
solve
this
problem
by
prototyping
an
interactive data driven
business
application
through
visualization.
The
key
focus
of
this
research work will
be
given
in the
"Presentation
Tier"of a
business
2. Hypotheses:
2.1.
Alternative Hypothesis (Hi):
Developing
a
Business Application
based
on
Information
Visualization has
an
effect
on
understanding
the
complex
information
3.
Introduction:
The
world
is
about
business.
Business
application
is
a
vast
domain in
Information
Technology
from
a
simple
online
flight
reservation
system
to
a
complicated
global
supply-chain
management
application.
But
the
problem
that
remains
in
common
for
all
the
applications
is to
better
understand
the
information
and
get
a
clear
visibility
on
how
things
are
related
with
each
other.
This
research
aims at
solving
a complicated problem and
will
investigate
on
how effectively
we can
build
these
applications
with
visualization as a
primary tool. With
these
objectives
in
consideration,
this
case
study
will
be
a
prototype
development
of
a
supply-chain
application
which
is the
most complex application
for the business
people
that deals
with
enormous amount of
information
exchange.
A
thorough
research
will
be
made
on
an
existing
supply-chain
application
used
in
the
current
business
world
and
investigate
on
how
we
can
enhance
this
application
through
visualization
for better
visibility.
Problems
involved
in
understanding
a
flat
text
based
application
for
business
analysis
will
also
be
researched.
A
web-based
information
system
will
be
4. Introduction to
Supply
Chain Management (SCM):
A supply chain,
logistics
network,
or
supply
network
management
is
a
coordinated
system
of
organizations,
people,
activities,
information
and
resources
involved in moving
a
product or
providing
service
in
physical
or
virtual
manner
from
supplier
to
customer.
Supply
chain
activities
transform
raw
materials
and
components
into
a
finished
product
that
is
delivered to the
end
customer.
"Supply
chain
management
(SCM)
is the
oversight
of
materials,
information,
and
finances
as
they
move
in
a process
from
supplier
to
manufacturer
to
wholesaler
to
retailer
to
consumer.
Supply
chain
management
involves
coordinating
and
integrating
these
flows
both
within
and
among
companies.
It
is
said
that the
ultimate
goal of
any
effective
supply
chain management
system
is to
reduce
inventory.
"5.
Supply
Chain Process:
A typical
product
flow involved
in
a
supply
chain
process
is illustrated
below:
Suppliers
Y
Manufacturers
Distribution Centers
Retailers
Consumers
For
example,
if
a
consumer
wants
to
purchase
a
refrigerator,
the
entire
process
begins
with
a
supplier.
A
supplier
is
the
one
who
manufactures
the
parts
or
raw
materials
like
cabinets,
cooling
parts,
condenser
etc.
Once
all
the
required parts are
obtained, the
process moves
to the
manufacturer.
A
manufacturer
is the
one
who
assembles
all
the individual
parts
together
in
his
assembly line
to
come
up
with
a
unique
product,
which
in this
example
is
a
refrigerator.
After the
product
is successfully
assembled
in the
manufacturer's
assembly
line,
the
product
is
moved
to
a
distribution
center
or
a
warehouse.
The
product
is
stored
in
the
distribution
center
for
a
few
days
or
months
depending
on
the
retailer's requirement.
Once the
retailer requests
for
a
particular
refrigerator
model, the item is
shipped
to
the
requested
Retailer.
Eventually
the
consumer obtains
his
requested model.
This is
how
a
product
flows from
a
supplier
to
a
customer
in the supply
chain
process
for
6.
Complexity
of
Supply
Chain Data:
During
the
above
mentioned
product
flow,
enormous
amounts
of
information
or
data
are
generated
in
each
individual
process.
For example, the
following
could
be
a small
list
of process
that
might
occur when
a
product moves
to
a
Manufacturer:
New
sales
order
generated,
check
item
availability,
check
parts
availability,
request
supplier,
product
assembled,
pick,
pack,
and
ship
to
the
distribution
center.
Each
of
these
processes will
further
generate
data based
on
the
date,
time
and
description
of
the
process.
These
massive
amounts of
supply
chain
data
are
very
crucial
for the
business
people
to
better
understand
them
and
make
decisions.
They
should
be
organized
and
made
visible
to
overcome
the
following
fundamental
problems
of
developing
a
supply
chain
management
application:
6.1.
Distribution
Network
Configuration:
Number
and
locations
of
suppliers,
production
facilities,
distribution centers,
warehouses and customers.
6.2. Information Flow: Integrate
systems and
processes
through the
supply
chain
to
share
valuable
information,
including
demand
signals,
forecasts,
simulating
manufacturer's
shop floor
and
logistics
etc.
6.3.
Inventory
Management:
Quantity
and
location
of
inventory
from the
global
suppliers
including
raw
materials,
work-in
process
and
finished
goods.
6.4.
Manufacturing
Flow
Management:
A
process
that
includes
all
activities
necessary
to
move
products
through
the
plants
and
to
obtain,
implement
and
manage
manufacturing
flexibility
in
the
supply
chain.
6.5. Sales Order
Fulfillment Process:
All
activities
necessary to
define
customer
7. Use Cases for
an
SCM
Application:
The
following
set of major use case criteria
will
be
considered
for
this
research
study.
These
criteria
will
be
applied
on
the
Microsoft SCM
and
SAP SCM
application
by
conducting
a
case
study
to
analyze
the
problems
in executing
these
cases successfully.
7.1.
Synchronous
Behavior:
Synchronous
behavior
use
case
talks
about
the
technology
used
in the
client
side
for
a
faster
response
time
so
that the
user
can
execute
his/her
tasks
faster.
7.2.
Information
Drill
Down:
Information drill down
can
be
referred
as
getting
detailed
information
on
an
interested item
and
further
drilling
it down to
get
more
details
on
the
selected
item
for
better
visibility
and
decision
making.
7.3. Real-time Simulation: Real-time
simulation
in this
use case
refers
to the
real
time
activities
that
occur
in
a
manufacturer's
shop floor
and
how
managers are
able
to
understand
those
activities.
7.4.
Logistics
Management:
Logistics
management
deals
with
all
the
activities
involved in understanding logistics
related
tasks
for
transporting/receiving
the
goods
to
a
supplier,
retailer
or a
manufacturer.
7.5.
Inventory
Management:
Inventory
management
deals
with
the visibility
of
the
list
of
items
available
in
stock with
each
supplier and
also within
the
company's
warehouse.
7.6.
Supply
Chain
Relation:
Supply
chain
relation
specifically deals
with
the
data
associated
with
the
relation
between
a
supplier,
a
manufacturer,
and
a
retailer
in
a
product
flow.
7.7.
Accessibility:
Accessibility
talks
about
the
Section
508 issues
and
how those
8. Case
Study
on
Manufacturers
Supply
Chain
Application:
This thesis
will
focus
on
a
case
study
of
an
existing
supply
chain
application
used
by
a
manufacturer.
As
mentioned
earlier,
a
manufacturer
is
one of
several
other
components
involved
in the supply
chain
process.
A
manufacturer's
application
is
chosen
for the
case
study because it
acts as
a
middleware
between
a
supplier
and a
retailer.
That
being
said,
enormous amounts
of
information
exchange
could
take
place
in this
area.
Through this study,
problems
involved
in
using
an
existing
supply
chain
application
will
be discussed
in
detail.
A
research
will
be
conducted
to
overcome
these
issues
through
visualization
and
the
results
will
be
9. Research
Study
1: Microsoft Dynamics SCM
Microsoft
Dynamics
SCM
(Supply
Chain
Management)
application
is
one popular
business
software used
among
many
of
Microsoft's business
customers.
It
offers
global
manufacturers
a
business
management
solution
that
provides
integrated, transactional,
real-time
information in
an
open
standards
format
that
can
be
easily
shared across
the
entire
supply
chain.
This
is
a
desktop
application
which
provides access
to
detailed
inventory
information
from
a
central
location,
has easy
to
use
stock
analysis
tools
and
flexible
reporting
capabilities
to
enable
the
creation
of
personalized
reporting
to
meet
customer
demands.
This
application
helps
manufacturers
quickly
turn
data
into
decision-driving
information
for
responding
rapidly to
change and
fuel
customer satisfaction.
The
case
study for this thesis
will
emphasize
on
the
technology
and
the
user
experience
of
this
supply
chain
application.
Figure
shown
below
is
a
screenshot
of
Microsoft Dynamics SCM
application.
Its
user
interface
has
a
similar
look
and
feel
of
Outlook Express
mail client
which
is
quite
familiar to Microsoft's
huge
customer
base.
Da
x
ioffice
Contoso
Supply
Chain Portal
Reports OpenWork RYG Export Site* Fabrikam,inc. Northwind Traders Lrtware,Inc.
Hind Issue
by
KefFindIssue;
|
ApplyFilterTherewere noitemsfound!
List Item Report
Web Name:Fabrikam,Inc.(4) 8Assigned To:(notassigned);i) ;+Asfeityumi ft*:M(it*fi Gisfxbs''.:'-.
-*AssiymsdTo:frankMiller(5) '&.AssignedTo:W<srn*h Gupta
&..}
Web Name:NorthwindTraders
(3)
ft;Assigned 'So:Syfvieftarp\~s)|
Export to ExcelModify MyDagev
Issue Resolution Help:
Thissite is usedtomanage andresolve allCustomer Issues.
PleasecontactUnda Martinx5978for anyassistancerequired increatingor managingnew projectsonthissite,
U
Ke
WB9
-Members
Online
X
Susan Burt:X
Mark Bensonj,Steve Lasker
4,
John Emory&
RandyReeves Not Online [image:14.536.64.478.447.682.2]9.1. Problem Statement:
The
following
are some of
the
major problems
that
were
identified
in
using this
application:
9.1.1.
Desktop
Application:
One
of
the
first
prominent
features
that
will
be
noticed
in
Microsoft
Dynamics SCM is the
platform
in
which
it
operates
the
system.
It is
a
traditional
desktop
application which runs on a client's
computer
locally. It is
connected
to
a
centralized
Windows
Server
platform
for
information
exchange
based
on
the
client's
request.
It
uses
HTTP
protocol
to
communicate
between
the
server and
the
client.
A
major
drawback
for
developing
a
SCM
application
over
the
desktop
could
be
the
maintainability
related
issues.
For
an
example,
if the
company
decides
to
make some changes
in
certain
UI
features
of
the
client
application, it
requires
installing
an
update over
the
internet
or
locally. This installation
needs
to
be done in the
entire client's system which
runs
this
application.
This
could
be
a
huge
problem
in
terms
of
maintainability if the
company has
massive
number of
clients.
9.1.2.
Synchronous
Behavior:
Synchronous
behavior
is
a
client
server
interactivity
model
as
illustrated in the figure below. In this model, the
client gets a
response
from
the
server side
only
when
the
user makes a
request.
Therefore,
when
a
new
message
arrives
in the
server
side, it
will
not
be
immediately
notified
to
the
client unless
ui*r,wl>vity ,,,...,,x(tvt!y
USHraeJMtV
^
w^
if
,
1
S
S
5
3 T5
I
I
>'\
^
Microsoft
Dynamics
SCM
follows
this type
of
synchronous
behavior
which
makes
the
client
unaware
of
a
new
alert
received
in
the
server
side.
However,
it
checks
for
alerts after
every
one minute
or user
defined time interval
as
it
does
in
Outlook
Express
client.
This
would
still
miss
the
instant
notification
of
an
alert
to
the
client.
For
example,
if
an
item
shortage
is
discovered in the warehouse, it
should
be
immediately
alerted
in
the
application
for
taking
the
required
action.
This
could
be
a
very
crucial
step in
the
inventory
management
of
supply
chain process.
9.1.3.
Information Drill-down:
As
shown
in the figure
below,
huge
chunks
of
information
related
to
E*C W* >Vw IC"ft TtanvxUyw fary *y<h Ei,l/ fjr*ym Ki4>
-1 ^J^Ji<J
mlJi
:~***UK
IfK
^
1 Sr.
y '' '& * ** ,^vrtm,1-t GiftZpaW "
3-,;-r-iSl
iB &
f
/ OK
J
-J <0
>Vj]Cus*.c*-*5<kj rOffrCSStffiCfffiW,Mrrt
2]
tt^-OcKvtoPlyifirtgld^w,May
2007
mail.r/
I
Smwljv KtMHby Tiwsd.iy W.nliH'Bi-J.iy TlyiBMJ.W rthiw S]_ 2 1 4 3
3
tottfvno*Tinw6n&&y O05&29S) (SMfcaB) CKSV&K) [*&,#*) (,28S31 j U
21UrKtjl'U.tr^MJixjjiy 2]S^*5<c-^rtS>u<'il.>C>H
(f*.?35)___i5^^i&&$*>$) [VK3.J&5) rtse^es ft?S3.7&JI ftf.7,14Cl
IS
U
3.5 if i? t3&*Cxfl
CJ6fc?.11G| (8687,140) CS66J.140) 007.140) <i667.1409 Htt.i40) 0687,140)
. K 71 KS<
U
23
& 2S r22.*]
JjJ
CMUttfem^wjuww.'ma. ,..-~,.,...
RtoFiwtpi.r.
MiBI^
SaltsLists ; (K<
Di^^
n ? >\S3
ii
-Custom,., OOMntntttuttitrtr
^22iM
atoe'tfijfPNKpeitt T,., 0K.G Due DV.e rtPtm*..
|
ftARCWITOW! 5k50O3WXI.KB *5VlZRM7
JS,07OlS->ir*>X*> - is'
ftAna^iTooo: v^wawwi.KW ss wiimi silJraKf (f^fTOJW iJytPO* S**i t?ari*.>;Ui"rf SiW - IStOiV^-Oi MAONF ircoot STD1WK37 &S 4/17/300? 5>i:!?rss! jit:.10 (171.10
[
Bl*4k-WMfcAWiOf^ircoot srpiK223 S.S 4/12/3007 5fl#W 1128-iO (1?3.30
fextivsfci-jTryrt-sa-s>* :
fcfiRCWPrteOO! 6CDUW2252 SiS 4/12/2037 s-i'i:-/a:c; }/iJft&M $S,7(B.69 5*VlOi-ietlrw.-vJK.tf 5^r>'*'"
a(fi A&tMft#t&fit sidismsks as 4/12/asa? ^i^a? &6& J.K. MJflJWaBCOOl 5fDINV5H29 as tfiyaaj ^::.?ac7 tZJ&TSS i2.U.?,S-j ;^-.wcf>] ri.Y'ii^Ui^* - *
74hMfj ASWftKOMI STBWW250 as */iijit7 5^3^007 (3WS J-3I,
f' *PtY&vi :fcSSCCKHOQQJ SrW*220 5i5 #l2f9M7rf)#00(7 W?6^D tM6,
.&}F'tomkwI PAKtD5fWX3i srwv22* as Vtzflw?5ii2iQCC7 f&67Ql 55/^TO.Kl ;;".".
|
BWEflSCWOTS 5TMM3351 &.S 4^18/2007 s::?;k>7 I4^W *?.5'>|j4Sal** rakctscwxoi 5tm2s* sis visy^wySj'SJ^WJ *3,7i.30 P,7.
CCMMWJIOOOCa SrDiU.'^*4 a.s vuv^o;5JKJ^JC7 t3*.-t (3!.94 y*jPuichaiirKj COf*UTffi-.0O0[CCKtOSOMtfOi STD1W2249IWSPIOOi SLSas */l2/_,Ga/*!lliXX>7Sfl7-)2oC7';:2,I20Q7 J7J.W7 6S(izs^as f68(47.W(12S.3S
*$
(vrt*yCOUflKWOOl lwstioft- StS *fIZ#G07 W32.1200? Ji9i (, wwft&Hceooot sroiavaii as */iya7 'J,'.2!'4X:> tftt.W JS1S.K) UOSUftETOOtjl 5TMMW2W SiS /l2/2O07 %>,Wxj& i;j.7o 11,139-70 ,;^Monufaetucing W;TR0PCi.QM1 5r&IHVSW5 A5 VI2/2M7li-iZtftP (7,051,25 f6,55J.K OPFIOOSIWl STD1HH237 5:5 4/l7j'JM7 ytfKfM $74,S50, *W,910.65
^
MR Pa^<M < >,
.iiir
i
roo<wct(K) FotJW^.10IW,1*"1 Ta;iilATjt>jrif-*na3-ir<tJl$7.fl:jw
|
Information
drill down
could
be
one
common
activity
by
the business
people
for
getting
detailed
information
on
an
area
they
are
interested
in.
Representing
such
information in the form
of
tables
and
flat text
makes
it
difficult
to
understand
the relationship between
the
data.
9.1.4.
Real-time Simulation:
In this
application,
there is
no real
time
simulation
involved to
simulate
the
actual
shop floor
of
a
manufacturer.
However,
it
does
provide
data in the
form
of alerts
when
an
exception
occurs
in the shop floor. This may
not
be
the
efficient
way to
develop
an
application
for
a
manufacturer.
The
operator
who
is
controlling the assembly line
would
be
totally
unaware
of
the
process
and
the
exceptions
that
might
occur
while
assembling
a
product.
Without
providing
the
real-time simulation of
a
manufacturer's
assembly
line,
a
supply
chain application
9.1.5.
Web Services:
In this
application,
web services acts as a
key
communicating
platform
between
the
client
and
the
server.
Information
is
in
multiple
layers
and
connected
cross
layers.
Data
related
to the supply
chain
process
is
stored
in
multiple servers
in
multiple
locations
and
they
are accessed
by
the
clients all
over
the
company
network
in the form
of web
service.
However,
it doesn't
utilize
the
full
potential
of
a
web
service.
It
doesn't
use
any
kind
of
web
mash-up for
accessing
a
third party
service.
When
dealing
with
a
global
supply
chain
process,
using
a
third party mapping
tool
as a
web
service
could
be
a
very
efficient
way to
map the information
on
top
of
their
application.
9.1.6.
Logistics Management:
Logistics Management is
part of
the supply
chain
process
which
plans,
implements
and
controls
the
efficient,
effective
forward
and
reverse
flow
and
storage
of
goods,
services
and
related
information
between
the
point
of origin
and
the
point
of
consumption
in
order
to
meet
customer's
requirement.
It
involves the integration
of
information,
transportation,
inventory,
warehousing,
material
handling,
and
packaging.
A
logistic
manager
who
would
use
this
application
will
take
the
responsibility
of
geographical
repositioning
of
raw
materials,
work
in process,
and
finished inventories
where required at
the
lowest
possible.
In
order
to
accomplish
these
goals, the supply
chain application should
provide
all
possible
information
related
to
the
geographical
location
of
its
suppliers
and
determining
the
shortest
path
for
transporting
the
raw
materials,
products
to
or
from
a
manufacturer.
For
example,
let
us
assume
a
retailer
requesting
for
a
particular
refrigerator
model
to
a
manufacturer
and
the
manufacturer
does
not
have the
requested
model
in
stock.
So,
the
manufacturer
materials.
Hence,
the
logistic
manager's
task
now
is to
determine
the
nearest
supplier
for getting
the
raw
materials
within
a
very
short period of
time
in
order
to
satisfy his
retailer's
request.
But,
this
application
does
not
provide
any
such
feature
related
to the
above
mentioned
logistics
problem
for making the
right
decision
on
the
right
time.
9.1.7.
Visibility
on
Inventory
Management:
Inventory
is
a
list
of goods and materials
or
those
goods and materials
themselves,
held
available
in
stock
by
a
retailer,
manufacturer
or
a
supplier.
Inventory
are
held
in
order
to
manage and
hide from the
customer
the
fact that
manufacture/supply
delay
is
longer
than
delivery delay,
and
also
to
ease
the
effect
of
imperfections
in
the
manufacturing
process
that
lower
production
efficiencies
if
production
capacity
stands
idle
for lack
of
materials.
An
inventory
is
a
detailed
list
of
items in
stock.
File
Edit
Tcob
Help
^
Piocess t CJeaillfxsNumbci
WIRE-SCD-0001
Description
Single
conductor wileisiMymts
12055 Attributes:Distributor
Wiie
quclitytnstock
Receipt
date
sa
Fahnlam. Inc.
4 122007
a
^,
Lot Category
SINGLEWIRE
Q
High
12 Nos
4/15/2007
51
0/0/0000
View. Lot Nunfcets
by
Expiration
Date
Expiiation Date Manufactured DateiiEimaniiB
3
4/1/2007gj
J
H
i ? Hi-J
<&
The
above
figure is
a screenshot
of
the
application when requested
to
list the availability
of
an
item
in
stock.
This
description does
not
provide
an
opened
in
a separate window which makes
it difficult to
analyze and compare
the
different data
sets and
thereby impacting
on
the decision
making.
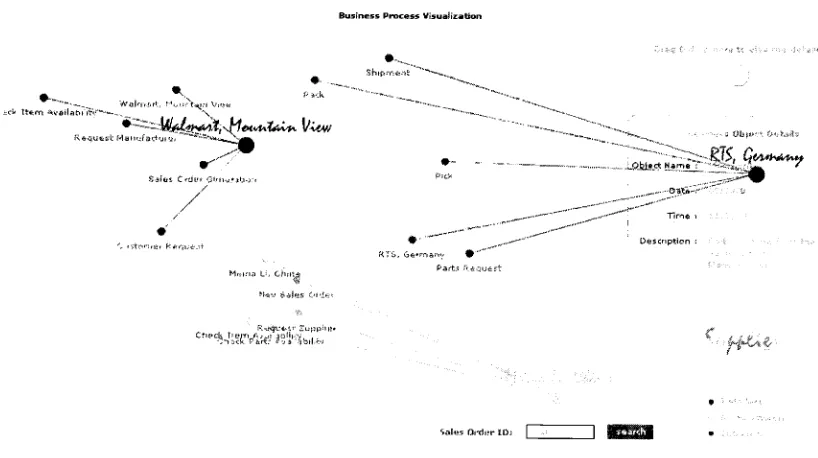
9.1.8.
Supply
Chain Relation:
Supply
chain
relation
helps
in understanding the
product
flow from the
source
of
production
to the
market
place
and
identifying
the
relation
between
each
flow. For example,
when
a
sales
order
ID is typed in the application, the
application
should
clearly demonstrate
the
product
flow
of
that
particular
order
from
a
retailer
to
a
supplier
along
with
their
relation.
When the information
is
further drilled
down,
each
process
should
give
more
details
of
the
flow
with
respect
to
time,
date
and
description
of
the
flow.
This
functionality
is
not
implemented
in
this
application
in
an
efficient
way
yet
it
gives
the
details
of
individual
flow
separately.
9.1.9.
Section 508 Issues:
"Section
508
of
the
Rehabilitation Act
requires
that
when
Federal
agencies
develop,
procure,
maintain,
or
use
electronic
and
information
technology, they
shall
ensure
that this
technology
allows:
a.
Federal
employees
with
disabilities
to
have
access
to
and
use
of
information
and
data
that
is
comparable
to
that
by
Federal
employees
who
are
not
individuals
with
disabilities,
unless
an
undue
burden
would
be imposed
on
the agency,
and
b.
Individuals
with
disabilities,
who
are
members
of
the
public
seeking
information
or services
from
a
Federal agency, to
have
access
to
and
use
of
information
and
data that is
comparable
to
that
provided
to
the
public
who
are
not
individuals
with
disabilities.
"[
http://www.section508.gov
]
Accessibility
guidelines
are
completely
not
followed
in this
application
10. Research
Study
2: SAP SCM
SAP
has
pioneered
in the
enterprise
business
application
development
for
more
than
thirty
years and
today they
are
the
number
one software providers
for
business
applications.
SAP SCM
allows
the
managers
to
model
the
existing supply
chain;
set
goals;
and
forecast,
optimize,
and
schedule
time,
materials,
and
other
resources.
It
enables
the
enterprise
to
maximize
return
on
assets
and
ensure
a
profitable match
of
supply
and
demand.
SAP
SCM
features
a
ready-to-use
business
processes,
event
management,
performance
management
and
other
key
processes.
It
is
a
seamless
integration through the
technology
foundation
of
SAP NetWeaver. SAP NetWeaver is
based
on
Enterprise Service Oriented Architecture
(SOA)
that
combines
enterprise
applications
with
Web
Services
and
open
technologies
-enabling
truly
adaptive
business.
10.1. Problem Statement:
SAP SCM
has
a
history
of success
stories
from its
satisfied
customers.
However,
SAP
applications
in
general are
highly
critiqued
by
the
business
people
for
its
bad
user
interfaces. In
its SCM
user
interface,
it
lacks in
one
key
area:
10.1.1. Real-time Event
Notification:
Business
applications are about event
notifications.
SAP SCM does the
best
in
its
world
to
alert
the
events
to
the
managers.
However,
SAP SCM
does
not
have
a
dynamic,
intuitive
reporting
engine
to
understand
the
complex
data.
For
example,
in
its
manufacturer
based
supply
chain
application
it
produces enormous amount of
data
and
yet, its reporting
engine reports
the
events
in
old-fashioned
tables
or
in
the form
of
alerts.
Notifying
the
key
events
is
one
of
the
main
tasks
for
the
managers
to
be
performed
through
an
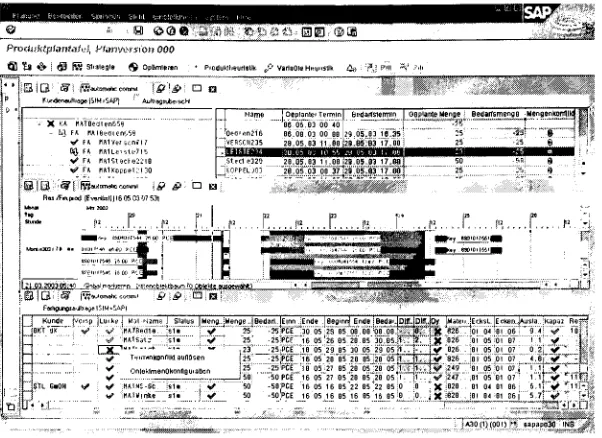
10.1.2. Information Drill Down:
As
mentioned
earlier, SAP
applications
in
general
are
highly
critiqued
for its
bad
user
interfaces.
Figure
shown
below is the
user
interface
of
an
SAP
SCM
application.
E7!
13 B Q
Prock tktpsantafvif Planwrsion000
SI
Xa& |
(S3rYJSlialegie$
OpUmleren Pi fluHheurUUk/'VariableHfiunatlk fyi*]\
-Sjj
'
KurdmfluBioeiSIM*SAFj AufOotubei!eM
^JBetJion2i
JVEBSCH23
C-epiar.tt-f Tcirrun| bt-cionoirTn-Mf.. .->.-cbnieMenqe Beasiismenge
Mengtinl.cjrifliHj
'-'XKA HHT9Pdlpn55R - egFA fiATeedien658
VFA HATVersch7l7
0$FA nATLeme7i5 V"FA HATSt8Cr;e2218 V FA HArKOBPBl2l30
06 06 83 00 40 06.09 03 80.ee 29 05.83 18.35
i
28.05 03 11, BB 29 05 B317 88^
25-'
3Sj
"
& I
'25 ft !
JjkoppELao
28.05 0311,U0:29058317 06: 280513 08 37*29 05 0317TOJ "
50 ;5fl| S i
O
^IrV?",'"': comrn I #>. ? 3i
":
R^n.p.od [Ev5rJloll(!G0SD3rj753]
*""*
...,r,.,,,i",,,,
l
1
r...i....r....i..,,r.
..P...r ...r...r....p.. nni,wiiTMri'fc^mmmd
iMmnani/f.. mci7-w tecsi'<:t^p
i 8OT1D17MO M-EOf'.Tp(
=
=-..'*iiSSHB
FliOuriCJSdliga[SIM+SAPI 1"' BKTTjK ."V 'V MATPb(118 ';1i V <^ HA'Sat;
'
1/
3.Wengt:bOarljEinfiEfiJeiBopinrijErideBud^r|CM
-25PCE '"
30 05 06'.
25PCE
"
1b05"2605 26 "JO 05:1
25PCE 16 29053005:9051 a
"'
X
'w>
2 Xe
VB26
EttatLJEtken^JBlB.kapai.Re 31040106 9
g
V IB 31 'in3-02V
25'
:r-PCE 1605 20 052ft052105 1
'16052785"2805 29 05 1 '""50PCE"
16 05 27 05 28 85^29 05T
-50PCE 16 05 16 05 22 85'2285 0 -50>CE 16 05 16 851685 16 8S;0
1 </826 1 :Y.249 8
'
X328 0. ;X;826
31 15inn? 48V
01M0107 1.1: 81050107 11V " 8184 8106 6.1 V H 8184 8106 57:V _
L.
1
*^.. ObloWme 0lienil gu ranorL|?
. STL GsbH -S v*1HXTHE.SC all V 50i V 1*TW1ift"
sii | V 50
IjULSJL
,,^,
Just
from
the
view
of
this
user
interface,
it
looks
like
an
excel
spreadsheet.
Almost every known information is
represented
in
the
form
of
tables
and
making the
information
drill down
task
even
more
difficult. Yet
another
important
critique
about
this UI is
the
representation
of
tables
with
both horizontal
and
vertical
scroll
bars. Almost every table in the
application
has
a
horizontal
scroll
bar
which
has
a
big
impact
on
the
user
experience.
10.1.3. Real-time
Simulation:
Similar to the Microsoft SCM application, this
application
doesn't have
any
sophisticated
feature for simulating
the
real
time
activities
going
on
in
a
manufacturer's
shop floor. It doesn't have any kind
of
simulating
engine
to
[image:22.535.126.427.133.352.2]11. Research
Implementation:
This
research
implementation
aims
at
solving the
problems
discussed
above
by focusing
on
developing
a
supply
chain
application
emphasizing
on
client
side
interactivity
and
information
visualization.
The
alternative
hypothesis
will
be
considered
for
developing
the
business
application
based
on
information
visualization
for better
understanding
the
complex
information
and
decision
making.
11.1. Introduction:
11.1.1.
Technical
problems addressed:
Technology
is the
master
piece
of
this
research
implementation.
A
variety
of
different
web
2.0 technologies
are
implemented
for
developing
this
prototype.
This
application
will
be
a
show
case
of all
the
major components
of
web
2.0 technologies. One primary
reason
to
focus
on
this
buzzword
is
because
there
is
no
supply
chain
application
that
exists
in
the
current
business
world
which
fully
utilizes
the
power of
a
Rich Internet Application
(RIA).
As
learnt
from Microsoft Dynamics
SCM,
it
centered all
activity
around
a
client-server architecture with a
thin
client.
Through this
system
all
processing
is
done
on
the server,
and
the
client
is
used
only
to
display
the
static
information.
The biggest drawback
with
this
system
is
that
all
interaction
with
the
application
must pass
through the
server,
which
requires
data
to
be
sent
to
the server, the
server
to
respond and
the
result
to be displayed
on
the
client side.
In
order
to
solve
this
problem
and
get
a
real-time
client
side
interactivity,
a
client
side
technology(AS2)
is
used
in
the
simulation
engine
for
sending/receiving streaming
data
through
client/server
sockets.
RIA
based
supply
chain
application
can
circumvent
this
slow
and
synchronous
loop
for many
user
interactions.
The
technical
problems
that
are
addressed
through
this
research
11.1.1.1. Richer: This
richer
functionality
of
the
application
may include anything
that
can
be
implemented
in
the
technology
used
on
the
client
side,
including
drag
and
drop,
using
a
slider
to
change
data,
calculations
performed
only
by
the
client and
which
do
not need
to
be
sent
back to the
server,
for
example,
validating
the
fields
of
a new sales order.
11.1.1.2.
More
Responsive:
The
interface
of
this
application
is
typically
much
more responsive
than those
of a standard
desktop
application which
must
always
interact
with
a remote
server.
The
most
sophisticated
examples
of
RIA's
exhibit a
look
and
feel approaching that
of
a
desktop
environment.
Using
a client engine
can
also produce
other performance
benefits.
11.1.1.3.
Client/Server Balance:
The
demand
for
client
and
server
computing
resources
is
better
balanced,
so
that the
web
server
need
not
be the
workhorse
that it is
with
a
traditional
web
application.
This
frees
server
resources,
allowing
the
same
server
hardware
to
handle
more
client
sessions
concurrently.
11.1.1.4.
Asynchronous
Communication: The
client engine
can
interact
with
the
server asynchronously.
That
is,
without
waiting for
the
user
to
perform
an
interface
action
like clicking
on
a
button
or
link. This
option
allows
the
application
to
move
data
between
the
client
and
the
server
without
making the
user
wait.
11.1.1.5. Network
Efficiency:
The
network
traffic
may
also
be
significantly
reduced
because
an
application
specific
client
engine
can
be
more
intelligent
than
a
standard web
browser
when
deciding
what
data
needs
to
be
exchanged
with
servers.
This
can
speed
up
individual
requests
or
responses
because less data is
being
transferred
for
each
interaction,
and
overall
network
load is
reduced.
However,
use
of
asynchronous
perfecting
the
code
cannot
anticipate
exactly
what
every
user
will
do
next,
it
is
common
for
such
techniques
to download
extra
data,
not all
of which
is
actually
needed
to
many
or all
clients.
11.1.2.
Implementation Innovations:
Innovations for this implementation focus
on
developing
a
business
application
for
monitoring
the
real-time activities
on
a
manufacturer's
shop floor.
There is
no
scalable
supply
chain
application
that
exists
in the
current
business
world
to
monitor and simulate
the
exceptions
that
occur
in
a
manufacturer's
shop
floor.
SAP
AG
is
the
world's
largest
business
software
company
which
pioneers
in
Supply
Chain
Management
applications.
SAP's
SCM
application
monitors all
the
key
events
that
occur
in the shop floor but its reporting
engine
is
overwhelmed with
data. Their reporting
engine
simply
alerts out
the
exceptions
in
a
textual
form. This
snippet
of
information is
not
intuitive to
use
and
it is
not
an
efficient
way
to
understand
the
exceptions
occurred.
Hence,
this
research
implementation
aims
at
solving
the
above
mentioned
problem
by
attempting to
simulate
the
events
with
the
overwhelmed
data. This Thesis
work
is
done
in
collaboration
with
SAP AG to
address
this
problem
by
experimenting
with
the
data
from
their
Supply
Chain
Application.
This
real-time
manufactory
monitoring
is the
major
innovation
that
has been implemented for this Thesis.
11.1.3.
Related Work:
There
were
some
attempts
made
by
other
organizations/institutions
to
solve
the
similar
supply
chain problem
through
visualization.
11.1.3.1. MIT Tangible Media Group:
MIT's Tangible Media group has
developed
a
physical
sensible
models
on
how
products
flow
between
their
business,
suppliers
and
customers.
Managers
can
physically modify this
model
on
the table to
send
information
and receive
real-time
feedback
on
the
simulation as
how
the
information
sent
has
changed
the
actual process.
rhttp://tangible.media.mit.edu/proiects/scvis/1
This is
yet
another
innovative
approach
by
MIT to
solve
the
similar
problem
proposed
in this Thesis.
However,
the
idea is
still
in the
research
phase
and
it
needs
to
address some
major
technical
challenges
to
put
up
a
functional
prototype
from the
actual
supply
chain
data.
11.1.3.2. PMC:
PM
Corporation
provides simulation
services
and
software's
for
proposed
enterprise
systems
to
improve
productivity.
They
maintain
a
wealthy
portfolio
of
3000
successful
simulation
projects.
However,
this
type
of
service
is
more
of a static
animation
to
demonstrate
how
a system
would
function in
the
real
world
and
they
are
not
data
centric.
They
help
managers
to
understand
&
analyze
the supply
chain
cost
&
performance.
,S r,I
7
ta_
...: :...^r.W~11.2. Scenario: Real-time
Manufactory
Monitoring
This supply
chain
application
that
was
researched
and
developed for
this
Thesis
consists of
three
different
intuitive layers in the
presentation
tier.
A
global
supply
chain
mapping layer to
keep
track
of
the
global events and
the
product
flow.
A
manufacturer
shop
floor to
simulate
the
real
time
events
that
occur
in
a
shop floor.
A
detailed level
assembly line
layer to
simulate
the
assembly
process
of a
product.
11.2.1.
Global
Supply
Chain
Mapping
Layer:
The
global
supply
chain
layer is built
on
top
of
the Yahoo! Maps
API
and
it is
implemented
with
the
following
functionalities
in
order
to
11.2.1.1. Global Locater:
A
global
locater helps
in
identifying
the
physical
locality
of
all
the suppliers,
manufacturers
and
retailers
associated
with
a
company's
supply
chain
process.
This
feature
helps
the
managers
to
physically
identify
where
their
nearest
supplier
is
located
in
the
global
map.
By
utilizing the
web
service
provided
by
Yahoo!
Maps
they
could
also
figure
out
the
exact
distance between
each
supplier
to further
optimize
their
transaction
time.
In
this
way
it
helps
the
managers
to
make
better
decisions
by
visualizing these supply
chain
data.
As
shown
in the
figure
below,
all
the
markers
plotted
with
the
color
orange are
the
real-time
location
of
the
manufacturers
and
blue
ones
are
the
suppliers
and
the
grey
markers
are
the
retailers
located
in
different
parts
of
the
globe.
Further
location
related
information
can
be
drilled down
by
clicking
on
the
markers
itself. These
markers
are
plotted
by feeding
in
their
address
information into the
application.
If
the
address
is
not
available,
markers
can
also
be
plotted
by knowing
the
latitude
and
longitudinal
co-ordinates of
the
location.
11.2.1.2. Parts Tracker:
Tracking
the
availability
of parts with
all
the
suppliers
is
a
key
functionality
in the
inventory
management.
As
learnt
from Microsoft
SCM,
inventory
management
is
represented
in
a
tabular
form
and
each
supplier
data
are represented
in
a
different
window.
In
order
to
address
this
issue,
data
associated with
the
inventory
management are
directly
displayed
on
the
map overlay
of
this
application.
The
user
doesn't have to worry
about
comparing different
tables
and
make
a
decision. Through this overlay,
inventory
management
can
be
compared
and
analyzed
from
different
suppliers.
Information
can
be
further
drilled
down
by
choosing
the
interested
supplier.
In the
figure
below,
numbers at
the
left
101, 102, 103,
etc.,
are
the
ID's
associated
with
the
parts
and
the
numbers
at
the
right
are
the
available numbers
in
stock of
that individual
part.
It is
represented with an
interactive
bar
graph
which
gives a
visual
overview
of
the
available
item.
All
these
information
are
displayed
in
the
real-time
location
of
the
suppliers.
zstan,.
Ludhij Delhi
Nepal
3 a. p
oEhiJat
Bhutan
anigUdesh-Auto-IDb.TS<*d Pft**fcsTracking& Swv(re InfYtastntctwe |in.
Mongolia D;tong nmmsmmn ./North OandcigO KotS3 Ttanjiri#. Pyongyang Taiyuan Shipazhiwnfl ,; ,5(M
nn>m G.ng^o South
F*u*.a
S'aflejhma
2006 Yahoo! Inc.
Burma (Myanmar)
Tokyo <ZHamsrratiu
11.2.1.3. Shipment Tracker:
The
shipment
tracker
feature
helps
in
analyzing
all
the
transactions
involved
during
the
transportation
of
items from
one place
to
another.
This
feature
gives
all
the
information
regarding
when
an
item
was
shipped,
where
the item is
shipped
to,
time stamp
of
the
origin
and
the
destination.
If
there
were
to
be
a
problem
during
the
transit,
application
will
automatically
alert
the
manager
through
its
asynchronous
behavior.
In
the
figure
below,
it
has
been
assumed
that
an
item
is
shipped
from
Stanford
University,
Palo Alto to
SAP
Labs,
Palo Alto.
The
details
of
the
origin
and
the
destination
can
be
viewed
by
clicking
on
the
respective
markers.
At the intersection
of
Page Mill
and
Junipero
Blvd,
an
exception
has
occurred
during
the transit
which
immediately
alerts
the
logistic
manager
with
a
red
marker.
When
the
red
marker
is
clicked,
complete
details regarding the
exception
are
displayed
to the
manager
including
the
description
of
the
exception.
Page Mill &Junipero BlvdPaltoAlio,CA
CarriageStatueISeverel Hilled Tirnei10:45 AM
DeliveryTime: 1:4PM DeUvTfc-r.*i3 Hours
Sbpped To: SAPLit-:, PaloAlio Prdducl Nams:Computer Paris
2E3
11.2.1.4. Interactive 3D Bar
Graph:
The 3D
bar
graph
component
has
the
functionality
of
any
other
bar
graph
in
exception
to
its three dimensional
representation
and
drag
and
drop
utility.
This
component
gives
a
visual
overview
of
the
parts
available with
all
the
suppliers
within
the
selected countries.
As
shown
in the
figure
below,
when
the
user
types the ID
of
an
interested
part,
it
comes
up
with
a
3D
bar
graph
which
shows
the
percentage
of
parts available
with
all
the
suppliers
in
USA,
Germany
and
China. This
feature helps
in comparing the
parts
availability
of
suppliers
from
different
countries.
An individual
bar
can
be dragged
and
dropped in
any
area
of
the map
overlay.
In this way it
gives
a greater
visibility
on
the
physical
locality
of
each
country
and
the
associated
graph overlaid
on
top
of
it.
The
color
purple
in the
graph
refers
to
the
percentage of
items
which
were
already
purchased
or
floating
in the supply
chain
process
and
the
color
green
represent
the
percentage
of
items
available
in
the
inventory.
huiti lt> h^nnti ParteTrackingftService Infrailrucfcurc[i-.^'jin::.-.>, ;:.,
11.2.1.5. Interactive 3D Pie
Chart:
The
interactive
3D
pie
chart
helps in analyzing the availability
of an
item
from
a
supplier,
manufacturer, distribution center,
retailer
and
purchased.
This
data
visualization
is tied
with
a
database
and
thereby
making
the
pie chart
dynamic for
all
the
available
parts
in the
inventory.
As
show
in the
figure,
an
item
with an
ID 102 is
searched
in the
database.
As
a
result,
it
displays
the
percentage
and
number
of
items
available
from
five different
sources.
Each individual
slice of
the
pie
chart
can
be
dragged to
a
separate segment
(orange)
as
shown
in the figure.
The thickness
of
each
slice
is
directly
dependent
on
the
availability
of
items. As
shown
in the visualization, the
supplier
(red)
has the
maximum
number of selected
item
and
hence its thickness is
greater
than the
rest of
the
slices.
These
slices
can
also
be
rotated
in
360 degree to
see
the
variation
in the thickness
of each
individual. In this way
this
interactive 3D
pie chart
is
more
intuitive to
use and
to
understand
the
data
as
opposed
to
M