City, University of London Institutional Repository
Citation
:
Sahu, S., Ali, J., Yupapin, P. P., Singh, G. and Grattan, K. T. V. ORCID: 0000-0003-2250-3832 (2018). High-Q and temperature stable photonic biosensor based on grating waveguides. Optical and Quantum Electronics, 50, .307. doi: 10.1007/s11082-018-1578-xThis is the accepted version of the paper.
This version of the publication may differ from the final published
version.
Permanent repository link:
http://openaccess.city.ac.uk/20188/Link to published version
:
http://dx.doi.org/10.1007/s11082-018-1578-xCopyright and reuse:
City Research Online aims to make research
outputs of City, University of London available to a wider audience.
Copyright and Moral Rights remain with the author(s) and/or copyright
holders. URLs from City Research Online may be freely distributed and
linked to.
High-Q and temperature stable photonic biosensor based on grating
waveguides
Sourabh Sahu1*, Jalil Ali2, Preecha P. Yupapin3,4, Ghanshyam Singh1 and K. T. V. Grattan5
1Department of Electronics and Communication Engineering, Malaviya National Institute of Technology, Rajasthan,
(INDIA)
2Laser Centre, IBNU SINA ISIR, Faculty of Science, Universiti Teknologi Malaysia, 81310 Johor Bahru,
(MALAYSIA)
3Computational Optics Research Group, Advanced Institute of Materials Science, Ton Duc Thang University,
District 7, Ho Chi Minh City, (VIETNAM)
4Faculty of Electrical & Electronics Engineering, Ton Duc Thang University, District 7, Ho Chi Minh City,
(VIETNAM)
5 City Graduate School and School of Mathematics, Computer Science & Engineering, City, University of London, London, EC1V 0HB, (UNITED KINGDOM)
[email protected], [email protected]
Abstract. In this work, analytical modeling and parameter evaluation of a photonic biosensor using cascaded silicon grating waveguides is illustrated. The sensor design consists of two cascaded waveguides with symmetric sidewall gratings to broaden the stop band region of the transmission spectra. In the work, the structure is first analyzed using the transfer matrix method. The parameter values are then optimized to obtain a sharper resonant peak in the center of the stop band. Notably, the resonant band of this structure provides a high Q factor (of 1.544 × 10⁵), which significantly improves the limits of detection. The sensor has been designed to detect the presence of biomaterial material (seen corresponding to a change in refractive index) on its surface by changing the change in device resonant wavelength. In this study, the effect of temperature on the detection of such biomaterials has also been evaluated, as has the temperature sensitivity of the device which is -0.0075nm/oC, over a temperature range of 18 oC to 34 oC.
Keywords: biosensor, transfer matrix method, Sellemeier equation, biochemical sensor.
1 Introduction
problems are avoided and in the label-free method, a specific biorecognition coating is needed at the surface of a sensor, that can only attach or bind to the dedicated molecule. The binding phenomenon changes the physical properties that then modify the optical characteristics of the photonic device (Fan et al. 2008; Zinoviev et al. 2008; Estevez et al. 2012). Based on these factors, a number of researchers have investigated the capability of the photonic sensors. The most frequently reported work has been concentrated on surface plasmons resonance (Chiu et al. 2005; Ni et al. 2015; Azzam et al. 2016; Mohanty et al. 2015), disk resonators (Boud et al. 2001; Guider et al. 2015), photonic crystal based devices (Dutta and Pal 2013; Derbali et al. 2011), and interferometers (Liu et al. 2013; Sahu et al. 2016). Further, the response of a Surface Plasmon resonance (SPR) sensor device is strongly dependent on the quality of the deposited material, especially the thickness and roughness of the coating. Additional modifications are also required in sensors of this type where an enzyme coating is used for the quantization of the complex biomaterials. However, the interference often seen due to the presence of a large number of whispering gallery modes limits the usability of ring and disk resonators for biosensing applications, apart from which the ring resonator devices also suffers from bending losses. The interferometric biosensors appear on the whole to be highly sensitive, but the direct dependency of the sensitivity on the unbalanced arm length increases the overall dimensions of the device, and even then a low Q-factor and sinusoidal variation at the output limits its usability as an effective sensing device. The class of photonic crystal-based devices provide higher Q factor and improved limits-of-detection, but such sensors require a complex manufacturing process to allow the precisely fabricated dimensions needed for such devices and they also show higher propagation losses. When compared to other photonic biosensors, the Bragg Grating-based resonating device suffers from transmission losses which are linked to the device construction. The size of the smallest feature of the structure (for example the depth of a grating) is more prone to fabrication variability (Chen et al. 2015; Sahu et al. 2017; Wang et al. 2013; Sahu and Singh 2017; Prabhathan et al. 2009). Despite that, such a design provides several advantages such as high Q factor, single-mode cavity, robust and the ability of integration for lab-on-chip (LOC) applications.
index of the sensor, resulting in a shift in the resonant wavelength. Such photonic sensors are highly sensitive, and can easily detect and differentiate the minimal changes in refractive index required to be monitored by promoting a greater interaction between the light and the biomaterial. Prabhathan et al. (Prabhathan and Murukeshan 2014) have demonstrated high Q and highly sensitive Bragg grating biosensors based on a phase-shift cavity resonator. Samira et al. (Najafgholinezhad and Olyaee 2014) have shown the temperature stability of such photonic sensors by considering the temperature varying microfluidic framework.
In this paper, the extraordinary ability of grating waveguide structures for a specific biosensing application is discussed. The structure discussed is composed of two cascaded grating waveguides, which widen the stop band region in the transmission spectra and the optimized cavity between the two waveguides produces a sharp resonant peak, of the order of Q~105. Further, the important effect of the variation of the temperature on the upper cladding surface is also studied. The paper is structured as follows: Sec. 2 presents the theory and analytical modeling of Bragg grating structure, Sec. 3 depicts device structure and discusses the methodology to model stopband. Ther evaluation of bio-sensing parameters is described in Sec. 4. The temperature dependence of the defect cavity has been investigated and is discussed in Sec. 5. Finally, Sec. 6 discusses the conclusions drawn from this study and extensive reference to the literature is made.
2 Analytical modeling of a grating waveguide
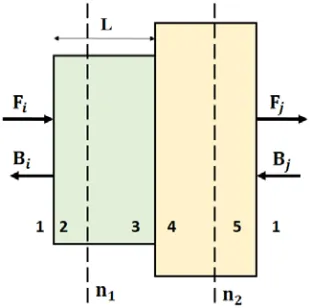
A schematic of a single grating segment is shown in Fig. 1. The optical signals used, when propagated through the structure, suffer reflections at all the interfaces. After many simultaneous reflections, only those signals that go through constructive interference are enhanced, while others cancel and propagate through gratings of a waveguide such as this. The reflected signals are observed in the transmission spectra in the form of stopband (Chrostowski and Hochberg 2015).
Fig. 1 Layered structure (single grating segment of a waveguide) used for TMM calculation
[image:4.612.228.383.487.641.2]periodic structures such as this. Here the signal propagation in the interface 1-2 (step index) is represented by the reflection and transmission coefficient, which is evaluated through consideration of Fresnel’s equation of reflection (n2 – n1)/(n2 + n1) (Chrostowski and Hochberg
2015), where n1 and n2 are the effective refractive indices of the waveguide segments, as shown in
Fig. 1. The corresponding matrix representation is given by;
�BF2
2�=�
1 t⁄ r t⁄
r t⁄ 1 t⁄ � ∙ �BF11�=� n1+n2 2√n1⋅n2
n1−n2 2√n1⋅n2 n1−n2
2√n1⋅n2
n1+n2 2√n1⋅n2
� ∙ �BF1
1�= M1−2∙ �
F1
B1� (1) Similarly, the matrix representation of the signal propagating from segment 2-3 (homogeneous waveguide) can be given as:
�FB3
3�=�
e−jβL 0
0 ejβL� ∙ �BF22�= M2−3∙ �BF22� (2) whereβis a propagation constant considering effective index and propagation loss (𝛼𝛼) and L is the length of the layer.
The overall matrix representation of the complete structure (MBG), shown in Fig. 1 can then be given as:
MBG = M1−2M2−3M3−4M4−5 (3) Thus the matrix representation of the complete grating waveguide with N number of grating periods can be represented by:
M = (MBG)N (4)
3 Cascaded grating waveguide (CGW) and stopband modeling
The proposed structure of a CGW design is shown in Fig. 2. The structure is drawn on a silicon-on-insulator (SOI) platform, the thickness of the core region is 220 nm and it is placed between the 2 µm thick silicon substrate and the upper cladding region. The material used for the core and the cladding regions are Si and SiO2 having a refractive indices values of 3.47 and 1.444
respectively, at 1550 nm. The evaluation of the fundamental modes is undertaken using a finite difference based Eigen-mode solver approach. Although several modes are found, according to a requirement to produce a wide stopband here, the fundamental quasi-TE mode is considered. The field concentration of the TM mode is mostly on the surface of the waveguide, that causes a very low interaction with the corrugated sidewall of the waveguide. So this produces a very narrow stop band region that too was found for the significantly large number of grating periods (Chen et al. 2015) seen. In the design of the grating waveguide, the phase matching condition needs to be verified, which corresponds to an evaluation of the grating period (Λ). The relationship is given
by Λ= λB
waveguide (Wang et al. 2013; Sahu and Singh 2017; Prabhathan et al. 2009). The grating period has a strong influence on the coupling of the signals. If a grating period, Λ > λB/(2·neff), then the
region is suitable for designing a fiber to waveguide coupler. In this region light, after interacting with the structure width, experiences scatter caused by discontinuity and becomes weak and is radiated out (Gonzalo Wangüemert-Pérez et al. 2014). Generally, fiber to waveguide grating couplers have been designed to work under this operating condition. Secondly, the region where
Λ < λB/(2·neff), is called as a sub-wavelength region, in which the waveguide is ideally lossless
(Gonzalo Wangüemert-Pérez et al. 2014a; Wang et al. 2014).
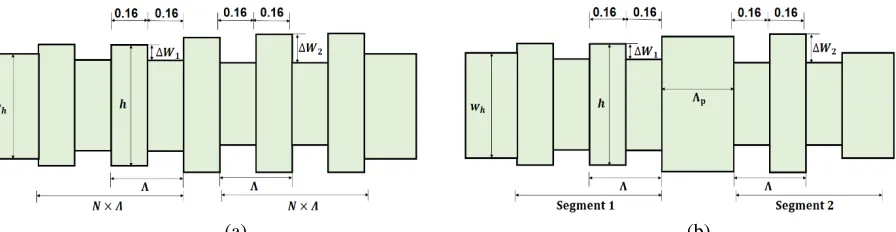
A method discussed in Sec.2 is used to evaluate the transmission spectra of the structure (Fig. 2). The value of the propagation loss considered is 3 dB/cm (Chen et al. 2015; Wang et al. 2013; Chrostowski and Hochberg 2015). The device consists of three segments, where the first and the second segment of the device consist of grating waveguides with their corrugation widths given
by ΔW1and ΔW2 (Fig. 2a). The number of the grating idividual segments is set to N = 375. Based
on the results shown in Fig. 3, it is found that the individual grating waveguides provide a stop band in the range of 1.53459 – 1.54452µm for ΔW1 (Fig. 3a) and 1.54288 – 1.55021µm for ΔW2
(Fig. 3b). The transmission spectra of the overall device show a band gap region of 1.53459 – 1.55021µm which is greater than the band gap found for the individual grating waveguides (Fig. 3c).
(a) (b)
Fig. 2 Cascaded grating waveguide with acorrugation of ΔW1 and ΔW2, and b with a cavity defect.
[image:6.612.86.534.387.503.2]
(c)
[image:7.612.155.463.72.240.2]Fig. 3 Individual transmission spectra of the grating waveguide a Segment 1, b Segment 2 and c cascaded waveguide
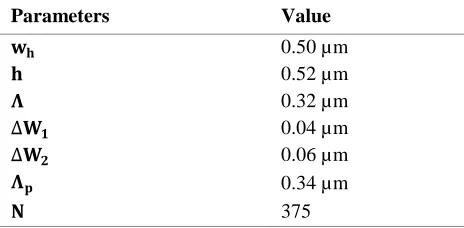
Table 1 Geometric parameters of the structure shown (Fig. 2)
Parameters Value
𝐰𝐰𝐡𝐡 0.50 µm
𝐡𝐡 0.52 µm
𝚲𝚲 0.32 µm
∆𝐖𝐖𝟏𝟏 0.04 µm
∆𝐖𝐖𝟐𝟐 0.06 µm
𝚲𝚲𝐩𝐩 0.34 µm
𝐍𝐍 375
The various geometric parameters of the structure considered are listed in Table 1. The corresponding matrix representation is given by M = (MBG1)N·(MBG2)N. Out of the three
segments, the third segment represents a defect cavity of length Λp, shown in Fig. 2b. On account
of the insertion of the cavity between the two grating waveguides, a sharp resonant peak occurs in the center of the stop band region, as is seen i Fig. 4a. The modified matrix representation is given by M = (MBG1)N·Mcavity· (MBG2)N, where the homogeneous waveguide segment is considered in
the calculation of Mcavity. Transmission spectra of the full device are shown in Fig. 4a-b which
shows the close up of the resonant wavelength. The spectacular sharp resonant peak for ΔλFWHM
(full width at half maxima) of 0.01 nm is observed at 1.544 microns. The measured quality factor (Q-factor) on this basis is 1.544 ×10⁵, which is very high and is important to be utilized for
[image:7.612.189.421.308.422.2]
(a) (b)
Fig. 4a Transmission spectra of the complete structure with a defect at the center of a waveguide, b zoomed version of the resonant peak.
4 Characteristics which are important for biosensing applications
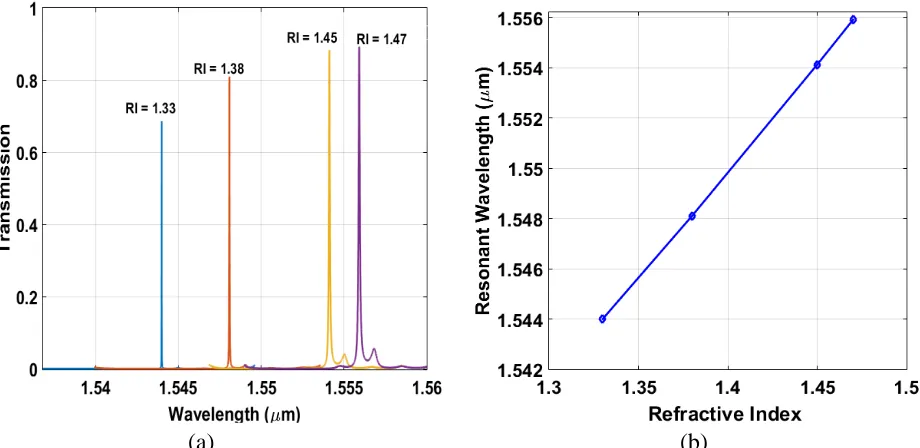
Based on the above discussion, the capacity of the device for the biosensing applications is evaluated and opportunities discussed. The microfluidic framework responsible for supplying biomaterials to the surface of the sensor is considered in the top part of the structure, which is the upper cladding region. For a device to be highly sensitive requires a larger variation in the effective index of a waveguide for a given change in refractive index of a biomaterial. In this work the considered biomaterials (and their refractive index (RI) values) are distilled water (RI = 1.33), Hemoglobin (RI = 1.38), Biotin-Streptavidin (RI = 1.45), and Bovine Serum Albumin (RI = 1.47).
(a) (b)
[image:8.612.76.535.71.285.2] [image:8.612.77.537.476.700.2]By changing the biomaterial, a significant shift in the resonant wavelength (λres) can be observed in the spectra obtained from the device, as shown in Fig. 5a. Fig. 5b represents the linear relationship between the resonant wavelength (λres) and nc. From the graph, it can be observed that
the resonant wavelength has shifted from 1554.02 at nc = 1.33 to 1556.13 at nc = 1.47. The key
performance parameters of the photonic biosensors to be optimized are sensitivity and limit of detection. The sensitivity is defined as, S = (Δλres/Δnc) where Δλ represents a shift of resonant
wavelength and it is evaluated from the slope of Fig. 5b. The limit of detection (Δnmin) is the
minimum possible resolution of nc required to obtain an observable shift in the resonant
wavelength. The evaluation of various key device parameters is performed by adopting the procedures defined in the literature (Talebi et al. 2013; Wang et al. 2013). Theoretical determination of the device sensitivity is 90 nm/RIU (where RIU is refractive index unit). The normalized sensitivity was determined to be 0.0583 /RIU with a LOD of 1.1184 × 10⁻⁴ RIU.
5 Temperature dependence of the structure
The materials used have a significant impact on device performance due to the variation of environmental temperature, which also alters the response of the device. To improve the consistency in this response, several practical factors should be considered. Most biological fluids have a significant proportion of water – indeed it is the main component present in blood plasma, extracellular fluid, etc., so studying the effect of changes in temperature of water on the response of the designed photonic sensor is important for many biosensing applications. Based on the previously reported literature it has been found that the wavelength shift and the temperature dependent refractive index of water can be found using Eq. (5) (Bashkatov and Genina 2003) where:
n(λ, t) = A(t) +B(t) λ2 +
C(t)
λ4 + D(t)
λ6 (5)
and λ= 1550 nm is the wavelength of light. A(t) = 1.3208−1.2325 × 10⁻⁵t + 1.8674 × 10⁻⁶t2+ 5.0233 × 10⁻⁹t3 (6)
B(t) = 5208.2413−0.5179t−2.284 × 10⁻²t2+ 6.9608 × 10⁻⁵t3 (7)
C(t) =−2.5551 × 10⁸−18341.336t−917.2319t2+ 2.7729t3 (8)
Fig. 6 Change in refractive index due to changes in temperature.
In this work, the narrow temperature range 18 oC to 34 oC in which water molecules exist in the
biomaterials has been considered. From Fig. 6, it is observable that the water has a negative temperature coefficient, that decreases its refractive index and hence this is seen to vary the resonant wavelength of the device.
(a) (b)
[image:10.612.183.429.69.265.2]Fig. 7 (a) Transmission spectra of structure for change in temperature, (b) shift in resonant wavelength (in terms of nm) due to change in temperature.
Table 2 Value of refractive index and resonant wavelength for variation of temperature.
Temperature (oC) Refractive Index Resonant Wavelength (nm)
18 1.3221 1543.37
[image:10.612.79.529.379.594.2] [image:10.612.157.453.673.733.2]26 1.3214 1543.31
30 1.3210 1543.28
34 1.3205 1543.24
In Fig. 7a the shift in a resonant wavelength corresponding to temperature variation is shown. An almost linear behaviour of the relationship has plotted in Fig. 7b and the evaluated temperature sensitivity is found to be -0.0075 nm/oC – a figure that indicates only 0.12 nm wavelength shift over the specified temperature range. Table 2 presents the refractive index and resonant wavelengths that correspond to a change in temperature. The proposed structure is simple to design and can be fabricated by a conventional CMOS fabrication facility and thus can be suitable for lab-on-chip integration.
6 Conclusion
In this work, a small group of photonic biosensors have been studied, based on cascade grating waveguides. The structure designed is easy to fabricate by using the conventional CMOS facilities. Insertion of a cavity between the two segments of the grating waveguides provides a narrow resonant peak of high Q factor, of the order of 105. The sensor operates through observing the wavelength shift, and an almost linear dependence has been found between the resonant wavelength shift and the refractive index change of the biomaterial used. The impact of temperature on the detection of the chosen biomaterial (through its water content) has also been studied. The result shows a 0.12 nm resonant wavelength shift, over the temperature range of 34
oC to 18 oC. The results obtained show that making a compact size sensor that can be used for
applications for lab-on-chip use for the simultaneous detection of several different biomaterials is possible.
Acknowledgement
The authors would like to acknowledge the mutual understanding for joint and collaborative work among researchers from Malaviya National Institute of Technology Jaipur (INDIA), Universiti Teknologi Malaysia, Johor Bahru, (MALAYSIA) and the Ton Duc Thang University, Ho Chi Minh City (VIETNAM). The support of the Royal Academy of \Engineering and the George Daniels Educational Trust is greatly appreciated.
References
Fan, X., White, I.M., Shopova, S.I., Zhu, H., Suter, J.D., Sun, Y.: Sensitive optical biosensors for unlabeled targets: A review. Anal. Chim. Acta. 620, 8–26 (2008). doi:10.1016/j.aca.2008.05.022
Zinoviev, K., Carrascosa, L.G., Del Río, J.S., Sepúlveda, B., Domínguez, C., Lechuga, L.M.: Silicon photonic biosensors for lab-on-a-chip applications. Adv. Opt. Technol. (2008). doi:10.1155/2008/383927
Chiu, M.-H., Wang, S.-F., Chang, R.-S.: D-type fiber biosensor based on surface-plasmon resonance technology and heterodyne interferometry. Opt. Lett. 30, 233–235 (2005). doi:10.1364/OL.30.000233
Ni, B., Chen, X.Y., Xiong, D.Y., Liu, H., Hua, G.H., Chang, J.H., Zhang, J.H., Zhou, H.: Infrared plasmonic refractive index-sensitive nanosensor based on electromagnetically induced transparency of waveguide resonator systems. Opt. Quantum Electron. 47, 1339–1346 (2015). doi:10.1007/s11082-014-0059-0
Azzam, S.I., Hameed, M.F.O., Shehata, R.E.A., Heikal, A.M., Obayya, S.S.A.: Multichannel photonic crystal fiber surface plasmon resonance based sensor. Opt. Quantum Electron. 48, 1–11 (2016). doi:10.1007/s11082-016-0414-4
Mohanty, G., Sahoo, B.K., Akhtar, J.: Comparative analysis for reflectivity of graphene based SPR biosensor. Opt. Quantum Electron. 47, 1911–1918 (2015). doi:10.1007/s11082-014-0057-2
Boyd, R.W., Heebner, J.E.: Sensitive disk resonator photonic biosensor. Appl. Opt. 40, 5742–5747 (2001). doi:10.1364/AO.40.005742
Guider, R., Gandolfi, D., Chalyan, T., Pasquardini, L., Samusenko, A., Pucker, G., Pederzolli, C., Pavesi, L.: Design and optimization of SiON ring resonator-based biosensors for aflatoxin M1 detection. Sensors (Switzerland). 15, 17300–17312 (2015). doi:10.3390/s150717300
Dutta, H.S., Pal, S.: Design of a highly sensitive photonic crystal waveguide platform for refractive index based biosensing. Opt. Quantum Electron. 45, 907–917 (2013). doi:10.1007/s11082-013-9697-x Derbali, J., AbdelMalek, F., Obayya, S.S.A., Bouchriha, H., Letizia, R.: Design of a compact photonic
crystal sensor. In: Optical and Quantum Electronics. pp. 463–472 (2011)
Liu, Q., Tu, X., Kim, K.W., Kee, J.S., Shin, Y., Han, K., Yoon, Y.J., Lo, G.Q., Park, M.K.: Highly sensitive Mach-Zehnder interferometer biosensor based on silicon nitride slot waveguide. Sensors Actuators, B Chem. 188, 681–688 (2013). doi:10.1016/j.snb.2013.07.053
Sahu, S., Kozadaev, K. V, Singh, G.: Michelson Interferometer Based Refractive Index Biosensor. In: 13th International Conference on Fiber Optics and Photonics. p. Th3A.60. OSA, Washington, D.C. (2016) Chen, Z., Flueckiger, J., Wang, X., Zhang, F., Yun, H., Lu, Z., Caverley, M., Wang, Y., Jaeger, N.A.F., Chrostowski, L.: Spiral Bragg grating waveguides for TM mode silicon photonics. Opt. Express. 23, 25295 (2015). doi:10.1364/OE.23.025295
Sahu, S., Ali, J., Singh, G.: Refractive index biosensor using sidewall gratings in dual-slot waveguide. Opt. Commun. 402, 408–412 (2017). doi:10.1016/j.optcom.2017.06.051
Wang, X., Flueckiger, J., Schmidt, S., Grist, S., Fard, S.T., Kirk, J., Doerfler, M., Cheung, K.C., Ratner, D.M., Chrostowski, L.: A silicon photonic biosensor using phase-shifted Bragg gratings in slot waveguide. J. Biophotonics. 6, 821–828 (2013). doi:10.1002/jbio.201300012
Sahu, S., Singh, G.: Modeling of grating slot waveguide for high-Q based refractive index sensor. In: 2017 International Conference on Computer, Communications and Electronics (Comptelix). pp. 394–396. IEEE (2017)
Prabhathan, P., Murukeshan, V.M., Jing, Z., Ramana, P. V: Compact SOI nanowire refractive index sensor using phase shifted Bragg grating. Opt. Express. 17, 15330 (2009) doi:10.1364/OE.17.015330. Chrostowski, L., Hochberg, M.: Silicon Photonics Design. Cambridge University Press, Cambridge (2015) Prabhathan, P., Murukeshan, V.M.: Silicon waveguide multiplexed sensor array configuration for
label-free biosensing applications. J. Indian Inst. Sci. 94, 273–282 (2014)
Talebi Fard, S., Grist, S.M., Donzella, V., Schmidt, S.A., Flueckiger, J., Wang, X., Shi, W., Millspaugh, A., Webb, M., Ratner, D.M., Cheung, K.C., Chrostowski, L.: Label-free silicon photonic biosensors for use in clinical diagnostics. 8629, 862909 (2013). doi:10.1117/12.2005832
Gonzalo Wangüemert-Pérez, J., Cheben, P., Ortega-Moñux, A., Alonso-Ramos, C., Pérez-Galacho, D., Halir, R., Molina-Fernández, I., Xu, D.-X., Schmid, J.H.: Evanescent field waveguide sensing with subwavelength grating structures in silicon-on-insulator. Opt. Lett. 39, 4442 (2014). doi:10.1364/OL.39.004442
Wang, X., Grist, S., Flueckiger, J., Jaeger, N.A.F., Chrostowski, L.: Silicon photonic slot waveguide Bragg gratings and resonators. Opt. Express. 21, 19029 (2013). doi:10.1364/OE.21.019029