7th European STAMP Workshop & Conference 18 - 20 September 2019, Helsinki
A comparative safety assessment for Direct Current and
Direct Current with hybrid supply power systems in a
windfarm Service Operation Vessel using
System-Theoretic Process Analysis
Victor Bolbot1*, Romanas Puisa1, Gerasimos Theotokatos1, Evangelos Boulougouris1 and Dracos Vassalos1
1 Maritime Safety Research Centre, University of Strathclyde, UK
ABSTRACT
As windfarms are moving further offshore, their maintenance has to be supported by the new generation Service Operation Vessels (SOV) with Dynamic Positioning capabilities. For the SOV safe operations it is crucial that any hazardous scenario is properly controlled. Whilst international regulations require the implementation of Failure Modes and Effects Analysis (FMEA) for SOV power systems, FMEA has been criticised for not addressing properly failures in control systems. In this study, System-Theoretic Process Analysis (STPA) is employed for identifying the hazardous scenarios in terms of Unsafe Control Actions (UCAs) in Direct Current (DC) and DC with batteries power systems. Then the identified UCAs are ranked based on their risk. The results demonstrate that the number of hazardous scenarios derived by the STPA increases in a power system with batteries in comparison to a conventional DC power system, thus depicting higher complexity of this system. However, the increase in overall risk is small and within acceptable limits, whilst the risk reduces for a number of UCAs leading to Diesel Generator overload sub-hazard.
Keywords: Windfarm Service Operation Vessels, Safety, Blackouts, Diesel-Electric Propulsion, Hybrid Diesel-Electric Propulsion
1
INTRODUCTION
Offshore wind-faming is becoming a major source of the renewable energy in many countries. However, the offshore wind farms maintenance cost currently impacts on the competitiveness of the electricity produced. Present safety requirements and needs of the service personnel influence wind farm locations and operational flexibility. Consequently, future Service Operation Vessels (SOVs) need to be more efficient and safer in order to meet future demands. Next generation support vessels providing safe and more efficient offshore wind farm servicing (the EU-funded NEXUS project) is aiming to deliver an advanced SOV design optimised for efficiency, performance, safety, and working environment whilst minimising costs throughout the life-cycle by 20% compared to the current state of the art vessels (EC, 2019). As wind farms are moving further from the coast, significant innovations in the SOV design are required. This, together with stringer emission regulations and fluidity in the fuel market prices, render attractive the use of alternative fuels and power generation systems, including hybrid power supply, where diesel-generators and batteries are used to cover ship energy needs.
The incorporation of batteries achieves fuel consumption reduction by running Diesel Generator (D/G) sets at optimum load by peak load shaving and functioning as a spinning reserve
(Brandsaeter, Valoen, Mollestad, & Haugom, 2015; Geertsma, Negenborn, Visser, & Hopman, 2017; Räsänen, 2017). Implementation of batteries support the D/G sets downsizing, which results in the D/G sets operation at their most efficient load ranges (Brandsaeter et al., 2015). Other advantages include higher redundancy in the system and lower emissions due to the batteries charging from the local grid in harbour (Brandsaeter et al., 2015; Geertsma et al., 2017). On the SOV, due to the Dynamic Positioning (DP) power requirements, the D/G sets are often oversized or pushed to operate at lower loads to be able to withstand a sudden loss of a D/G set in adverse weather conditions. Therefore, incorporation of batteries to provide the necessary spinning reserve during faulty conditions or power during power peaks on SOV can provide substantial benefits in terms of fuel savings during DP and other operations. Batteries disadvantages include relatively high procurement cost (Brandsaeter et al., 2015; Geertsma et al., 2017), large batteries size and weight (Räsänen, 2017), limited number of recharging cycles (Räsänen, 2017) and addition of new hazardous scenarios to the system (Bolbot, Theotokatos, Boulougouris, & Vassalos, 2019; Brandsaeter et al., 2015).
On the next generation SOV, with increased technicians and crew numbers, ensuring safety of power generation system is paramount as any malfunctions such as blackout or brownout may lead to contact/collision/grounding. These accidents in turn can result in ships progressive flooding and capsize with crew and technicians getting drown (Vassalos et al., 2019). In addition, the introduction of batteries increases hazardous scenarios number resulting in fire, explosion and crew intoxication (Brandsaeter et al., 2015), e.g., a fire on hybrid-electric tugboat occurred due to malfunction of Battery Management System (Hill, Agarwal, & Gully, 2015), whilst a number of similar incidences have been reported in other industries (Hill et al., 2015). In this respect, it is crucial to ensure that all these scenarios are identified and properly addressed during the system design.
The primary reference for designing safe power generation systems is the IMO regulations (Organization, 2014) and classification society rules (DNVGL, 2015). Currently, the main hazard identification method in the DP systems is the Failure Mode and Effect Analysis (FMEA), which is applied to ensure adequate system components redundancy (DNVGL, 2015; IMCA, 2015). In previous studies, a high-level FMEA has been used for comparative safety analysis of different propulsion systems, including power system with batteries in other ships, for example a Ferry boat in (Jeong, Oguz, Wang, & Zhou, 2018). However, FMEA has been criticised for not addressing properly the automation functions in the system (Bolbot, Theotokatos, Bujorianu, Boulougouris, & Vassalos, 2019; Rokseth, Utne, & Vinnem, 2017; Sulaman, Beer, Felderer, & Höst, 2017; Thomas, 2013). On the other hand, control and automation functions have an important role for power generation on DP vessels (United Kingdom Protection & Indemnity Club, 2015). Considering this, System-Theoretic Process Analysis (STPA) has been proposed to be used to address the complexity in interactions between the control systems and physical processes (N. G. Leveson, 2011). In (Bolbot, Theotokatos, Boulougouris, et al., 2019) the safety of hybrid-electric propulsion system and classical propulsion system using Alternate Current for electrical power distribution has been compared using STPA on a cruise ship vessel. Other studies have referred to potential safety issues on ship power systems with batteries but they did not follow a hazard identification method for their analysis (Hill et al., 2015).
Pertinent literature reveals a number of research gaps: (a) hazard analysis of power systems with Direct Current (DC) power network and DC power with batteries system on SOV using STPA and (b) incorporation of risk as a measure in STPA to compare different designs. The research gap leads to the aim of this study, which is to analyse the safety of power systems on SOV with batteries using STPA and to compare it with standard DC power systems in terms of risk.
2
METHODOLOGY
As it has been referred in the introduction, STPA has been selected in this study to identify the hazardous scenarios. However STPA has been criticised for not allowing risk estimation and criticality analysis (Dawson et al., 2015); for this reason the STPA method has been enhanced. The method steps are presented in Figure 1 and described in more detail below.
STPA defines the accident as: “an undesired and unplanned event that results in loss, including loss of human life or human injury, property damage, environmental pollution, mission loss, financial loss, etc.” (Leveson & Thomas, 2018). The hazards in the STPA framework are understood as: “system states or set of conditions that together with a worst-case set of environmental conditions, will lead to an accident” (Leveson & Thomas, 2018). The hazards in STPA are viewed on a system level, so they go beyond the single failures that may occur in the system and should be referred to a specific state of the system. Sub-hazards are considered states in a worst-case scenario leading to hazard realisation. Generic requirements can be specified, based on the hazards and sub hazards.
The development of a functional control structure is one of the differentiating points of the STPA analysis, compared with the other methods (Leveson & Thomas, 2018). Usually, it starts with a high-level abstraction of the system and proceeds to a more detailed system description. The initial control structure consists of the high-level controller, the human operator and the controlled process with the basic control, feedback and communication links. A more detailed description would incorporate a hierarchy of controllers. Both high-level and detailed control structure can be used for the safety analysis at different system design stages. After the development of the basic control structure, the next step is its refinement. The required actions include a) the identification of each controller responsibilities; b) the process model with process variables and potential process variable values; c) the control actions; d) the behaviour of the actuators; e) the information from the sensors; f) the information from the other controllers.
The actual hazards identification starts by finding the Unsafe Control Actions (UCAs). The possible ways to proceed are either by using the control actions types as initially proposed for the STPA (N. Leveson, 2011) or by using the context tables as proposed in Thomas (2013). Herein, the second of the two approaches has been selected. According to both approaches, the possible UCAs can be of the following seven types (Leveson & Thomas, 2018):
[image:3.595.148.443.151.367.2] Not providing the action leads to a hazard. Providing of a UCA that leads to a hazard. Providing the control action too late.
Providing the control action too early.
Providing the control action out of sequence. Control action is stopped too soon
Control action is applied for too long.
According to the STPA, there is also another type of UCA, when the safe control action is provided but is not followed. This type of failure mode is addressed during the identification of causal factors in the second step of the method. Similarly, with the system hazards, safety constraints can be derived for the UCAs, aiding the identification of possible safety barriers.
The second step in the hazard identification of the STPA has the purpose of determining all the scenarios and causal factors leading to the UCAs. This is done by examining the hazardous scenarios, including software and physical failures as well as design errors. There are several ways to organise the results of the hazardous scenarios by using tables or lists. In this work, the process was augmented by a checklist, developed on the basis of previous studies (Becker & Van Eikema Hommes, 2014; Blandine, 2013). The main categories of causal factors are:
Inappropriate control input Hardware failure
Software faulty implementation Software faulty design
Erroneous or missing input
Inadequate control command transmission
Flawed execution due to failures in actuator or physical process Conflicting control actions
The systemic and contributory causal factors (Puisa, Lin, Bolbot, & Vassalos, 2018) have not been considered during identification of the causal factors, as the implementations of proper training for system operator and maintenance is out of the scope of system designer. The aim of the designer is to ensure the adequate reliability and availability of system functions. Therefore, the aim of the analysis is to rank the different hazardous scenarios identified by the STPA to allow better allocation of resources to specific controllers; hence the different scenarios (UCAs) risk is estimated.
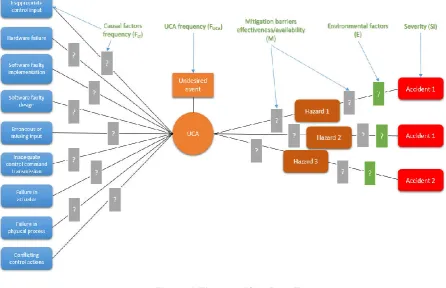
The new part of the STPA in the presented methodology is the risk estimation for the identified UCAs. The basic assumption behind the estimation is that UCA can be considered as the central undesired event in the system, thus being in the centre of the Bow Tie as depicted in Figure 2. Then the total risk can be estimated as aggregation of individual UCAs risks. In a similar way with Level of Protection Analysis method (BSI, 2004), the risk of an UCA is considered dependent on its causal factors, the effectiveness of mitigation barriers, and coincidence with inadvertent environmental factors. If the causal factors likelihood, the accident severity, the mitigation barriers/measures effectiveness and relevant inadvertent environmental factors are quantified, the risk for each UCA can be estimated.
For the analysis presented in the methodology herein, with the exception of the above, the following additional assumptions have been made:
The UCAs causal factors are independent (Blandine, 2013) as the systemic and contributory factors (Puisa et al., 2018) are omitted as the focus is on the system design.
If UCA leads to more than two hazards, then paths with the smaller risk can be ignored.
Similarly, if multiple causal factors result in UCAs, the causal factors with smaller likelihood can be ignored for estimations.
The overall risk can be aggregated and calculated for the system based on individual UCAs risk. Each mitigation barrier can mitigate the 90% of relevant hazardous conditions. This is rather a
conservative assumption with regard to effectiveness of mitigation barriers (BSI, 2004).
The UCA causal factors frequency is estimated by considering it together with the relevant UCAs preventative barriers effectiveness.
Accidents are considered as disjoint and independent.
If UCAs are caused by other UCAs (they are practically their causal factors), then these causal UCAs are omitted for estimation of risk for UCAs. Instead, these causal UCAs are considered to contribute to risk independently from other UCAs.
Causal factors resulting in multiple UCAs occurring are repeated for each UCA risk estimation, as this assumption has no influence on estimation of the total risk.
The Potential Loss of Life ( ) is one of the expressions of Societal Risk (International Maritime Organisation, 2013) and is defined as expected value of the number of fatalities per year (International Maritime Organisation, 2013; Vinnem, 2014):
= ∑ ∑ (1)
Where is the annual frequency of accidental scenario (event tree terminal event) with personal consequences and is expected number of fatalities in each accidental scenario (event tree terminal event) with personal consequences .
The is connected to the Individual Risk (IR) according to the following equation (Johansen & Rausand, 2012), where N is the number of people in population exposed to risk:
= (2)
Based on the assumptions above, the can be approximated as sum of risk of individual UCAs as follows:
= ∑ (3)
[image:5.595.74.521.179.467.2]Now the risk for each UCA using frequency of accidental scenario and consequence of accidental scenario expressed in fatalities per year is estimated as follows:
= × [fatalities per ship-year] (4)
The frequency of each accidental scenario is estimated using UCA frequency , effectiveness of mitigation controls and probability of inadvertent environmental context as in eq. (5) and the severity of each accidental scenario is estimated as in eq.(6):
= × × = × 10 × 10 [events per ship-year] (5)
= 10 [fatalities per events] (6)
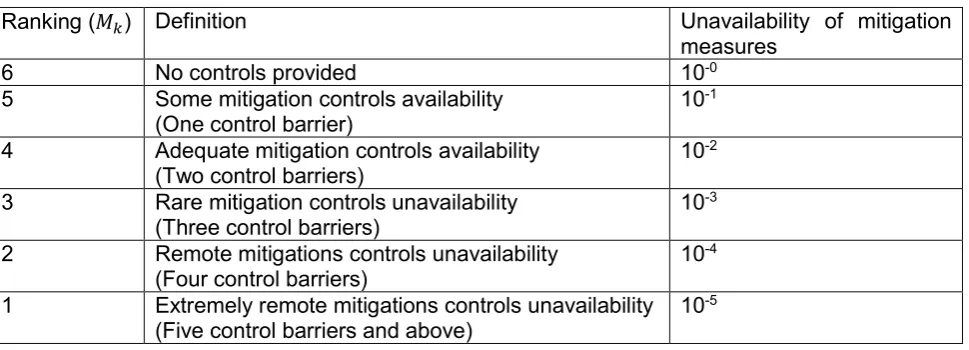
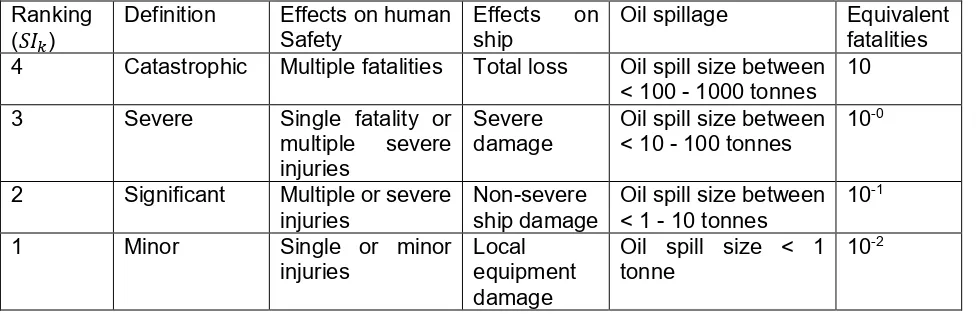
The ranking for effectiveness of mitigation measures is implemented according to Table 1. For the ranking of available mitigating barriers, different mitigating barriers type are considered namely a) the presence of redundant component implementing the same function with the faulty one, b) available safety or reconfiguration functions c) humans operators rectification actions. The ranking of inadvertent environmental factors ( ) is implemented as in Table 3. The Severity Index for accident ( ) is selected according to Table 2 retrieved from Formal Safety Assessment Guidelines (International Maritime Organisation, 2013).
The UCA is described by referring to the controller, the control action, the control action failure type, the context and the link to the hazard (Leveson & Thomas, 2018). Practically though, an UCA will occur if specific control action failure mode is realised in specific context. In case of a Fault Tree this relationship would be represented using AND gate, hence multiplication between frequency of control action failure mode and probability of specific context is required. However, the control action failure mode can be attributed to the specific causal factors, identified previously, which can be connected using OR gate to the UCA (Blandine, 2013). Wrong execution practically refers to one of the UCAs types (Leveson & Thomas, 2018) and has been already included in identification of causal factors. Therefore, the UCAs frequency ( ) is estimated as in eq.(7) using frequency of causal factors leading to relevant control action failure mode, the number of controllers in system, which can implement the specific UCA and the probability of the UCA context:
= × × 10 [events per ship-year] (7)
The is ranked using Table 4, retrieved from Formal Safety Assessment Guidelines (International Maritime Organisation, 2013) and is estimated as in eq.(8), whilst ranking used for estimating the probability of UCA context is based on Table 5.
[image:6.595.62.547.594.769.2]= 10 [events per ship-year] (8)
Table 1 Ranking for availability of UCAs mitigation measures
Ranking ( ) Definition Unavailability of mitigation
measures
6 No controls provided 10-0
5 Some mitigation controls availability (One control barrier)
10-1
4 Adequate mitigation controls availability (Two control barriers)
10-2
3 Rare mitigation controls unavailability (Three control barriers)
10-3
2 Remote mitigations controls unavailability (Four control barriers)
10-4
1 Extremely remote mitigations controls unavailability (Five control barriers and above)
Table 2 Ranking for severity of UCAs hazards/accidents (International Maritime Organisation, 2013).
Ranking ( )
Definition Effects on human Safety
Effects on ship
Oil spillage Equivalent fatalities 4 Catastrophic Multiple fatalities Total loss Oil spill size between
< 100 - 1000 tonnes 10
3 Severe Single fatality or multiple severe injuries
Severe damage
Oil spill size between < 10 - 100 tonnes
10-0
2 Significant Multiple or severe injuries
Non-severe ship damage
Oil spill size between < 1 - 10 tonnes
10-1
1 Minor Single or minor injuries
Local equipment damage
Oil spill size < 1 tonne
10-2
Table 3 Ranking for inadvertent environmental factors.
Ranking ( ) Definition Probability of inadvertent
environmental factors 3 Uncontrolled UCA will always lead to accident 10-0
[image:7.595.63.543.380.517.2]2 Uncontrolled UCA will sometimes lead to accident 10-1 1 Uncontrolled UCA will rarely lead to accident 10-2
Table 4 Ranking for causal factors frequency (International Maritime Organisation, 2013).
Ranking ( )
Definition F
(per ship year)
F
(per ship hour) 7 Likely to occur once per month on one ship 10 1.14 10-3 5 Likely to occur once per year in a fleet of 10 ships, i.e. likely to
occur a few times during the ship's life
10-1 1.14 10-5
3 Likely to occur once per year in a fleet of 1,000 ships, i.e. likely to occur in the total life of several similar ships
10-3 1.14 10-7
1 Likely to occur once in the lifetime (20 years) of a world fleet of 5,000 ships
10-5 1.14 10-9
Table 5 Probability of UCA context.
Ranking ( ) Definition Probability of inadvertent
environmental factors
4 Always 10-0
3 Sometimes 10-1
2 Rarely 10-2
1 Remotely 10-3
3
CASE STUDY DESCRIPTION
mode and their power output is regulated by speed governor (ECU 7) and Automatic Voltage Regulator (AVR) whilst delivered power to network through converters is controlled by the Generator Control Unit (GCU). A number of other smaller functions are supported by EIM and EMU units on the D/G sets. Power transferred between sections is controlled by Bus Tie Unit (BTU). Several safety systems are used to trip the D/G sets and the propulsion motors if a fault had been observed.
In the investigated hybrid-electric power system, in addition to the initial system components, one battery pack per switchboard is installed. The battery output and condition are controlled by a
[image:8.595.139.461.173.397.2]dedicated Battery Management System (BMS), which monitors the actual battery health state, the battery and cell capacity and controls the battery cells charge status, the discharging/charging rate, the power output and the battery auxiliary systems. The BMS communicates with PMS to determine the actual power status and power demand implementing in this way the Energy Management System functions. The BMS also communicates with fire-fighting systems to ensure the firefighting
Figure 4 Power network layout diagram
[image:8.595.59.522.437.685.2]actions operation. Battery capacity is considered adequate to cover the whole ship power demand for a limited period. The considered battery is of Li-Ion type.
The following has been assummed with respect to the systems operation:
The power system control network is isolated from other networks, so no hazardous scenarios are developed in the system because of cyber-attacks.
The human operator does not introduce new hazards, only mitigates them. Power plant operates with the bus-tie circuit breaker disconnected.
Power can be transferred from switchboard to a switchboard using converters at Bow thruster motor 3.
With respect to the case study it has assumed that the for each UCA is either 2 (Significant) or 3 (Severe). In addition the number of people on the ship, including crew and technicians has been estimated as 60.
4
RESULTS AND DISCUSSION
Based on previous Formal Safety Assessment studies, the following causality scenarios can be considered as accidents (IMO, 2008):
Collision [A-1] Contact [A-2] Grounding [A-3] Fire [A-4] Explosion [A-5]
Machinery damage [A-6] Foundering [A-7]
Operating personnel injury or death [A-8]
These accidents are not fully disjoint, as a fire can lead to collision and vice versa (Hamann, Papanikolaou, Eliopoulou, & Golyshev, 2013). In addition, numerous hazards can be connected to the accidents on a cruise ship and there can be interactions between different hazards. Herein, the most important and those related to the system under analysis are referred (Bolbot, Theotokatos, & Vassalos, 2018; IMO, 2008):
Propulsion loss [H-1] leading to collision, contact and grounding accidents. The propulsion loss can be further developed into the following sub-hazards:
o D/G sets overload [H-1-1]. o Transients [H-1-2].
o Imbalanced power generation [H-1-3] o D/G sets unavailability [H-1-4]
o Batteries unavailability [H-1-5]
o Propulsion motors unavailability [H-1-6]
Conditions contributing to fire in the engine room [H-2].
Uncontrolled electrical faults in equipment leading to [H-3] fire and explosions in system components or blackout (propulsion loss).
Toxic/flammable atmosphere in battery room leading to crew intoxication and/or fire [H-4]. Anomalous conditions in batteries leading to fire and its expansion [H-5].
Arson – deliberate act resulting in fire [H-6]. Human erroneous operation [H-7]
Although, it is acknowledged that there is contribution from hazards [H-6]-[H-9] to the overall system risk, these hazards can be considered as external to the system presented in Figure 4 and Figure 3 and thus their analysis has been omitted. The interconnection between hazards and accidents is schematically shown in Figure 5.
The developed control structure has been already provided in Figure 3. The difference between the two power systems can be found in the presence of Battery Management System and additional interactions between the fire-fighting system and the power system. The description of responsibilities of each controller and their control actions, although necessary and used for the analysis, have been omitted for brevity and confidentiality purposes.
The results of applying STPA and risk analysis and comparing the different results are presented in Table 7, Table 8, Figure 6 and Figure 7. A guiding example of application of the method is provided in Table 6. As it can be observed from Table 7, the number of the UCAs and the associated causal factors is significantly higher in the system with batteries. This is owed to the increased number of interactions between the control systems and the physical processes in a power system with batteries. However, the estimated risk is only slightly higher in the power system with batteries. The estimated individual risk for different Severity Indexes is smaller than negligible 10-6 and in every case smaller than the maximum tolerable risk for the crew 10-3 and maximum tolerable risk for passengers 10-4 (International Maritime Organisation, 2013). So it can be considered as acceptable. However, it should be noted that the estimated risk includes only failures in control systems, whilst some scenarios that could be potentially identified with FMEA have not been addressed. Consequently, the estimated risk would be greater, if FMEA related accidental scenarios have been incorporated. It should be also noted, that there is a specific subjectivity in the analysis, as a) uncertainty in the estimated frequencies and probabilities has not been incorporated and b) there are numerical approximations in calculations due to the use of tables with rankings. Consequently, the estimated risk must be taken with precaution. The subjectivity that exists in the risk assessments is one of its major weaknesses (Aven, 2016; Goerlandt, Khakzad, & Reniers, 2016). Last, but not least the risk is estimated for a system and not the whole vessel, so it can be used for comparison with acceptable values with precaution; it can be used though for comparison of different systems and scenarios.
As it can be observed from the Table 8, the incorporation of batteries reduces the risk in all the controllers but BMS. In addition, from the Figure 6, it can be observed that the contribution of the D/G sets overload [H-1-1] sub-hazard to risk is smaller in the system with batteries than in the initial system design. This can be attributed to the fact that batteries act as an additional barrier to the overload sub-hazard. However, despite this, the total fire risk (including H-2 and H-5 hazards) as can be observed is significantly higher in the system with batteries, as the batteries themselves are a new potential source of fire.
7th European STAMP Workshop & Conference 18 - 20 September 2019, Helsinki
Table 6 Example of application of the method.
Controller Controlee
Control action
Failure
mode Context Assumption
Hazar d /Sub
hazard Accident
Causal factor
Mitigating barriers
Environmental
factors m Risk
Fire Fighting
control DG sets
Disconnec t energy supply
Providing causes hazards
Power demand status is HIGH and Operating status is ENGAGE D
Loss of power generation for several D/G sets simultaneousl
y H-1-1
Collision/ Contact/ Grounding [A-1],[A-2], [A-3]
Wrong softwar e rules
A) Engine room crew restoring
normal provision of fuel to the D/G
sets B) Propulsion motors power reduction
systems
A) Other vessels in
proximity B) Inadequate communicatio
n between vessels crew
C) Bad weather
conditions 4 3 4 3 1 3 4x10
[image:11.842.201.640.164.295.2]-7
Some critical UCAs are provided in Table 7. As it can be observed, failures in the power reduction functions applied during hazardous conditions are considered as the most critical in both systems, as they constitute the last safety barrier before blackout in the systems. Another critical failure is the faulty tripping of the D/G sets by the firefighting system in an engine room, as in this case more than one D/G set can be disconnected from the network, leading to D/G sets overload conditions. In a power system with batteries, the batteries failures management is also considered as critical, as it can lead to fire with a reduced mitigation measures number. Hence, proper design and testing of these functions shall be ensured in the power system.
Table 7 Comparison between initial and system with batteries.
STPA results Initial design Batteries included
UCA number 215 300 (+40%)
Causal factors number
2247 3228 (+43%)
Estimated risk PLL [fatalities/year]
6.19 10-7 (SI=2) –6.19 10-6 (SI=3) 7.17 10-7 (SI=2) – 7.17 10-6 (SI=3) (+16%)
Estimated risk IR
[fatalities/year]
1.03 10-8 (SI=2) –1.03 10-7 (SI=3) 1.20 10-8 (SI=2) – 1.20 10-7 (SI=3)
Sample of most critical UCAs
- Firefighting system falsely activates quick closing fuel valve - Power Management System (PMS) disconnects consumers necessary for power generation functions, during overload conditions
- PMS falsely reduces the propulsion motors and bow thrusters speed (and hence load) - PMS trying to disconnect the already disconnected heavy consumers, hence not allowing the implementation of power reduction function on propulsion motors and thrusters.
- PMS failing to reduce thrusters load
- Battery management system not disconnecting the batteries from the network during electrical fault
- Battery management system not increasing the cooling during electrical fault conditions.
- Firefighting system falsely activates quick closing fuel valve
- PMS falsely reduces the propulsion motors and the bow thrusters speed (and hence load)
- PMS trying to disconnect the
already disconnected heavy consumers, hence not allowing the implementation of power reduction function on propulsion motors and the thrusters.
Table 8 Distribution of risks for initial and system with batteries.
Controller Initial PLL Hybrid PLL
AVR 4.80E-07 4.80E-07
BMS 0.00E+00 1.90E-06
Bus-tie controller 1.10E-07 1.10E-07
ECU 7 controller 4.53E-07 3.41E-07
EIM controller 3.57E-07 1.30E-07
Firefighting controller 1.08E-06 1.08E-06
GCU 1.08E-06 9.67E-07
PMS 2.62E-06 2.15E-06
Sea Water Cooling Pump controller 1.60E-08 1.42E-08
Thermostat 1.60E-09 1.42E-09
[image:12.595.60.550.575.762.2]As it can be observed from the results, the method allowed a rough estimation of the risk metrics for different hazardous scenarios, the overall risk for the system and comparison of risk for different systems. It was also possible to estimate the risk for different hazards and controllers. Furthermore, the most critical controllers and scenarios in each system were highlighted. However the estimated risk was not for the whole ship but for a specific system which complicated the comparison with IMO acceptable values. In additions for the system risk estimation, some failure driven scenarios have not been included. Further guidance on how to estimate the UCA consequences and inadvertent environmental factors probability would be also beneficial for this approach. Last, but not least there are several numerical approximations in the methods.
[image:13.595.62.545.66.289.2]H-1-1 48% H-1-2 1% H-1-3 32% H-1-4 11% H-1-5 0% H-1-6 6% H-2 1% H-3 1% H-4 0% H-5 0% H-1-1 23% H-1-2 0% H-1-3 28% H-1-4 10% H-1-5 7% H-1-6 5% H-2 1% H-3 14% H-4 2% H-5 10%
Figure 6 Distribution of estimated risk per hazards a) for initial power system b) for power system with batteries.
a) b)
H-1-1 24% H-1-2 1% H-1-3 38% H-1-4 34% H-1-5 0% H-1-6 1% H-2 2% H-3 0% H-4 0% H-5 0% H-1-1 21% H-1-2 0% H-1-3 29% H-1-4 25% H-1-5 7% H-1-6 1% H-2 2% H-3 2% H-4 2% H-5 11%
Figure 7 Distribution of identified UCAs per hazard a) for the initial system b) for the system with batteries.
[image:13.595.61.545.337.558.2]5
CONCLUSIONS
In this study, a new approach for estimating risk metrics in a system based on the STPA has been presented. The proposed approach was applied for comparison of Direct Current power system with Direct Current power system with batteries on an SOV vessel.
The main findings of this study can be summarised as follows:
The new method allowed risk metrics estimation and comparison for different systems as well as ranking of different scenarios.
The estimated risk for the failures in control systems, for both systems, is in tolerable regions, according to criteria set by the method.
The risk, in the power system with batteries may slightly increase due to the increase in the number of scenarios leading to fire
The risk due to D/G sets overload reduces in system with batteries as batteries act as an additional barrier to the propulsion loss hazard.
Comparing the number of hazardous scenarios for two systems can lead to wrong conclusions. Still the hazardous scenarios number can be used for comparison of systems complexity. The new approach can be used as basis for development of a method for safety comparison
between cyber-physical systems.
Whilst the applied methodology was useful for identifying the critical UCAs and comparing risk metrics failures for different systems, still it can be considered as a premature. The methodology could be enhanced by incorporating uncertainty analysis or by integrating it with other methods. The approach could also be enhanced by incorporating multiple experts ranking. However, all these constitute suggestions for future research.
ACKNOWLEDGEMENTS
The work described in this paper was produced in research project NEXUS†. The project has received funding from the European Union's Horizon 2020 research and innovation programme under agreement No 774519. Kongsberg Maritime CM AS is kindly acknowledged for provision of the relevant system information. The authors greatly acknowledge the funding from DNV GL AS and RCCL for the MSRC establishment and operation. The opinions expressed herein are those of the authors and should not be construed to reflect the views of EU, DNV GL AS and RCCL.
REFERENCES
Aven, T. (2016). Risk assessment and risk management: Review of recent advances on their
foundation.
European Journal of Operational Research, 253
(1), 1-13. Retrieved from
http://www.sciencedirect.com/science/article/pii/S0377221715011479
https://ac.els-cdn.com/S0377221715011479/1-s2.0-S0377221715011479-main.pdf?_tid=2806d80e-
082b-11e8-b387-00000aacb35d&acdnat=1517584388_3d54b30e235ab5523e73a989bd786ac4
.
doi:
http://dx.doi.org/10.1016/j.ejor.2015.12.023
Becker, C., & Van Eikema Hommes, Q. (2014).
Transportation systems safety hazard analysis tool
(SafetyHAT) user guide (version 1.0)
. Retrieved from
Blandine, A. (2013).
System theoretic hazard analysis applied to the risk review of complex
systems: an example from the medical device industry.
(Doctor of Philosophy),
Massachusetts Institute of Technology, Cambridge, MA, USA Retrieved from
https://dspace.mit.edu/handle/1721.1/79424
(849655099)
Bolbot, V., Theotokatos, G., Boulougouris, E., & Vassalos, D. (2019).
Comparison of
diesel-electric with hybrid-diesel-electric propulsion system safety using System-Theoretic Process
Analysis
. Paper presented at the Propulsion and Power Alternatives, London, United
Kingdom.
Bolbot, V., Theotokatos, G., Bujorianu, L. M., Boulougouris, E., & Vassalos, D. (2019).
Vulnerabilities and safety assurance methods in Cyber-Physical Systems: A comprehensive
review.
Reliability Engineering & System Safety, 182
, 179-193. Retrieved from
http://www.sciencedirect.com/science/article/pii/S0951832018302709
.
doi:
https://doi.org/10.1016/j.ress.2018.09.004
Bolbot, V., Theotokatos, G., & Vassalos, D. (2018).
Using system-theoretic process analysis and
event tree analysis for creation of a fault tree of blackout in the Diesel-Electric Propulsion
system of a cruise ship
. Paper presented at the International Marine Design Conference XIII,
Helsinki, Finland.
Brandsaeter, A., Valoen, L. O., Mollestad, E., & Haugom, G. P. (2015). In focus – the future is
hybrid.
DNV GL
. Retrieved from
www.dnvgl.com/maritime/advisory/battery-hybrid-ship-service.html
BSI. (2004). Functional safety - Safety instrumented systems for the process industry sector. In
Part
3: Guidance for determination of the required safety integrity levels
(Vol. IEC-61511).
Dawson, L. A., Muna, A. B., Wheeler, T. A., Turner, P. L., Wyss, G. D., & Gibson, M. E. (2015).
Assessment of the Utility and Efficacy of Hazard Analysis Methods for the Prioritization of
Critical Digital Assets for Nuclear Power Cyber Security
. Retrieved from
https://www.osti.gov/servlets/purl/1252915
DNVGL. (2015). Dynamic positioning vessel design philosophy guidelines. Recommended practice
(DNVGL-RP-E306). In.
EC. (2019). NEXUS - Towards Game-changer Service Operation Vessels for Offshore Windfarms.
Retrieved from
https://ec.europa.eu/inea/en/horizon-2020/projects/h2020-transport/blue-growth/nexus
Geertsma, R. D., Negenborn, R. R., Visser, K., & Hopman, J. J. (2017). Design and control of
hybrid power and propulsion systems for smart ships: A review of developments.
Applied
Energy, 194
, 30-54. Retrieved from
http://www.sciencedirect.com/science/article/pii/S0306261917301940
https://ac.els-cdn.com/S0306261917301940/1-s2.0-S0306261917301940-main.pdf?_tid=c25a54a8-
082b-11e8-8fb4-00000aab0f26&acdnat=1517584647_0166d0b4d7d583733c6775031f16cdae
.
doi:
http://doi.org/10.1016/j.apenergy.2017.02.060
Goerlandt, F., Khakzad, N., & Reniers, G. (2016). Validity and validation of safety-related
quantitative risk analysis: A review.
Safety Science, 99
(November), 127-139. Retrieved
from
http://www.sciencedirect.com/science/article/pii/S0925753516301795
https://ac.els-cdn.com/S0925753516301795/1-s2.0-S0925753516301795-main.pdf?_tid=c7347efe-
082b-11e8-981d-00000aacb35e&acdnat=1517584655_29fa2fde71b875e9cbee7dbeadd193b4
.
doi:
http://dx.doi.org/10.1016/j.ssci.2016.08.023
Hamann, R., Papanikolaou, A., Eliopoulou, E., & Golyshev, P. (2013). Assessment of safety
performance of container ships.
Proceedings of the IDFS
, 18-26.
Hill, D. M., Agarwal, A., & Gully, B. (2015). A review of engineering and safety considerations for
hybrid power (Lithium-Ion) systems in offshore applications.
Oil and Gas facilities, June
2015
, 68-77.
IMCA. (2015). International Guidelines for The Safe Operation of Dynamically Positioned
Offshore Supply Vessels (182 MSF Rev. 2). In.
IMO. (2008).
Formal Safety Assessment - Cruise ships
. Retrieved from
International Maritime Organisation. (2013).
Revised guidelines for formal safety assessment (FSA)
for use in the IMO rule-making process
. London Retrieved from
Jeong, B., Oguz, E., Wang, H., & Zhou, P. (2018). Multi-criteria decision-making for marine
propulsion: Hybrid, diesel electric and diesel mechanical systems from
cost-environment-risk perspectives.
Applied Energy, 230
, 1065-1081. Retrieved from
http://www.sciencedirect.com/science/article/pii/S0306261918313850
.
doi:
https://doi.org/10.1016/j.apenergy.2018.09.074
Johansen, I., & Rausand, M. (2012).
Risk metrics: Interpretation and choice.
Paper presented at the
Industrial Engineering and Engineering Management (IEEM), 2012 IEEE International
Conference on.
Leveson, N. (2011).
Engineering a safer world: Systems thinking applied to safety
: MIT press.
Leveson, N., & Thomas, J. (2018). STPA Handbook. In.
Leveson, N. G. (2011).
Engineering a safer world: Systems thinking applied to safety
. London,
England: The MIT press.
Organization, I. M. (2014).
SOLAS: consolidated text of the International Convention of Safety of
Life at Sea, 1974, as amended
(6th consolidated edition ed.): International Maritime
Organization.
Puisa, R., Lin, L., Bolbot, V., & Vassalos, D. (2018). Unravelling causal factors of maritime
incidents and accidents.
Safety Science, 110
, 124-141. Retrieved from
http://www.sciencedirect.com/science/article/pii/S0925753518304545
.
doi:
https://doi.org/10.1016/j.ssci.2018.08.001
Räsänen, J.-E. (2017).
Current and future scale limitation for alternative marine power and
propulsion solutions
. Paper presented at the Power & Propulsion Alternatives for Ships,
Rotterdam, Netherlands.
Rokseth, B., Utne, I. B., & Vinnem, J. E. (2017). A systems approach to risk analysis of maritime
operations.
Proceedings of the Institution of Mechanical Engineers, Part O: Journal of Risk
and Reliability, 231
(1), 53-68. Retrieved from
http://journals.sagepub.com/doi/abs/10.1177/1748006X16682606
http://journals.sagepub.com/doi/pdf/10.1177/1748006X16682606
.
doi:doi:10.1177/1748006X16682606
Sulaman, S. M., Beer, A., Felderer, M., & Höst, M. (2017). Comparison of the FMEA and STPA
safety analysis methods–a case study.
Software Quality Journal
, 1-39.
Thomas, J. (2013).
Extending and automating a systems-theoretic hazard analysis for requirements
generation and analysis.
Massachusetts Institute of Technology,
United Kingdom Protection & Indemnity Club. (2015).
Risk Focus: Loss of power
. Retrieved from
Vassalos, D., Atzampos, G., Paterson, D., Cichowicz, J., Bertheussen Karolius, K., Boulougouris,
E., & Konovessis, D. (2019). Intact stability of passenger ships: safety issue or design
concern? Neither!
Vinnem, J.-E. (2014).
Offshore Risk Assessment vol 1
: Springer.
ABRREVIATIONS LIST
AVR Automatic Voltage Regulator
BMS Battery Management System
BTU Bus Tie Unit
D/G Diesel Generator
DC Direct Current
FMEA Failure Modes and Effects Analysis
IMO International Maritime Organisation
SOV Service Operation Vessels
STPA System-Theoretic Process Analysis
PMS Power Management System
PLL Potential Loss of Life