Abstract – Characterisation of a corona-stabilised switch
in the single-shot regime, including triggering range, delay times and jitter is reported, over the pressure range 0-3 bar gauge, as a continuation of work from similar characterisation with this switch filled with SF6 with
different gap spacings. When filled with mixtures of HFO-1234ze and N2, the breakdown voltage can be
increased by up to ~306% and ~191% under negative and positive polarity, respectively, of that using 100% N2. These
results were achieved with gas mixtures consisting of 80% N2 and 20% HFO-1234ze, by pressure. The maximum
negative polarity triggering range was 13.6 kV, comparable to that achieved previously using SF6. The measured delay
time and calculated jitter was generally found to increase with increasing pressure, and with increasing percentage (from 5% to 20%) of HFO-1234ze in the gas mixtures.
Von Laue statistical analysis of time-to-breakdown data showed that both the formative time and statistical time increased with increasing pressure, and with increasing percentage of HFO-1234ze in the gas mixtures. The formative time under negative polarity was significantly longer than that for positive polarity.
The results indicate that HFO-1234ze may be considered as a suitable candidate to replace SF6 for switching
applications, although there are some operational observations that require further investigation.
Index terms – Corona-stabilised switches, dielectric breakdown, trigger threshold, delay time, jitter, HFO-1234ze
The authors are with the Department of Electronic and Electrical Engineering, University of Strathclyde, Glasgow, G1 1XW, UK. (e-mail: [email protected]; [email protected]; scott. [email protected]; [email protected]; [email protected]; [email protected]
I. INTRODUCTION
LASMA closing switches (PCS) continue to be critical components within sub-systems of pulsed power machines, characterised by a relatively long charging time of the order of milliseconds to seconds, to be delivered to the load in the form of a high-power pulse, with typical duration in the range of nanoseconds to microseconds. The governing factor that limits the maximum achievable pulse repetition frequency (PRF) of a PCS under repetitive operation is premature breakdown. This results from the neutral gas density not having enough time to recover to its pre-breakdown state, prior to the arrival of the next trigger pulse. This disrupts the switch closure process when the applied PRF is high, causing the switch to close at lower voltages, when the DC charging voltage applied has not yet recovered to its pre-breakdown level. This limiting factor can be overcome by the deployment of a corona-stabilised switch (CSS) [1],[2],[3],[4].
A DC high voltage is applied to an electrode with a sharp edge within the sealed switching system, upon which, the non-uniform electrical field establishes a corona discharge, creating an ionization region. The electrical field strength at this region is low enough that breakdown will not occur, until triggered by an impulsive triggering voltage [5]. As the DC voltage applied to the high-voltage (HV) electrode rises again following breakdown, the electrical field strength at the electrode remains at the same value, corresponding to the corona onset voltage, while the field strength increases elsewhere. This phenomenon is explained by the Kapstov hypothesis, which states that a shielding of the anode caused by corona discharge at corona onset voltage results in the electric field at this point becoming clamped [6]. The space charge formed through this process de-couples the HV electrode from the air gap [7],[8],[9]. This process allows the gas density within this electrode gap time to recover to its previous density, prior to subsequent switch closure [10],[11],[12].
The use of sulphur hexafluoride (SF6) is common with this technology, due to its high dielectric strength, strong insulating properties, and non-flammability [10], [13], [14]. Although, due to the high global warming potential (GWP) of SF6, at a
Characterisation and Statistical Analysis of
Breakdown Data for a Corona-Stabilised Switch
in Environmentally-Friendly Gas Mixtures
R. W. Macpherson,
Graduate Student Member IEEE
, M. P. Wilson,
Member, IEEE
, S. J. MacGregor,
Senior Member, IEEE
, I. V. Timoshkin,
Senior Member, IEEE
, M. J. Given,
Senior Member, IEEE
and T. Wang
value of 23000 (in a 100-year time horizon) [15], alternative gases are under consideration. This paper reports on the characterisation of a corona-stabilised switch in environmentally-friendly alternative gas mixtures to SF6, consisting of different ratios of 1,3,3,3-tetraflouropropene (known as HFO-1234ze), with N2 as a buffer gas. The self-breakdown voltages, trigger threshold voltages and delay times were experimentally determined, and the jitter calculated, to allow conclusions on relative switching performance to be drawn [10], [14].
The hydrofluoroolefin gas 1,3,3,3-tetraflouropropene (HFO-1234ze) is, potentially, an environmentally-friendly alternative to SF6, as it has a much lower GWP, at a value of 6 in a 100-year time horizon, and an ozone depletion potential of 0 [16], [17]. The gas is also known to be electronegative, so has the attributes to be used as a switching medium [18]. As HFO-1234ze is classified as ‘mildly flammable’ when mixed with air, suitable gas handling precautions must be taken. Therefore, the gas was mixed with high percentages of a buffer gas (N2), of the order of ≥80%. Within this paper, a CSS was characterised and tested, firstly using 100% N2 to provide baseline operational data, and then with various HFO-1234ze/N2 mixtures, to investigate whether such gas mixtures can be seen as an alternative solution to SF6. The gas mixtures were tested with both negative and positive polarity at various pressures to determine the breakdown characteristics, trigger threshold voltages, delay time and jitter over a range of pressures.
II. EXPERIMENTAL ARRANGEMENT
A. Practical CSS system
The CSS used (see Figure 1) consists of a cylindrical body made from brass, with a diameter of 102 mm and a length of 100 mm. The internal disc electrodes are 2 mm in thickness, bevelled to ~30° [14], giving a sharp edge for the establishment of corona discharges. The distance between the HV electrode and the brass body was fixed at 5 mm (Dh). The gap between the earth electrode and the brass body was fixed at 3 mm (Dg). This particular geometry was a continuation of previous research using this type of corona-stabilised switch [4],[19],[20], with the inter-electrode gaps optimised for the voltages and gas types used herein.
A schematic diagram of the laboratory setup is shown in Figure 2. A 100 kV, 2.5 mA, the Glassman DC supply was set to produce a negative or positive polarity output, depending upon the regime being tested. This was connected to a 1 MΩ charging resistor. As well as enabling high repetition rate applications, the CSS has also been used as the switching element in pulsed electric field (PEF) experiments. A 40 nF energy-storage capacitor and a 50 Ω resistive load were included in the test circuit, to replicate the capacitance of the pulse-forming network (PFN) of a laboratory-scale PEF generator and the typical impedance of the associated test cell, respectively [19].
[image:2.612.313.558.51.400.2][image:2.612.317.565.459.610.2]
Fig. 1. A schematic diagram of the CSS used during testing showing materials used as well as connections, inputs and gap and electrode angle information.
Fig. 2. CSS circuit schematic of the laboratory set-up. VP1 and VP2 represent voltage probes and CP represents current probe, which have been described in II-A[19].
~32 kV, the rise time was 80 µs and the full width at half maximum (FWHM) pulse width was 128 µs. The trigger pulse voltage remained constant throughout the tests, with the applied DC voltage varied.
Fig. 3. Positive 32 kV, 80 μs rise time, 128 μs FWHM trigger pulse from
Samtech Ltd TG-01[19].
Within the switching system, the application of the trigger pulse voltage initiates the breakdown of the gas between the switch body and the HV electrode, represented by Dh in Figure 1. This results in subsequent breakdown of the gas in the gap between the body of the switch and the ground electrode, Dg, which ultimately closes the switch. Delay-time measurements were made by monitoring the voltage collapse across the switch with a 1000:1 North Star PVM-5 HV probe (80 MHz nominal bandwidth) (VP1). Another North Star PVM-5 voltage probe was also used to monitor the trigger pulse voltage waveform (VP2). Monitoring of the load current with a Samtech Ltd. DE(CP)-01 current shunt, with a sensitivity of ~14 V/kA, allowed for conformation of switch closure. The position of all probes can be seen in Figure 2.
Typical voltage and current waveforms and the times recorded during the triggered breakdown event (positively stressed switch triggered by a negative trigger pulse) are shown in Figure 4. The delay time was measured as the time between the commencement of the trigger pulse and the specific region where the conduction of the switch is established [19]. The waveforms in Figure 4 show two different breakdown events with two characteristic times, t1 and t2: t1 represents the time
taken for the first gap (Dh) to close, and t2 represents the
additional delay time between the closure of Dh and the closure of Dg, ultimately closing the switch. This behaviour is reflected in Figure 4, where the trigger pulse voltage (2) swings from negative towards the positive applied DC voltage after time t1,
showing that the gap Dh has closed. After the additional time
t2, current flows through the load (3), and the applied DC
voltage collapses (1) which can be seen in the upper waveform in Figure 4, after the delay time shown on the middle waveform (2). In the tests, the overall delay time was recorded as t1 + t2.
Fig. 4. Typical voltage and current waveforms for a switch closure. Delay time = 24 μs, t1 = 20 μs, t2 = 4 μs. Upper (1): voltage collapse across switch as
measured by HV probe 1; middle (2): trigger pulse voltage waveform obtained by HV probe 2; and bottom (3): current waveform, for the verification of switch closure. Time base applies to all 3 waveforms (5 µs/div); waveforms 1 and 2 represented by the voltage magnitude (10 kV/div), and waveform 3 by the current magnitude (1/7 kA/div).
B. Gas handling procedure
During testing, two different gas mixing procedures, for mixtures consisting of 80% N2/20% HFO-1234ze, were employed. Mixing procedure 1 involved inserting the full percentage (by pressure) of the lighter gas N2 into the CSS first, before adding the full percentage by pressure of the heavier gas HFO-1234ze, and leaving the gases to mix for 5 minutes prior to testing. Following mixing procedure 2, the chamber was first filled to half of the desired N2 partial pressure. The full HFO-1234ze component of the mixture was then added; before the remaining N2 was added. The gases were left to mix for 5 minutes before testing took place. Mixing procedure 2 resulted in higher self-breakdown voltage levels compared to mixing procedure 1.
[image:3.612.52.294.109.318.2]by adding each individual element sequentially creates the largest split for the blending process to complete. Whereas, following mixing procedure 2, the addition of the heavier element between partial pressures of the other gas in the mixture creates a greater turbulence within the switch during the mixing process. This turbulence speeds up the mixing process, resulting in a settled blend of the gases being formed more quickly [21], [22]. As the blend is formed more quickly, the electronegative element which has been added (HFO-1234ze) distributes itself evenly throughout the switch faster, leading to a higher breakdown strength.
Fig. 5. Positive and negative polarity self-breakdown voltages for two different gas mixing techniques for 80% N2/20% HFO-1234ze, from 0-3 bar
gauge. “Mixture 1” is mixing procedure 1 and “Mixture 2” is mixing procedure 2, as described in the main text.
III. EXPERIMENTAL RESULTS
A.Self-breakdown and triggering threshold voltages of various mixtures of HFO-1234ze
In this section the self-breakdown and triggering threshold voltages were measured for each of the gas mixtures. This was conducted between 0-3 bar gauge, in iterations of 0.5 bar, with the main aim of establishing the triggering range of each respective gas mixture at each pressure.
The self-breakdown and triggering threshold results have been separated by polarity. Self-breakdown voltages were determined by monitoring the voltage across the switch, increasing the applied DC stress until the voltage collapsed. The trigger threshold voltage was determined by lowering the applied DC voltage in 1 kV increments from the self-breakdown voltage, and applying a trigger pulse 5 times. If the switch closed upon application of all 5 trigger pulses, the applied DC voltage was again lowered by 1 kV, until the switch failed to close for any 1 of the 5 triggering events. The DC voltage was then increased by 0.2 kV until the switch again closed for all 5 applied trigger pulses, and this voltage was recorded as the trigger threshold voltage.
Fig. 6.Negative-polarity self-breakdown (SB) and trigger threshold voltage (TV) for 100% N2; 95% N2 / 5% HFO-1234ze; 90% N2 / 10% HFO1234ze; and
80% N2 / 20% HFO-1234ze, from 0-3 bar gauge.
The self-breakdown and trigger threshold voltages measured under negative polarity DC voltage, with a positive trigger pulse are shown in Figure 6. The self-breakdown voltages with respect to 100% N2 rose by ~280%, ~290% and ~306% at 5%, 10% and 20% concentration (by pressure) of HFO-1234ze, respectively. Corresponding triggering threshold voltages of 72%, 69% and 72% of the self-breakdown voltage were found for these mixtures.
Fig. 7. Positive polarity self-breakdown (SB) and trigger threshold voltage (TV) of 100% N2; 95% N2 / 5% HFO-1234ze; 90% N2 / 10% HFO1234ze; and
80% N2 / 20% HFO-1234ze from 0-3 bar gauge.
In Figure 7, the self-breakdown and trigger threshold voltages for positive-polarity DC voltage, with a negative trigger pulse are shown. In this regime, the self-breakdown voltage increased to ~106%, ~171% and ~191% of that for 100% N2 at 5%, 10%
0 0.5 1 1.5 2 2.5 3
0 5 10 15 20 25 30 35
Pressure (Bar)
V
o
lt
a
g
e
(
k
V
)
SB N2 TV N2 SB 5% TV 5% SB 10% TV 10% SB 20% TV 20%
0 0.5 1 1.5 2 2.5 3
5 10 15 20 25 30 35 40
Pressure (Bar)
V
o
lt
a
g
e
(
k
V
)
[image:4.612.51.298.180.377.2] [image:4.612.315.563.453.642.2]and 20% concentration of HFO-1234ze, respectively. Trigger threshold voltages of 58.4%, 53.4% and 59.6% of the corresponding self-breakdown voltages were found for these mixtures. For consistency in the tests of delay time and jitter for all tests under both positive and negative polarity, the applied DC voltage was set to 75% of the corresponding self-breakdown voltage.
B. Delay time to breakdown and jitter
In this section, the delay time was measured between 0-3 bar gauge, in increments of 0.5 bar. This was conducted by measuring the time from the initiation of the trigger pulse to the breakdown of the switch, as shown in Figure 4. Each of the delay time data points is an average of 25 individual measurements at each pressure. The jitter at each pressure was then calculated as the standard deviation of each set of 25 delay time measurements.
The data for the gas mixtures in Table I were recorded with positive trigger pulse and a negative-polarity DC voltage corresponding to 75% of the self-breakdown voltage applied to the HV electrode. For 100% N2, however, the applied DC voltage was 98% of the self-breakdown level, as this was the lowest voltage at which the switch would close reliably at each pressure iteration. This is indicative of the very narrow triggering range in 100% N2 for the geometry and conditions used, as can be seen in Figure 6.
[image:5.612.318.561.64.257.2]Figure 8 shows the delay time data from 0-3 bar gauge for the gas mixture consisting of 80% N2 / 20% HFO-1234ze. This data corresponds to the last row of Table I.
TABLE I
Negative-polarity minimum and maximum delay time and jitter of gas/gas mixtures.
Fig. 8. Negative-polarity, trigger delay time and jitter for 80% N2 / 20%
HFO-1234ze at 75% self-breakdown voltage (SB), from 0-3 bar gauge with added linear function to show linear dependency.
[image:5.612.47.306.453.617.2]For positive-polarity applied DC voltage with a negative polarity trigger pulse, the data for the gas mixtures in Table II were recorded with a DC voltage corresponding to 75% of the self-breakdown voltage applied to the HV electrode. This also applied for 100% N2; made possible by the wider triggering range, evident from Figure 7. Figure 9 shows the delay time data from 0-3 bar gauge for the gas mixture consisting of 80% N2 / 20% HFO-1234ze. This data corresponds to the last row of Table II.
TABLE II
Positive polarity minimum and maximum delay time and jitter of gas/gas mixtures
Gas Mixture Min Delay Time/ Jitter, (s)
Max Delay Time/Jitter, (s)
100% N2 at 98% SB
voltage
10.4±0 40.4±2.2
95% N2 / 5%
HFO-1234ze at 75% SB voltage
15.3±0.2 66.8±6.4
90% N2 / 10%
HFO-1234ze at 75% SB voltage
15.9±1.7 58.9±3.4
80% N2 / 20%
HFO-1234ze at 75% SB voltage
15.7±0.4 69.7±4.9
Gas Mixture Min Delay Time/ Jitter
(μs) Time/Jitter (μs) Max Delay
100% N2 at 75% SB
voltage
8.1±1.3 21.1±6.8
95% N2, 5%
HFO-1234ze at 75% SB voltage
10.7±2.1 26.2±1.9
90% N2, 10%
HFO-1234ze at 75% SB voltage
13.3±1.6 30.4±3.3
80% N2, 20%
HFO-1234ze at 75% SB voltage
[image:5.612.179.554.459.625.2]Fig. 9. Positive polarity, trigger delay time and jitter for 80% N2 / 20%
HFO-1234ze at 75% self-breakdown voltage (SB), from 0-3 bar gauge.
Overall, the mean total delay time increases as the pressure within the switch chamber is increased, for each gas mixture. An increase in delay time is also apparent as the percentage of HFO-1234ze in the mixture is increased. The calculated jitter varied over testing, although under certain conditions, for example in Figure 8, a clear increase in jitter was observed as the pressure increased. A clear increase in delay time with pressure was seen for negative-polarity applied DC voltage (Figure 8). Due to the wave-shape of the applied trigger pulse voltage, the delay times and jitter were found to be in the µs regime. The delay times and jitters could be decreased via the application of a faster trigger pulse voltage waveform, which can be seen in [11].
C. Post-test switch condition observation
After each set of tests was completed, a visual inspection of the switch chamber was conducted. Following sets of tests with the gas mixtures, a build-up of carbon was found to have accumulated on both electrodes and the body of the switch over testing. For prolonged periods of repetitive operation, such a build-up of carbon within the switching system could result in surface flashover, and failure of the switch. Further investigation of methods to mitigate against this carbon build-up is required.
IV. VON LAUE STATISTICAL ANALYSIS
To further understand the switching characteristics, von Laue analysis was conducted in order to separate the overall delay time into its formative and statistical components. This was conducted on the delay time data discussed in section III-B. The mean statistical delay time is associated with the initiation of the discharge, and the formative delay time corresponds to the progression of the discharge across the gap [3], [23].
The logarithm of the ratio of the number of breakdown events with the total time lag longer than a given time, Nt, to the total
number of breakdowns, N0, is expressed as:
− ln (𝑁𝑡 𝑁0
) = 𝑡 − 𝑡𝑓 𝑡𝑠𝑡
(1)
where, t is the the total breakdown time, tf is the formative delay
time and tst is the average statistical delay time.
An example of this von Laue analysis is shown in Figure 10, for delay time data gathered for a 10% HFO-1234ze/90% N2 mixture, at 1 bar gauge. The time which is measured up until the boxed off section is considered the formative time measurement and the boxed area is the statistical time measurement [3], [23].
Two groups are typically seen from von Laue analysis, which can also clearly be seen in Figure 10, due to two superimposed statistical processes, one following a normal distribution, and the other following an exponential distribution [24]. The normal distribution’s shallower slope corresponds to faster delay times and is associated with the formative delay time. While the exponential distribution’s steeper slope corresponds to slower delay times and is associated with the statistical delay time. In Figure 10, the change from formative to statistical distribution can be seen at ~21 µs. The points with a measured delay time >21 µs have been fitted with a straight line according to equation (1). The exponential distribution within Figure 10 satisfies t = tf + tst more so than the normal distribution.
Therefore, this allows for the determination of formative and statistical delay times with respect to the exponential distribution to be measured [24]. For the plot in Figure 10, the formative time was found to be ~21.8 µs with a mean statistical delay time of ~1.4 µs.
Fig.10. von Laue method showing formative and statistical delay times on switch delay time operation
[image:6.612.319.558.441.633.2]Fig. 11. Formative delay times extracted from von Laue analysis for 100% N2
[image:7.612.51.297.294.504.2]and 3 mixtures of N2/HFO-1234ze from 0-3 bar gauge.
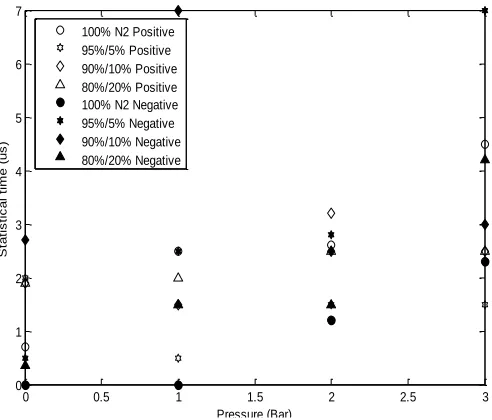
Fig. 12. Statistical delay times extracted from von Laue analysis for 100% N2
and 3 mixtures of N2/HFO-1234ze from 0-3 bar gauge.
From the data in Figures 11 and 12, an increase in both formative and statistical delay time is apparent with increasing pressure. The formative time also shows an increasing trend as the percentage of HFO-1234ze increases. There is also a clear increase in formative time for negative polarity, in accordance with the longer overall delay times measured for negative polarity in section III. While the mean statistical times show a slight increase over the tested pressure range, neither HFO-1234ze concentration nor polarity exhibit a clearly discernible effect.
V. DISCUSSION & CONCLUSIONS
In this study, the single-shot switching performance of a corona-stabilised switch (CSS) was characterised with different, environmentally-friendly, gas mixtures acting as the switching medium. The results show that, when the CSS is
filled with mixtures of HFO-1234ze and N2 as a buffer gas, the self-breakdown voltages increased by up to ~306% for negative polarity, and by up to ~191% for positive polarity, compared to those for 100% N2, for the specific geometry studied here.
Over the range of pressures tested, the minimum and maximum trigger threshold voltages for the different mixtures, relative to the corresponding self-breakdown voltages, were 58%-72% for 5% HFO-1234ze/95% N2; 58%-69% for 10% 1234ze/90% N2; and 62%-72% for 20% HFO-1234ze/80% N2 for negative polarity, whereas positive polarity gave a triggering range in relation to the self-breakdown voltage of 40%-59% for 100% N2; 44.7%-58.4% for 5% HFO-1234ze; 46.6%-53.4% for 10% HFO-1234ze and 47.7%-59.6% for 20% HFO-1234ze. The minimum and maximum triggering ranges were not linearly dependent upon pressure. The delay time measurements were, therefore, conducted at 75% self-breakdown voltages, since at this level the switch could be reliably triggered over the full range of pressures. The delay time and jitter were generally found to increase with increasing pressure, and longer delay times were measured in negative polarity tests. The minimum delay times were consistently found to occur at 0 bar gauge throughout the testing, with the maximum delay times found at 3 bar gauge.
From previous work with a similar switch topology filled with SF6 under positive polarity (with 8 mm Dh and 5 mm Dg) [19], it was shown that 100% SF6 had a self-breakdown voltage of 40 kV at 0 bar (gauge), with a trigger threshold voltage of 21 kV, giving a triggering range of 19 kV. In the present work, the triggering ranges for mixtures including 5%, 10% and 20% HFO-1234ze (balance N2) at 0 bar (gauge) had triggering ranges of 4.4, 5.3 and 6.8 kV, respectively. It must be noted that different gap spacings were used in the present work and in [19]. From this data, however, the triggering range can be seen to increase as the percentage of HFO-1234ze increases. The delay time experienced in SF6 was found to be 28.9±2.9 µs at 80%-90% of the self-breakdown voltage in [19], whereas the HFO-1234ze mixtures showed delay times of 10.7±2.1 µs (5%), 13.3±1.6 µs (10%) and 15±1.8 µs (20%) at 75% of the self-breakdown voltage, respectively, in the present study.
The results show that, within this geometry, the delay time and jitter are linearly dependent upon pressure, as illustrated in Figure 8, where there is a clear upward trend in delay time and jitter over the range of pressures tested. The von Laue analysis follows this same trend, with the formative time increasing with increasing pressure, and with increasing percentage of HFO-1234ze in the mixture. The mean statistical delay time increased as the pressure increased, although the percentage of HFO-1234ze and polarity had no clear effect on the statistical delay time.
The triggering characteristics of the CSS are affected by the degree of electronegativity of the fill gas, and by the stabilising effect of the space charge produced by the corona discharges. It is known that the use of SF6 leads to long formative delay times at low pressures, [10], [25], [26], [27]. From Figures 11 and 12, it is clear that the overall delay time to breakdown for the gas mixtures tested here is mostly determined by the formative delay time at lower pressures. This phenomenon can account for the narrow triggering range seen at lower pressures in Figures 6 and 7, [10]. In order to increase the triggering range at lower pressures, the length of the gap Dg (see Figure 1)
0 0.5 1 1.5 2 2.5 3
0 1 2 3 4 5 6 7
Pressure (Bar)
S
ta
ti
s
ti
c
a
l
ti
m
e
(
u
s
)
100% N2 Positive 95%/5% Positive 90%/10% Positive 80%/20% Positive 100% N2 Negative 95%/5% Negative 90%/10% Negative 80%/20% Negative
0 0.5 1 1.5 2 2.5 3
0 10 20 30 40 50 60 70
Pressure (Bar)
F
o
rm
a
ti
v
e
t
im
e
(
u
s
)
within the switch can be increased, and a higher voltage trigger pulse applied. However, using this method can cause delayed triggered breakdown when operating at DC charging voltages close to the triggering threshold voltage [10]. The triggering range of the switch can also be increased via the application of a faster trigger pulse, within the ns regime [11].
As the trigger pulses deployed for the single-shot characterisation in this study can be considered as slow (dV/dt
~0.4 kV/µs), and a short (3 mm) Dg gap was used, this limits the achievable triggering range. These characteristics could be altered in future work by using a different Dg spacing, as well as a faster, higher-amplitude trigger pulse. This will result in a wider operating range for the switch as part of an overall pulsed power system. The length of the gap Dg was set at 3 mm here as a compromise, sacrificing a slightly wider trigger range with negative-polarity DC voltages, for a better performance with positive-polarity DC voltages.
The high dielectric strength of SF6 and HFO-1234ze is governed by the electronegativity of each of these gases, that is, their ability to attach free electrons. It has been found previously that the dielectric strength of HFO-1234ze is (0.8-0.95) times that of SF6, [28]. HFO-1234ze is known to be a highly electronegative gas [18]; when free electrons attach to neutral gas molecules, they are converted to heavy, low-mobility negative ions. These negative ions do not have the same capability as free electrons to cause further ionization, [29], [30]. Therefore, higher voltages must be applied to provide more free electrons before breakdown can occur. The buffer gas used here, N2, is an electropositive gas. With the addition of relatively low proportions (5%-20% here) of the electronegative HFO-1234ze, however, the breakdown voltage can be significantly increased, for both polarities. The effective ionisation coefficient of HFO-1234ze decreases with increasing pressure [31]. The decreasing effective ionisation coefficient reduces the probability of a free electron becoming available to initiate breakdown [29]. Therefore, increased breakdown strength is observed as the pressure increases.
The overall probability of a breakdown-initiating event is related to 1/tst, and is dependent upon two probabilities: the
probability of an initiatory electron appearing in the gap; and the probability of this electron successfully initiating a breakdown [29]. This second probability is proportional to the ionisation coefficient, leading to the increase in statistical time with pressure seen in Figure 12.
Overall, considering the switching performance exhibited by HFO-1234ze in this work, particularly the breakdown strength, it can be seen that there is a possibility of this gas becoming an alternative to SF6. Although, due to the practical observations detailed in section III-C, the problem of carbon build-up needs to be further investigated and resolved before this gas can be considered an alternative to SF6 for switching applications, especially when operating into the kHz regime. Further work to be conducted is characterisation of the switch under repetitive conditions, with shorter (ns) trigger pulses, and detailed comparison with previous data for operation in SF6 [1], [4], [5], [10], [11], [12].
REFERENCES
[1] F. A. Tuema, S. J. Macgregor, J. A. Harrower, J. M. Koutsoubis, O. Farish, “Corona-stabilisation for high repetition rate plasma closing switches” 1999 Eleventh International Symposium on High Voltage
Engineering, London, 1999, pp. 280-284 vol.3.
[2] J. A. Harrower, F. A. Tuema, S. J. Macgregor, “Critical volume effects on corona stabilised repetitive breakdown” Pulsed Power '99 (Digest No.
1999/030), IEE Symposium, 1999, pp. 30/1-30/4.
[3] M. P. Wilson, M. J. Given, I. V. Timoshkin, S. J. Macgregor, T. Wang, M. A. Sinclair, K. J. Thomas and J. M. Lehr, “The statistical and formative times for breakdown at a polymer-oil interface” 2012 IEEE International
Power Modulator and High Voltage Conference (IPMHVC), San Diego,
CA, 2012, pp. 43-46.
[4] A. Larsson, D. Yap, and J. Au, “Operating Conditions and Switching Delay Time of a Corona-Stabilized Switch During Repetitive Operation”
in IEEE Transactions on Plasma Science, vol. 41, no. 10, pp. 2605-2608,
Oct. 2013.
[5] M. J. Given, M. P. Wilson, I. V. Timoskin, S. J. Macgregor, T. Wang, J. M. Lehr, “The triggered behaviour of a controlled corona stabilsed cascade switch” [Journal]. 2012 IEEE International Power Modulator
and High Voltage Conference (IPMHVC), San Diego, CA, USA, 2012,
pp. 124-127.
[6] D. Cagnoni, F. Agostini, T. Christen, C. Falco, N. Parolini, V. Stevanovic, “Multiphysics simulation of corona discharge induced ionic wind” Journal of Applied Physics 114, 233301 (2013); doi: 10.1063/1.4843823 [7] I. V. Timoshkin, S. J. Macgregor, M. J. Given, J. R. Beveridge, J. M .Lehr, “Dynamic characteristics of corona discharges in point-plane electrode topologies influenced by space charge” 2008 IEEE International Power
Modulators and High-Voltage Conference, Las Vegas, NE, 2008, pp.
495-498
[8] J. R. Beveridge, S. J. Macgregor, I. V. Timoshkin, J. Lehr, “A corona-stabilised plama closing switch” 2008 IEEE International Power
Modulators and High-Voltage Conference, Las Vegas, NE, 2008, pp.
487-490.
[9] J. R. Beveridge, S. J. Macgregor, M. J. Given, I. V. Timoshkin and J. M. Lehr, “A corona-stabilised plasma closing switch” IEEE Transactions on
Dielectrics and Electrical Insulation, vol. 16, no. 4, pp. 948-955, August
2009.
[10] J. M. Koutsoubis, S. J. MacGregor. S. M. Turnbull, "Triggered switch performance in SF6, air and SF6/air mixture," in IEEE Transactions on
Plasma Science, vol. 27, no. 1, pp. 272-281, Feb 1999.
[11] M. P. Wilson, W. Boekhoven, I. V. Timoshkin, M. J. Given, S. J. Macgregor, T. Wang, J. M. Lehr, “Performance of a corona-stabilised switch activated by fast-rising trigger pulses” 2012 IEEE International
Power Modulator and High Voltage Conference (IPMHVC), San Diego,
CA, 2012, pp. 136-139.
[12] S. J. Macgregor, S. M. Turnbull, F. A. Tuema, O. Farish, “The application of corona-stabilised breakdown to repetitive switching” 96 IEE
Colloquium on Pulsed Power, London, 1996, pp. 21/1-21/3.
[13] S. J. MacGregor, G. A. Woolsey, D. B. Ogle, O. Farish, "The influence of electrode-flourine reactions on corona and glow discharges in SF6," in
IEEE Transactions on Plasma Science, vol. 14, no. 4, pp. 538-543, Aug.
1986.
[14] J. A. Harrower, S. J. MacGregor, F. A. Tuema, "Design considerations for corona-stabilsed repetitve switches," J. Phys. D: Appl Phys, vol. 32, pp. 790-797, (1999).
[15] U. n. f. c. o. c. change, "UNFCCC," UN, 2014. [Online]. Available: http://unfccc.int/ghg_data/items/3825.php. [Accessed 28 July 2017]. [16] L. Benussi, S. Bianco, M. Ferrini, L. Passamonti, D. Pierluigi, D. Piccolo,
A. Russo, G. Saviano, "A study of HFO-1234ze (1,3,3,3-Tetrafluoropropene) as an eco-friendly replacement in RPC detectors," arXiv:1505.01648 [physics.ins-det] INFN-REPORT-INFN-14-14-LNF. [17] Honeywell, "Honeywell HFO-1234ze Blowing Agent," Honeywell,
Amsterdam, 2008.
[18] M. Koch, C. Franck, "High Voltage Insulation Properties of HFO1234ze,"
IEEE Transactions on Dielectrics and Electrical Insulation, vol. 22, (no.
6), pp. 3260 - 3268, (December 2015)
[20] A. Larsson, D. Yap, and Y. W. Lim, “Time Jitter Study of a Corona-Stabilized Closing Switch” in IEEE Transactions on Plasma Science, vol. 40, no. 10, pp. 2646-2652, Oct. 2012.
[21] N.A. Downie, “Industrial gases” Filling procedure for mixtures Maran and co Guildford, UK, 2002. p145
[22] R. Young, G. James, B. Boston, “Compressible turbulent mixing”
University at Stony Brook, New York, USA July 1995. p129.
[23] M. J. Given, M. P. Wilson, I. V. Timoshkin, S. J. Macgregor, T. Wang, M. A. Sinclair, K. J. Thomas and J. M. Lehr, “Modifications to the von Laue statistical distribution of the times to breakdown at a polymer-oil interface,” IEEE Transactions on Dielectrics and Electrical Insulation, 2017 pp. 2115-2122
[24] M. G. Hogg, I. V. Timoshkin, M. J Given, M. P. Wilson, S. J. MacGregor, T. Wang, R. A. Fouracre, “Impulse Breakdown of Water with Different Conductivities” in IEEE Transactions on Dielectrics and Electrical
Insulation, vol. 19, no. 5, pp. 1559-1568, October 2012.
[25] S. J. MacGregor, “Electrical breakdown in SF6 and SF6/air mixtures,” Ph.D. dissertation, Univ. Strathclyde, Glasgow, U.K., 1986.
[26] P. Koukos, “Impulse electrical breakdown and time lags in SF6,” M.Phil. thesis, University of Strathclyde, Glasgow, U.K., 1988.
[27] P. Koukos, S. J. MacGregor, O. Farish, and N. Spyrou, “Electrical breakdown in SF6 under negative impulse voltage,” presented at the
6th Int. Symp. High Voltage Eng., New Orleans, LA, 1988, Paper 49.08.
[28] Beroual, Abderrahmane & Haddad, A. (2017). Recent Advances in the Quest for a New Insulation Gas with a Low Impact on the Environment to Replace Sulfur Hexafluoride (SF6) Gas in High-Voltage Power Network Applications. Energies. Energies 10, no. 8: 1216
[29] L. G. Christophorou and L. A. Pinnaduwage, “Basic physics of gaseous dielectrics” in IEEE Transactions on Electrical Insulation, vol. 25, no. 1, pp. 55-74, Feb 1990.
[30] Alisoy, H & Yesil, Ali & Koseoglu, Murat & Unal, Ibrahim. (2011). “An approach for unipolar corona discharge in N2/O2 gas mixture by considering townsend conditions”. Journal of Electrostatics - J ELECTROSTAT. 69. 284-290.
[31] Chachereau, A & Rabie, M & M Franck, C. (2016). “Electron swarm parameters of the hydrofluoroolefine HFO1234ze”. Plasma Sources Science and Technology. 25. 045005. 10.1088/0963-0252/25/4/045005.
Ruairidh W. Macpherson (GSM’ 17) was born in
Inverness, Scotland, in 1990. He received his B.Eng. (Hons.), from the University of Strathclyde in 2016 where he is currently pursuing his MPhil and Ph.D. degrees with the High Voltage Technologies Group, Department of Electronic and Electrical Engineering. Ruairidh is involved with work in corona-stabilised switches as well as surface flashover of solid insulators.
Mark P. Wilson (M’10) was born in Stranraer,
Scotland, in 1982. He received the B.Eng. (with honours), M.Phil., and Ph.D. degrees in electronic and electrical engineering from the University of Strathclyde, Glasgow, U.K., in 2004, 2007, and 2011, respectively. He is presently based in the High Voltage Technologies research group at the University of Strathclyde, where his research interests include interfacial surface flashover, nanodielectrics, and the practical applications of high power ultrasound, corona discharges, and pulsed electric fields. Mark is a member of the IEEE Nuclear and Plasma Sciences Society, from whom he received a Graduate Scholarship Award in 2011, the IEEE Dielectrics and Electrical Insulation Society, and the IET.
Scott J. MacGregor (M’95-SM’14) received the
B.Sc. and Ph.D. degrees from the University of Strathclyde, Glasgow, U.K., in 1982 and 1986, respectively. He became a Pulsed Power Research Fellow in 1986 and a Lecturer in pulsed-power technology in 1989. In 1994, he became a Senior Lecturer, with a promotion to Reader and Professor of High Voltage Engineering, in 1999 and 2001, respectively. In 2006 and 2010 he became Head of the Department of Electronic and Electrical Engineering and Executive Dean of the Faculty of Engineering, and has been the Vice-Principal of the University of Strathclyde since 2014. Professor MacGregor was the recipient of the 2013 IEEE Peter Haas Award, and he was appointed as an Associate Editor of the IEEE Transactions on Dielectrics and Electrical Insulation in 2015. His research interests include high-voltage pulse generation, high-frequency diagnostics, high-power repetitive switching, high-speed switching, electronic methods for food pasteurization and sterilization, generation of high-power ultrasound (HPU), plasma channel drilling, pulsed-plasma cleaning of pipes, and stimulation of oil wells with HPU.
Igor V. Timoshkin (M’07) received the degree in
physics from the Moscow State University (Russia) in 1992, and the Diploma and the Ph.D. degree from the Imperial College of Science, Technology and Medicine, (London, UK) in 2001. After graduation from MSU he worked as a Researcher at Moscow State Agro-Engineering University, and then at the Institute for High Temperatures of Russian Academy of Sciences before moving to ICSTM in 1997. He joined the Department of Electronic and Electrical Engineering of the University of Strathclyde (Glasgow, UK) in 2001 where he became a Senior Lecturer in 2011. His research interests include properties of solid and liquid dielectric materials, electronics of plasma discharges in condensed media, practical applications of electro-hydraulic and high-power ultrasound pulses, bio-dielectrics and effects of electromagnetic fields on biological objects.
Martin J. Given (M’99-SM’11) is currently a Senior
Lecturer in the Department of Electronic and Electrical Engineering at the University of Strathclyde. He received a degree in physics from the University of Sussex in 1981 and a PhD in electronic and electrical engineering from the University of Strathclyde in 1996. His research interests include, ageing processes and condition monitoring in solid and liquid insulation systems, high speed switching and pulse power applications.
Tao Wang received the B.Eng and M.Sc degrees from