Ground Truth for Layout Analysis Performance
Evaluation
†A. Antonacopoulos1, D. Karatzas2 and D. Bridson1
1 Pattern Recognition and Image Analysis (PRImA) Research Lab, School of Computing, Science and Engineering
University of Salford, Manchester, M5 4WT, United Kingdom http://www.primaresearch.org
2 School of Electronics and Computer Science
University of Southampton, Southampton, SO16 1BJ, United Kingdom http://www.ecs.soton.ac.uk/~dk3
Abstract. Over the past two decades a significant number of layout analysis (page segmentation and region classification) approaches have been proposed in the literature. Each approach has been devised for and/or evaluated using (usually small) application-specific datasets. While the need for objective performance evaluation of layout analysis algorithms is evident, there does not exist a suitable dataset with ground truth that reflects the realities of everyday documents (widely varying layouts, complex entities, colour, noise etc.). The most significant impediment is the creation of accurate and flexible (in representation) ground truth, a task that is costly and must be carefully designed. This paper discusses the issues related to the design, representation and creation of ground truth in the context of a realistic dataset developed by the authors. The effectiveness of the ground truth discussed in this paper has been successfully shown in its use for two international page segmentation competitions (ICDAR2003 and ICDAR2005).
1 Introduction
Layout analysis is a very important step in document analysis. Errors made at this stage will propagate in the subsequent OCR and document understanding stages and can adversely impact on the success of the application as a whole.
Over the past two decades a significant number of layout analysis (mostly page segmentation and region classification) approaches have been proposed in the literature. Each approach has been devised for and/or evaluated using relatively narrow-focused application-specific datasets, which more often than not do not reflect the real-world occurrence of documents. As a result, it is difficult to evaluate the practical value of each method and to make a direct comparison between the different approaches.
† This work was supported by GCHQ (UK Government Communications Headquarters) and the EPSRC (UK Engineering and Physical Sciences Research Council).
Whilst the need for objective performance evaluation of layout analysis algorithms is evident, there does not exist a suitable dataset with ground truth that reflects the realities of everyday documents (widely varying layouts, complex entities, colour, noise etc.). A number of layout analysis approaches in the literature have reported evaluation results based on the University of Washington dataset [1] which mostly contains (relatively stylised) technical article images, a large number of which are synthetic (created by the dataset authors using LaTeX and output as images). It is the view of the authors that such a database can be useful but does not reflect the complexities of the majority of widely available documents.
This lack of a representative and practical (in terms of use) dataset can be attributed mostly to the need to subtly balance wide-ranging issues involved in its design as well as to the effort required in its realisation.
While the design of the dataset architecture is of central importance in terms of its usefulness and usability, the crucial (and most influential) element is the design of the
ground truth. It should be mentioned, for completeness, that ground truth is defined as a representation of the agreed correct result of the ideal layout analysis method (i.e. the result of the method that, if existed, would put an end to the research problem). The ground truth forms the basis for all comparisons with the output of any layout analysis method to be evaluated.
A significant clarification must be made at this point between performance evaluation and benchmarking. The former involves in-depth analysis of results and is aimed at providing feedback to developers, the latter usually outputs a single value that is used to compare between approaches. Clearly, for in-depth performance evaluation, a more thorough specification and design is required for the dataset in general and for the ground truth in particular.
This paper presents and discusses the issues related to the design, representation and creation of ground truth in the context of the layout analysis performance evaluation dataset developed by the authors. In contrast to previous approaches (the most prominent of which is [1]), the proposed dataset is not only realistic in the selection of documents but it has significant flexibility in the description and use of ground truth. A more accurate region representation scheme is used in favour of using rectangles (unable to describe complex-shaped regions) but without sacrificing ease of use or performance. The additional information describing the physical and logical characteristics of regions ensures the applicability of the ground-truth to a wide range of evaluation scenarios and anticipated future needs (as evidenced by current developments).
2 Performance Evaluation Framework
One of the important issues to address and one of the advantages of the ground truth representation described in this paper is the flexibility of its use within different performance evaluation contexts. These can range from simple listings of regions missed/detected etc. to sophisticated evaluation of scenarios (e.g. the detection of headlines and separators) with configurable penalties etc.
A brief description of this wider perspective, in the form of the framework being developed by the authors, is given here to highlight the needs that ground truth has to fulfil within a wider, more-demanding application. The most important objective of the framework is to provide the (layout analysis) algorithm developer with an in-depth analysis of the performance of the method being evaluated. Detailed statistical information is given on the ability of a method in terms of correctly detected, merged, split, partially or wholly missed regions (along with combinations of these conditions as well as the incorrect detection of noise as valid regions) [2]. Goal-oriented
performance evaluation is enabled through the creation of scenarios (application of sets of weights on the detected errors). An example of this can be when an OCR developer is interested in not missing any text regions and in not merging text regions across columns etc. (to preserve the reading order), while they may not assign high value to the accurate detection of graphic regions.
At a higher semantic level, a scenario may involve the evaluation of logical as well as physical layout characteristics. For instance, in an indexing application the developer may be interested in correctly locating figure captions (for indexing photographs), or article titles and dates (for indexing newspaper articles).
Moreover, the framework is able to summarise the performance of a method by providing scores (based on scenarios) at different levels as required. For instance, a developer who needs to assess the resulting improvement of a newly introduced modification may customise the framework to provide them with both an overall scenario evaluation score but with detailed scores for the tasks that are most affected by the given modification.
It is therefore important that the ground truth must hold information that supports these evaluation tasks.
3 Dataset
In its most crude form, a performance evaluation dataset comprises a set of images and associated ground truth (for each image). The dataset on which layout analysis methods are evaluated has an obvious bearing on the relevance of the evaluation results. This section briefly presents the dataset developed by the authors with two key objectives in mind. First, to give the reader a broader understanding of the contextual issues for ground-truth design in terms of the choice of documents (page images) it needs to describe. Second, to provide an understanding of the overall architecture of which ground truth is part (and within which it is used).
everyday occurrences. Second, the proportion of documents (population in the dataset) between categories should reflect realistic usage and at the same time the documents in each category must be sufficiently varied and numerous to enable meaningful evaluation for specific applications.
To that effect, the authors have established a detailed taxonomy of existing documents (text carriers), based on physical and logical layout characteristics (about 21 document types and 80 subtypes). Document types range from official documents (e.g., certificates) to various drawings and maps, to forms, books, tickets and text in natural scenes, to name but a few. However, certain types of document are more widely distributed and are more targeted by application developers. These are documents that contain information that a wide variety of users need to extract. Examples are office documents, magazine pages, advertisements and technical articles. The dataset created by the authors reflects this situation by containing more instances of these types of document.
It should be noted that the layouts of these types of document vary considerably. Office documents and technical articles have more structured layouts that usually follow simple formatting rules. On the other hand, magazine pages have more complex layouts and advertisements even more so. As it will be seen in the next section, the complexity of layout regions is one of the deciding factors in ground truth design.
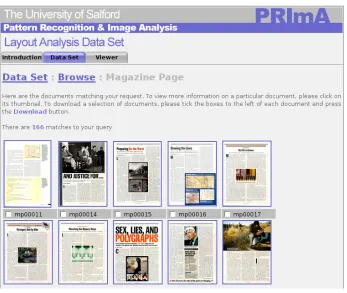
The dataset is organised in two broad layers of functionality. The outer layer is a database holding certain physical and administration attributes for each document page in the dataset. Physical attributes include dimensions, the presence (or absence) of colour, whether or not the document is single or multi-columned, the (main) language of the text, the reading direction, the resolution of the image as well as a characterisation of the complexity of the layout. All these attributes are deemed to be interesting for searching and selecting sets of documents for evaluation (they represent major factors that influence layout analysis methods). Administration attributes are mostly used by the dataset keepers and include authorship and source information, copyright information etc. A web front-end enables both searching of the dataset based on the above attributes as well as browsing of the dataset according to document types (as defined in the established taxonomy). A screenshot of the web interface (browsing magazine pages) can be seen in Fig. 1.
The inner layer of functionality comprises the image-ground truth pair. An image file (or two, as in the case of colour/greyscale documents both the original and a bilevel copy are kept) and its corresponding ground truth description file are linked to each record in the database. The design issues and characteristics of the ground truth description are discussed in the next section.
Fig. 1. The Web interface for browsing a specific document category.
4 Ground truth
It can be appreciated that, given a document image, the description of the corresponding ground truth is not a trivial matter. The types of information to be included and the representation of this information are crucial for successful use. Another important underlying factor is the significant cost of creating ground truth, as it impacts on both the design and the maintainability of the dataset. This cost is due to the fact that the creation of ground truth cannot be fully automated. Typical times for creating ground truth can run in the hours for a single page (from scanning to commitment in the dataset).
colour scans will become increasingly necessary and therefore the ground truth must include colour information.
In the ground truth described here, information is recorded regarding the document (page image) as a whole (e.g. physical characteristics, number of regions present etc.) as well as for each individual region. A region is defined to be the smallest logical entity on the page. For the purpose of layout analysis methods, it is sufficient for a region to represent a single paragraph in terms of text (body text, header, footnote, page number, caption etc.), or a graphic region (halftone, line-art, images, horizontal/vertical ruling etc.). Composite elements of a document, such as tables or figures with embedded text, are considered each as a single region (of that corresponding type such as table, chart etc.).
The region-representation scheme plays a critical role in the efficiency and accuracy of the performance analysis strategy. For the comparison between regions (a ground truth region against a region resulting from a method to be evaluated), bounding rectangles are the most efficient representation. However, complex-shaped regions cannot be accurately represented by bounding rectangles. The proposed scheme describes regions using isothetic (having only horizontal and vertical edges) polygons [3]. This representation of regions is very accurate and flexible since each region can have any size, shape and orientation. Furthermore, a region, whose contour is an isothetic polygon, can be represented by a number of rectangular horizontal intervals whose height is determined by the corners of its contour polygon (effectively achieving decomposition into rectangles). This interval structure makes checking for inclusion and overlaps, and calculation of area, possible with very few operations, thus approximating the efficiency of rectangles [4].
In general, ground truth must fulfil the following objectives:
• Accuracy, both in terms of absence of human errors and in the inherent ability to represent complex information.
• Richness of information, to enable various evaluation scenarios. • Efficiency of comparison, to enable evaluation using large datasets.
• Ease of understanding, in terms of representation organisation to facilitate maintenance and use.
• Ease of creation, in terms of the ability to achieve the above objectives with the use of a specially designed ground-truthing tool (see below).
• Anticipation of future requirements, in terms of extensibility to avoid obsolescence.
4.1 Ground Truth Representation
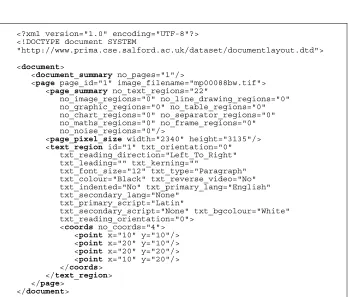
The ground truth information is represented in XML (addressing, thus, the representation-related goals listed in the previous section). Figure 2 shows a ground truth example of a document containing a single text region (simplified for illustration purposes). The main element is a Document, which is the only type of element that can be found in an XML file after the header lines. Inside the Document (between the <document> and </document> tags) two types of element are allowed: the
<?xml version="1.0" encoding="UTF-8"?> <!DOCTYPE document SYSTEM
"http://www.prima.cse.salford.ac.uk/dataset/documentlayout.dtd">
<document>
<document_summary no_pages="1"/>
<page page_id="1" image_filename="mp00088bw.tif"> <page_summary no_text_regions="22"
no_image_regions="0" no_line_drawing_regions="0" no_graphic_regions="0" no_table_regions="0" no_chart_regions="0" no_separator_regions="0" no_maths_regions="0" no_frame_regions="0" no_noise_regions="0"/>
<page_pixel_size width="2340" height="3135"/> <text_region id="1" txt_orientation="0" txt_reading_direction="Left_To_Right" txt_leading="" txt_kerning=""
txt_font_size="12" txt_type="Paragraph" txt_colour="Black" txt_reverse_video="No" txt_indented="No" txt_primary_lang="English" txt_secondary_lang="None"
txt_primary_script="Latin"
txt_secondary_script="None" txt_bgcolour="White" txt_reading_orientation="0">
<coords no_coords="4"> <point x="10" y="10"/> <point x="20" y="10"/> <point x="20" y="20"/> <point x="10" y="20"/> </coords>
</text_region> </page>
[image:7.595.125.473.133.430.2]</document>
Fig. 2. Example of ground truth representation.
Each page is represented as a separate element, and information about each page is given between the <page> and </page> tags. The image filename attribute is used to indicate the name of the image file on which the ground truth is based. Each page can be decomposed into a number of regions. In the current ground truth version, there are ten distinct types of regions defined: Text, Image, Line Drawing, Graphic, Table,
Chart, Separator, Maths, Noise and Frame. The “page summary” contains the number of occurrences of each type of region in the page, while the page size attributes define the width and height (in pixels) of the page.
Each region must contain a unique ID number to identify it within the document. A number of attributes (their occurrence depending on the type of the region) is optional. These attributes describe as many characteristics of the region as possible. Various attributes relevant to text regions are shown in the example of Fig. 2. It is mandatory that each region contains coordinate sets that define its outline (isothetic polygon).
The full Document Type Definition (DTD) file which defines the XML representation of ground-truth information can be found at:
4.2 Ground truth creation
To enable the creation of detailed and flexible ground truth, a semi-automated tool has been designed by the authors. When designing this tool the decision was made to provide full flexibility and the focus was placed on the creation of ground truth, rather than the correction of the results of a first-pass segmentation process. This is a pragmatic approach to the problem, stemming from previous experience of the authors with ground-truthing [5]. The crucial observation was that the time spent in correcting the errors of segmentation is more often than not significantly longer than following a bottom-up approach to build ground truth information and fewer errors are made (users tend to miss errors made by the first-pass segmentation process).
It is worth mentioning at this point that there are other approaches to “ground truth” creation in the literature (e.g., [6]). In these cases though, the tools are meant to be used in the final stages of an automated process to ensure the validity of the outcome of the conversion process of a paper document into electronic form, while the “ground truth” information sought is also application specific and lacks the depth and breadth needed for performance evaluation.
The ground-truthing tool “Aletheia” (from the Greek word for “truth”) operates on the bilevel version of the document images and comprises functionality to perform connected component analysis and, subsequently, combine the resulting components into regions (as required by the ground truth specification). In addition, it provides the necessary interface to label the regions identified and specify an appropriate set of attributes for each, customized according to its type. Finally, the software can export the ground truth as an XML file, which fully conforms to the ground truth specification.
Before any editing operations become available, the software performs a connected component analysis of the document image. A fast one-pass algorithm is employed for that purpose. The connected components identified in the image are the base units for the construction of regions. Each target region will comprise a list of components, and will be described by a boundary which will enclose only the specified components, and possibly some white space.
There are four supported methods to group together connected components into a region that affect the way the boundary of the region is derived offering different levels of flexibility. At the lower level the user can select the components of a region one by one. The boundary of the region is then defined as the minimum bounding rectangle which encloses the selected components. A higher-level approach is to use a drag-and-resizeoperation to specify a rectangle and select all the components inside it. The system then allows the user to either adopt the specified rectangle as the boundary of the region, or shrink the specified rectangle in order to produce the minimum rectangle in the same manner as before. Finally, in order to address cases where complicated region shapes are necessary, the software offers the option to use a freehand drawing method to select components. In this case the user defines a polygon by successively selecting its corner points. The isothetic rectangle boundary in this case is calculated based on the initial polygon, which is reduced in such a way so that most of the white space is removed.
regions can always be dissolved into their constituent components. Following the bottom up approach described above, a higher (region) level segmentation of a document can be obtained in a few minutes.
[image:9.595.125.475.188.354.2](a) (b)
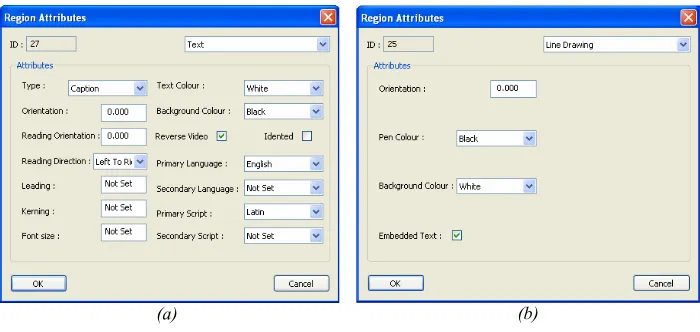
Fig. 3. The attribute dialogs for (a) a Text region and (b) a Line Drawing region.
Subsequent to geometrically defining the regions of the document page the user has to label the resulted regions and define the associated attributes. According to the ground truth specification, Aletheia allows each region to be of any of the ten region types defined. By right-clicking a region, the user is presented with a dialog box, which lists the type and associated attributes of each region. The user can then select the type of the region from a drop down list, and specify the values for all attributes associated with the region type. The only attribute the user cannot control is the region ID number, which is assigned and managed automatically by the software. Figure 3 shows the attributes dialog for a text region, and a line drawing region.
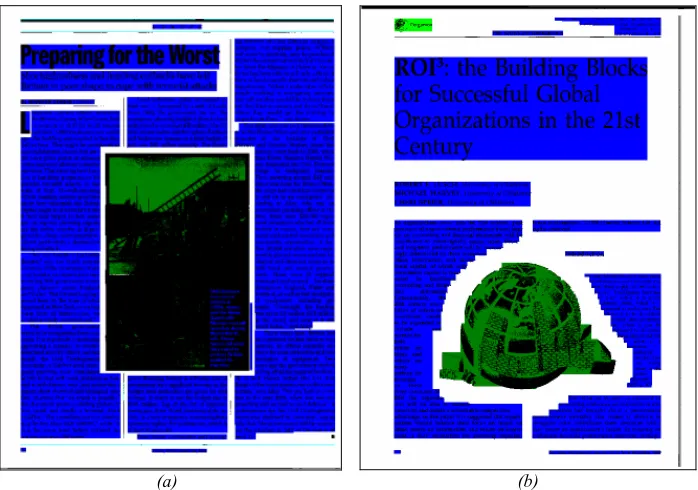
Figure 4 shows two instances of ground-truth regions created with Aletheia. The software visualises the ground-truth information by assigning different colours to regions depending on their type. This facilitates the process of labelling the regions, since the user can easily identify any unprocessed regions. Any regions or components that have not been labelled are automatically marked as noise regions.
(a) (b)
Fig. 4. Examples of the final ground-truth for (a) a Magazine page and (b) a Technical Article page.
5 Concluding remarks
This paper has introduced and discussed a number of important issues surrounding ground truth for the evaluation of the performance of layout analysis methods. The focus was on the design, representation and creation stages in the context of a new dataset developed by the authors. The resulting ground truth is the product of the authors’ effort over the past few years and reflects their experience with performance evaluation. The ground truth created has been successfully used as the basis for two international competitions, held under the auspices of the International Conference on Document Analysis and Recognition in 2003 [7] (in an earlier version) and 2005 [8].
References
1. Philips, I.T., Chen, S., Ha, J., and Haralick, R.M. English Document Database Design and Implementation Methodology. In Proceeding of the 2nd Annual Symposium on Document Analysis and Retrieval (UNLV, USA, 1993). 65–104.
Conference on Document Analysis and Recognition (ICDAR’99), (Bangalore, India, 1999). IEEE-CS Press, 451–454.
3. Antonacopoulos, A. Page Segmentation Using the Description of the Background.
Computer Vision and Image Understanding, Vol. 70, No. 3 (1998), 350–369.
4. Antonacopoulos, A. and Ritchings, R.T. Representation and Classification of Complex-Shaped Printed Regions Using White Tiles. In Proceedings of the 3rd International
Conference on Document Analysis and Recognition (ICDAR’95) (Montreal, Canada, 1995). IEEE-CS Press, 1132-1135.
5. Antonacopoulos, A., and Meng, H., A Ground-Truthing Tool for Layout Analysis Performance Evaluation, In Document Analysis Systems V, D. Lopresti, J. Hu and R. Kashi (Eds.), Springer Lecture Notes in Computer Science, LNCS 2423, 2002, 236-244.
6. Simske, S.J, and Sturgill, M., A Ground-Truthing Engine for Proofsetting, Publishing, Re-Purposing and Quality Assurance, In Proceedings of the 2003 ACM Symposium on Document Engineering (DocEng’03) (Grenoble, France, 2003), ACM Press, 150-152. 7. Antonacopoulos, A., Gatos, B., and Karatzas, D. ICDAR2003 Page Segmentation
Competition, In Proceedings of the 7th International Conference on Document Analysis and
Recognition (ICDAR2003) (Edinburgh, UK, August 2003). IEEE-CS Press, 688–692. 8. Antonacopoulos, A., Gatos, B., and Bridson, D. ICDAR2005 Page Segmentation
Competition, In Proceedings of the 8th International Conference on Document Analysis and