Statistics
in focus
INDUSTRY, TRADE AND
SERVICES
33/2005
Author
Anastassios
GIANNOPLIDIS
C o n t e n t s
Volume of sales index
for retail trade... 2
Volume of sales index for
food and non-food retailers ... 3
Volume of sales index for
selected non-food retailers ... 4
Volume of sales index for
selected non-food retailers
(continued) ... 5
Employment index for
retail trade... 6
Developments for
retail trade
during the second quarter of 2005
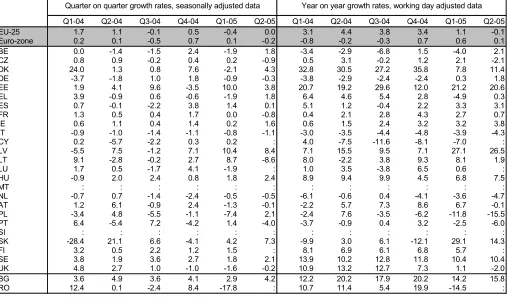
Seasonally adjusted indices for the volume of sales within the retail trade
sector grew at a modest pace in the EU-25, while falling in the euro-zone
between the first and second quarters of 2005. This was in contrast to the
evolution witnessed in the previous quarter, when the pace of sales growth
had accelerated in both the EU-25 and the euro-zone. Retail sales rose by
0.1 % in the EU-25 in the second quarter of 2005, the lowest quarter on
quarter increase since the first quarter of 2003. In the euro-zone sales fell by
0.3 %; this contraction could be partly attributed to a correction, as retail sales
had expanded by as much as 0.7 % between the final quarter of 2004 and the
first quarter of 2005 (the highest quarter on quarter growth rate since the third
quarter of 2002).
[image:1.595.8.198.6.516.2]On the basis of a comparison with the same quarter of a year before, working
day adjusted indices for the volume of sales in the retail trade sector grew by
1.1 % in the second quarter of 2005 in the EU-25 and by 0.6 % in the
euro-zone. As such, the EU-25 growth rate was the lowest recorded since the third
quarter of 2003, while the latest rate for the euro-zone was the lowest
recorded since the second quarter of 2004.
[image:1.595.222.565.404.591.2]Table 1: VOLUME OF SALES INDEX FOR RETAIL TRADE, GROWTH RATES (%);
Figure 1: VOLUME OF SALES INDEX FOR RETAIL TRADE, SEASONALLY
ADJUSTED DATA, GROWTH RATES COMPARED
TO THE PREVIOUS QUARTER (%); SOURCE: EUROSTAT STS
(
#
-0.5 0.0 0.5 1.0
Q3-04 Q4-04 Q1-05 Q2-05 EU-25 Euro-zone
EU-25 Euro-zone EU-25 Euro-zone Q3-04 0.3 0.1 Q3-04 2.4 0.7 Q4-04 0.3 0.1 Q4-04 2.2 0.9 Q1-05 0.5 0.7 Q1-05 1.9 1.1 Q2-05 0.1 -0.3 Q2-05 1.1 0.6
Quarter on quarter growth rates, seasonally adjusted data
2 Statistics in focus — Industry, trade and services — 33/2005 ————————————————————————
#
Volume of sales index for retail trade
The modest quarter on quarter increase in EU-25 retail
sales volumes could be attributed to a 0.2 % contraction
in sales of food, beverages and tobacco products, which
dampened the 0.3
% growth in sales of non-food
products between the first and second quarters of 2005.
In the euro-zone the contrast in rates was more
pronounced, as retail sales of food, beverages and
tobacco products contracted by 0.8 % in the second
quarter of 2005, while there was no change in the
volume of sales for non-food products.
[image:2.595.47.555.225.413.2]Among the Member States for which data are available
in the first and second quarters of 2005, Belgium and
Poland saw growth in retail sales volumes rebound into
positive territory between the first and second quarters
of 2005. However, in France, Italy and Luxembourg
there was confirmation of contracting sales in the
second quarter. Germany, the Netherlands and Austria
were the only countries to report sales growth in the first
quarter of 2005 followed by a contraction in the second
quarter.
[image:2.595.50.555.451.745.2]Table 3: VOLUME OF SALES INDEX FOR RETAIL TRADE, GROWTH RATES (%); SOURCE: EUROSTAT STS
Table 2: VOLUME OF SALES INDEX, GROWTH RATES (%); SOURCE: EUROSTAT STS
Q1-04 Q2-04 Q3-04 Q4-04 Q1-05 Q2-05 Q1-04 Q2-04 Q3-04 Q4-04 Q1-05 Q2-05 EU-25 100.0 0.9 0.7 0.3 0.3 0.5 0.1 2.6 2.5 2.4 2.2 1.9 1.1 Euro-zone 100.0 0.3 0.3 0.1 0.1 0.7 -0.3 1.1 0.5 0.7 0.9 1.1 0.6 EU-25 43.9 0.6 0.3 0.3 0.5 0.4 -0.2 2.2 1.2 1.3 1.8 1.7 0.8 Euro-zone 43.7 0.0 0.3 0.2 0.3 0.4 -0.8 1.3 0.1 0.3 1.1 1.0 0.0 EU-25 56.1 1.1 0.9 0.3 0.2 0.5 0.3 2.9 3.4 3.3 2.4 2.0 1.1 Euro-zone 56.3 0.3 0.4 0.0 0.0 0.8 0.0 0.6 0.9 0.9 0.7 1.1 0.7 of which,
EU-25 10.5 1.4 1.0 0.3 0.1 1.0 0.9 2.1 3.2 3.5 2.7 2.6 2.4 Euro-zone 10.6 1.1 0.4 -0.1 -0.4 0.7 0.6 -1.2 0.3 1.3 0.7 0.8 0.9 EU-25 14.1 2.2 0.9 0.2 0.2 0.3 0.5 4.8 4.8 4.3 3.4 1.7 1.2 Euro-zone 14.8 1.9 0.3 -0.3 0.0 0.4 0.7 2.5 2.9 2.1 1.8 0.5 0.9 EU-25 12.6 1.7 1.1 -0.1 0.5 -0.4 0.0 3.1 4.4 3.8 3.4 1.1 -0.1 Euro-zone 12.1 0.2 0.1 -0.5 0.7 0.1 -0.2 -0.8 -0.2 -0.3 0.7 0.6 0.1
Quarter on quarter growth rates, seasonally adjusted data
Year on year growth rates, working day adjusted data Weights
(% of total)
Household equipment Books, newspapers and sale in specialised stores Retail trade
Textiles, clothing, footwear & leather goods
Retail sale of food, beverages and tobacco
Retail sale of non-food products
Q1-04 Q2-04 Q3-04 Q4-04 Q1-05 Q2-05 Q1-04 Q2-04 Q3-04 Q4-04 Q1-05 Q2-05
EU-25 0.9 0.7 0.3 0.3 0.5 0.1 2.6 2.5 2.4 2.2 1.9 1.1
Euro-zone 0.3 0.3 0.1 0.1 0.7 -0.3 1.1 0.5 0.7 0.9 1.1 0.6
BE 0.9 0.3 0.2 1.5 -3.1 4.7 0.4 0.8 1.7 2.7 -1.2 3.2
CZ 0.8 0.6 0.9 0.8 0.5 1.1 2.6 3.1 3.2 2.8 3.6 2.5
DK 3.7 0.9 2.6 3.4 1.7 3.0 6.8 6.8 7.8 10.7 9.0 9.9
DE -0.5 0.1 0.9 0.2 1.0 -0.6 0.4 -0.5 0.6 0.6 2.3 1.5
EE 2.6 3.2 2.7 2.1 4.2 3.4 13.6 13.0 12.3 10.9 12.9 13.1
EL 1.7 0.5 1.1 0.6 0.8 1.3 4.9 5.0 4.7 3.5 2.6 4.1
ES 1.0 0.2 -0.4 1.7 0.6 0.2 4.3 2.5 0.9 2.5 2.3 2.2
FR 0.8 0.4 0.4 0.1 -0.1 -0.2 2.2 1.7 1.7 1.9 0.3 -0.3
IE 1.0 1.8 0.6 1.4 1.8 1.2 3.1 3.9 4.9 4.8 5.7 5.2
IT -0.6 -0.8 -0.7 -0.3 0.0 -0.7 -1.4 -2.6 -3.2 -2.3 -0.8 -2.1
CY 2.1 -0.4 1.4 1.2 1.2 : 7.5 2.3 1.5 2.8 5.4 :
LV -0.5 5.2 2.6 4.5 7.4 2.9 13.0 13.8 10.5 11.3 23.1 18.3
LT 2.2 1.8 1.1 2.9 2.0 4.3 13.7 12.8 8.6 8.4 7.2 10.8
LU -0.7 1.0 -0.1 -0.3 -0.3 -1.5 0.6 0.7 1.0 0.2 0.9 -2.9
HU 0.9 1.3 0.9 1.0 1.2 1.9 5.7 8.0 5.3 3.4 3.5 6.2
MT : : : : : : : : : : : :
NL 0.4 -0.2 -0.5 -0.6 0.2 -0.3 -2.6 0.0 0.3 -1.3 -0.9 -1.3
AT 1.4 1.6 -1.1 0.2 1.0 -0.2 -0.4 1.1 2.4 1.9 2.1 0.1
PL 0.9 1.5 -0.6 -0.6 -2.7 2.3 8.1 9.2 4.6 0.2 -3.5 -1.6
PT 2.3 -1.3 4.6 -2.4 3.1 1.0 -0.2 4.5 3.0 3.2 4.7 0.9
SI -2.5 2.9 2.7 0.5 1.1 1.8 1.0 2.9 2.9 3.5 7.3 6.1
SK -0.6 3.5 1.3 -0.1 4.5 2.0 3.7 8.3 9.4 3.3 9.5 8.1
FI 1.3 0.4 1.3 1.2 0.8 2.3 5.1 4.6 4.2 4.0 3.8 6.1
SE 1.3 1.4 1.3 1.3 2.2 1.0 5.4 4.3 5.2 5.1 6.6 5.9
UK 2.2 1.7 0.9 0.3 0.0 0.3 6.1 6.9 6.7 5.0 3.3 0.9
BG 2.8 3.1 3.3 3.4 2.6 3.3 11.5 12.2 13.0 15.6 12.2 13.0
RO 4.9 2.5 3.1 6.2 4.9 : 16.8 12.3 10.5 18.9 19.0 :
Volume of sales index for food and non-food retailers
Table 4: VOLUME OF SALES INDEX FOR FOOD RETAILERS, GROWTH RATES (%); SOURCE: EUROSTAT STS
Q1-04 Q2-04 Q3-04 Q4-04 Q1-05 Q2-05 Q1-04 Q2-04 Q3-04 Q4-04 Q1-05 Q2-05
EU-25 0.6 0.3 0.3 0.5 0.4 -0.2 2.2 1.2 1.3 1.8 1.7 0.8
Euro-zone 0.0 0.3 0.2 0.3 0.4 -0.8 1.3 0.1 0.3 1.1 1.0 0.0
BE 2.4 -0.7 0.3 0.9 0.1 -0.5 3.3 1.0 2.5 3.2 0.2 1.4
CZ 0.5 0.0 1.2 1.4 0.1 1.1 2.3 1.5 2.7 3.7 3.8 2.8
DK 1.2 -0.3 1.2 0.9 -0.9 0.3 3.0 2.8 3.1 2.4 2.1 0.3
DE -0.5 -0.8 2.2 0.1 1.2 -1.2 2.6 0.6 1.4 1.0 2.8 2.3
EE 1.2 4.7 2.2 2.4 3.6 2.9 13.0 14.8 12.0 10.8 13.6 11.6
EL 0.7 2.4 1.9 1.2 1.8 -0.1 6.2 7.8 8.1 6.5 8.1 4.3
ES 0.9 0.2 -0.5 1.4 -0.2 -0.9 2.5 1.5 0.0 2.4 0.8 -0.3
FR 0.1 0.1 0.2 -0.2 -0.7 -0.5 0.7 -0.5 0.0 0.6 -1.3 -2.0
IE 0.2 1.0 1.1 2.5 0.6 1.9 3.3 2.3 4.1 5.2 c 6.3
IT -0.9 -0.2 -0.8 0.7 0.9 -1.4 -0.9 -2.8 -3.3 -1.0 1.4 -0.8
CY 1.9 1.5 3.2 2.8 2.1 : 3.1 1.1 5.5 10.6 12.5 :
LV -0.4 5.0 2.1 5.1 5.8 2.1 13.4 11.6 8.3 11.7 22.9 15.4
LT 1.5 0.7 -0.8 2.5 1.1 3.0 11.8 11.6 2.7 4.0 3.3 6.3
LU -1.1 -0.3 -0.8 -0.7 0.2 -0.8 1.2 -0.1 -1.4 -2.9 -0.2 -2.2
HU 0.4 0.1 0.8 0.6 0.6 2.0 3.0 3.5 3.0 1.6 0.6 5.2
MT : : : : : : : : : : : :
NL 0.7 0.3 -0.8 0.5 0.4 -0.3 0.4 0.7 0.4 0.6 0.5 -0.4
AT 1.9 0.3 -1.6 0.7 0.7 -0.7 0.5 0.1 0.5 1.0 0.4 -0.7
PL 0.3 0.3 -1.7 -0.8 0.5 3.0 9.4 6.1 1.2 -2.0 -2.1 1.7
PT 1.0 2.0 2.4 0.0 0.6 1.6 -0.4 6.5 3.4 5.5 6.5 -0.8
SI 2.6 0.0 1.1 2.1 1.1 2.8 1.6 2.6 2.7 5.9 4.5 7.5
SK -0.5 -1.2 -4.2 -2.7 1.2 -5.9 -10.5 -6.7 -8.5 -8.2 -6.7 -11.2
FI 0.4 0.4 0.2 0.9 1.1 1.2 2.9 2.5 1.4 1.5 2.7 3.3
SE 0.7 0.3 -0.8 0.6 2.4 -0.2 1.5 0.2 -0.1 0.4 2.8 2.0
UK 1.3 1.5 0.8 0.8 0.4 0.3 3.9 3.9 4.2 4.4 3.5 2.3
BG 0.4 1.0 2.5 3.2 2.6 2.1 10.5 5.1 5.1 8.1 10.4 10.7
RO 3.2 2.5 4.4 4.8 5.5 : 13.7 6.7 8.4 14.6 24.7 :
Quarter on quarter growth rates, seasonally adjusted data Year on year growth rates, working day adjusted data
Q1-04 Q2-04 Q3-04 Q4-04 Q1-05 Q2-05 Q1-04 Q2-04 Q3-04 Q4-04 Q1-05 Q2-05
EU-25 1.1 0.9 0.3 0.2 0.5 0.3 2.9 3.4 3.3 2.4 2.0 1.1
Euro-zone 0.3 0.4 0.0 0.0 0.8 0.0 0.6 0.9 0.9 0.7 1.1 0.7
BE 1.7 -0.5 -0.1 1.6 -3.0 6.8 -1.7 0.8 1.1 2.5 -2.1 5.1
CZ 1.0 1.1 0.7 0.4 0.8 1.1 2.8 4.2 3.5 2.3 3.4 2.4
DK 5.8 1.9 3.5 4.9 1.0 4.4 7.7 9.2 11.3 16.9 12.1 13.9
DE -1.2 0.4 0.3 0.4 0.4 -0.4 -1.3 -1.0 0.0 -0.1 1.7 0.8
EE 3.3 1.2 3.5 2.7 2.2 4.2 15.3 12.0 12.4 11.2 10.3 13.3
EL 1.9 -1.0 0.5 0.2 -0.1 1.7 3.3 2.2 1.5 0.9 -2.3 3.8
ES 0.5 0.3 0.1 1.2 1.0 0.3 4.9 2.7 1.4 2.1 3.2 2.6
FR 1.7 0.8 0.6 0.4 0.7 0.1 3.9 4.1 3.6 3.3 1.9 1.3
IE 1.2 2.5 -0.3 0.1 3.0 1.0 1.6 4.4 4.3 3.0 c 3.9
IT -0.6 -0.6 -1.0 -0.7 -0.4 -0.9 -2.1 -2.6 -3.2 -2.9 -2.2 -2.9
CY 1.5 -0.3 0.6 0.5 0.5 : 8.7 2.8 -0.3 -0.8 2.9 :
LV -6.8 7.5 3.2 9.3 0.4 6.8 12.8 15.9 12.2 12.2 23.7 20.9
LT 2.9 3.1 4.7 2.1 2.9 6.5 16.0 14.2 17.6 13.1 12.8 17.1
LU 0.6 0.7 0.3 -0.2 -1.0 -1.0 0.4 1.0 2.6 2.0 1.0 -2.8
HU 0.7 2.4 0.8 1.2 1.9 2.2 8.1 11.6 7.1 4.7 6.0 6.9
MT : : : : : : : : : : : :
NL -0.1 -0.1 -0.9 -1.2 0.2 -0.4 -4.2 0.0 -0.1 -2.6 -2.1 -2.3
AT 1.1 2.5 -0.8 -0.2 1.2 0.1 -1.0 1.7 3.5 2.4 3.2 0.5
PL 1.1 2.8 -1.4 -1.1 -3.3 2.4 7.7 11.0 5.7 0.7 -4.8 -5.3
PT 3.3 -3.7 6.3 -4.2 5.1 0.6 0.0 2.9 2.7 1.6 3.3 2.3
SI -2.2 1.6 2.4 -0.4 2.0 2.0 3.0 3.2 3.3 0.9 5.7 6.4
SK -5.3 7.2 3.0 2.1 3.5 4.8 7.1 12.9 15.3 6.5 16.0 14.0
FI 1.3 0.7 2.0 1.2 1.1 2.5 6.7 5.6 6.0 4.7 5.3 7.2
SE 1.9 2.3 2.7 1.6 2.7 2.0 8.9 8.0 9.6 8.6 9.6 9.1
UK 2.6 2.5 0.7 -0.2 0.0 -0.4 8.1 9.2 8.6 5.4 3.0 -0.1
BG 3.9 4.2 3.8 3.6 2.5 3.5 12.1 16.5 17.9 19.9 13.2 14.2
RO 5.9 3.0 2.4 8.1 1.1 : 19.6 16.9 12.0 22.0 15.1 :
[image:3.595.49.554.452.750.2]4 Statistics in focus — Industry, trade and services — 33/2005 ————————————————————————
#
[image:4.595.46.553.91.391.2]Volume of sales index for selected non-food retailers
[image:4.595.45.559.455.747.2]Table 7: VOLUME OF SALES INDEX FOR HOUSEHOLD EQUIPMENT RETAILERS, GROWTH RATES (%);
SOURCE: EUROSTAT STS
Table 6: VOLUME OF SALES INDEX FOR TEXTILES, CLOTHING, FOOTWEAR & LEATHER GOODS RETAILERS,
GROWTH RATES (%); SOURCE: EUROSTAT STS
Q1-04 Q2-04 Q3-04 Q4-04 Q1-05 Q2-05 Q1-04 Q2-04 Q3-04 Q4-04 Q1-05 Q2-05
EU-25 1.4 1.0 0.3 0.1 1.0 0.9 2.1 3.2 3.5 2.7 2.6 2.4
Euro-zone 1.1 0.4 -0.1 -0.4 0.7 0.6 -1.2 0.3 1.3 0.7 0.8 0.9
BE 2.3 -1.1 3.0 -3.6 1.6 -1.3 -1.5 1.5 5.2 -0.3 1.0 -0.7
CZ 5.8 1.8 3.9 1.0 2.7 6.3 10.3 12.3 14.7 10.8 10.2 15.2
DK 4.1 -0.3 8.1 5.6 2.1 3.4 4.1 5.6 10.6 17.5 16.2 19.0
DE 2.3 -0.1 1.3 0.5 -1.0 4.5 -1.8 0.1 2.7 3.7 1.2 5.5
EE -10.7 -4.2 12.7 -1.9 0.1 9.4 3.4 -6.9 -2.7 -5.3 5.5 21.0
EL 2.0 0.0 1.2 0.1 -0.3 0.6 0.6 -1.5 3.2 3.1 0.0 1.5
ES -0.5 2.3 -0.2 0.9 0.9 1.0 2.3 2.4 3.2 2.5 3.7 2.8
FR 1.0 1.3 -0.3 -0.1 0.0 -0.4 -0.1 1.7 0.6 0.6 -0.7 -1.9
IE 3.8 2.0 -0.2 0.4 7.3 0.3 7.8 11.0 8.1 5.6 9.2 8.0
IT -1.1 -0.2 -1.6 -0.5 0.0 -1.4 -3.6 -3.6 -4.4 -3.6 -1.8 -3.5
CY 2.8 0.3 -0.4 -1.0 -1.4 : 17.9 11.1 0.5 -2.1 1.1 :
LV 8.0 12.8 17.5 7.6 -5.0 9.2 27.0 44.8 58.6 52.2 36.9 30.8
LT 4.9 5.4 8.8 3.3 6.2 18.7 24.5 23.5 32.3 22.3 26.8 43.7
LU -1.3 -0.2 3.1 -0.9 -0.4 : -5.2 -2.1 5.7 0.5 0.9 :
HU 0.0 -1.1 -1.5 0.9 2.0 2.8 4.5 4.1 -2.5 -2.0 0.3 5.6
MT : : : : : : : : : : : :
NL 0.0 0.3 -1.0 -1.2 1.6 -0.3 -4.6 0.7 1.1 -2.1 0.2 -1.0
AT 2.1 1.1 -0.4 -3.0 3.8 0.9 -2.7 -0.2 4.6 -0.7 2.2 1.2
PL -4.4 -1.5 4.5 1.3 5.6 3.1 15.8 1.5 7.2 -1.0 11.2 14.8
PT 12.0 -7.4 9.8 -8.8 12.0 -5.6 0.7 3.5 7.5 4.0 8.9 -0.9
SI : : : : : : : : : : : :
SK -31.2 -4.4 -4.8 24.3 12.4 -10.0 -18.2 -23.7 -24.0 -21.3 27.1 20.8
FI 0.6 -0.4 4.6 -1.3 0.7 : 4.0 3.7 7.3 2.7 3.7 :
SE 2.3 0.0 5.1 -1.1 2.7 1.7 5.7 5.9 8.9 5.5 7.4 8.2
UK 3.0 2.3 0.1 0.7 1.2 1.2 9.3 10.0 7.0 6.0 4.8 3.0
BG 2.8 4.9 -1.1 5.0 3.0 9.0 9.0 15.9 7.6 12.0 12.2 17.0
RO 9.7 -1.0 0.9 4.7 -3.1 : 10.6 4.2 8.1 17.0 1.9 :
Quarter on quarter growth rates, seasonally adjusted data Year on year growth rates, working day adjusted data
Q1-04 Q2-04 Q3-04 Q4-04 Q1-05 Q2-05 Q1-04 Q2-04 Q3-04 Q4-04 Q1-05 Q2-05
EU-25 2.2 0.9 0.2 0.2 0.3 0.5 4.8 4.8 4.3 3.4 1.7 1.2
Euro-zone 1.9 0.3 -0.3 0.0 0.4 0.7 2.5 2.9 2.1 1.8 0.5 0.9
BE 4.7 -0.9 1.7 -1.6 -2.9 16.2 2.3 3.2 5.8 3.8 -4.1 13.3
CZ 1.1 2.7 -0.3 0.9 1.0 0.7 6.7 10.9 6.8 2.5 3.5 0.9
DK 1.2 3.3 1.5 6.4 2.7 5.3 5.8 7.4 7.0 13.4 14.3 17.2
DE 2.8 0.2 -0.8 0.6 1.0 -2.4 1.1 2.0 1.5 2.8 1.3 -1.6
EE 4.2 3.5 -3.9 5.0 4.1 6.9 22.5 22.9 6.5 8.4 8.5 13.0
EL 2.8 -1.6 0.6 0.0 -0.4 3.0 5.5 6.2 3.4 0.9 -4.9 6.1
ES 2.0 0.7 -0.7 0.7 -0.2 0.1 7.2 6.2 2.0 2.1 1.0 -0.1
FR 2.2 1.7 1.2 0.7 0.8 1.0 7.6 8.0 7.1 5.9 3.0 3.7
IE 2.1 3.3 2.2 -0.7 2.3 1.1 -0.5 5.4 8.3 6.5 7.1 5.0
IT -0.7 -0.7 -1.2 -0.8 -0.6 -0.9 -2.5 -2.7 -3.6 -3.5 -3.2 -3.3
CY 4.7 1.1 1.7 0.7 3.6 : 15.2 12.6 11.2 6.4 7.9 :
LV -10.9 14.5 2.8 7.9 -3.4 6.7 19.4 21.8 11.5 12.4 25.8 14.5
LT 4.4 7.7 7.3 3.1 3.0 8.6 37.4 33.7 35.7 24.0 21.2 23.0
LU -0.2 0.7 2.2 -0.7 1.6 : 4.2 2.0 7.2 1.4 3.4 :
HU 1.0 3.3 0.3 1.6 -0.4 3.9 10.5 16.8 8.0 5.7 4.2 6.7
MT : : : : : : : : : : : :
NL 1.1 -1.0 -1.2 -1.0 -0.5 1.0 -3.1 -0.5 -1.9 -2.7 -3.9 -1.3
AT 2.9 1.4 -1.0 -1.2 1.5 1.6 1.3 1.8 2.7 1.9 0.9 1.2
PL 13.9 1.6 -5.1 2.2 -2.6 6.2 34.8 32.7 19.1 12.2 -7.0 -1.1
PT -1.6 -2.7 6.5 -2.3 4.4 5.6 -0.8 1.3 0.7 0.0 5.2 8.7
SI : : : : : : : : : : : :
SK 40.8 5.0 2.9 5.3 -13.4 7.8 100.4 70.0 62.5 60.8 -1.4 1.4
FI 1.8 -0.8 2.3 1.1 3.9 : 10.8 5.7 6.7 4.5 6.7 :
SE 1.8 3.8 3.0 1.4 2.5 2.7 10.3 10.5 12.1 10.1 11.2 10.1
UK 1.6 2.6 1.4 -0.6 -0.4 -1.8 8.4 6.9 8.3 4.9 3.2 -1.7
BG 4.7 6.0 6.4 4.9 1.6 3.8 15.7 18.6 25.0 27.0 19.3 17.3
RO -6.2 4.9 0.1 7.3 6.2 : 25.7 17.6 1.3 8.2 21.9 :
Volume of sales index for selected non-food retailers (continued)
Among non-food retailers, the volume of sales
increased at its most rapid pace for textile, clothing,
footwear and leather goods retailers, with a 0.9 % rise in
seasonally adjusted sales in the EU-25 between the first
and second quarters of 2005 (0.6 % in the euro-zone).
This followed 1.0 % growth in the first quarter of 2005
(0.7 % in the euro-zone).
The volume of sales index for household equipment
retailers rose by 0.5 % in the EU-25 (and 0.7 % in the
euro-zone). These latest rates marked an improvement
on those reported for the first quarter of 2005, when
sales volumes had increased by 0.3 % and 0.4 %
respectively.
The sales index for book, newspaper and other
specialised retailers was unchanged in the EU-25
between the first and second quarters of 2005, while it
contracted by 0.2 % in the euro-zone. This marked an
improvement for the EU-25, as sales had fallen by
0.4 % in the first quarter of 2005, while for the
euro-zone the latest rates deteriorated when compared with
those for the first quarter, when sales had marginally
increased by 0.1 %.
On the basis of a comparison with the same quarter of a
year before, working day adjusted sales volumes in the
second quarter of 2005 rose by 2.4 % in the EU-25 for
textile, clothing, footwear and leather retailers (0.9 % in
the euro-zone). These latest figures showed little
change when compared with the rates recorded for the
first quarter of 2005. On the basis of year on year
comparison of latest growth rates, textile, clothing,
footwear and leather retailers recorded the highest
growth in sales among the selected non-food retailers
for which information is available (as was the case for
quarter on quarter growth rates).
There was 1.2 % sales growth between the second
quarters of 2004 and 2005 for household equipment
retailers in the EU-25, while the corresponding rate for
the euro-zone was 0.9 %. These latest rates marked the
continuation of a gradual slowdown in the pace at which
sales were growing, with the pace of growth slowing in
the EU-25 in each of the last four quarters.
[image:5.595.44.552.445.743.2]There was almost no change in year on year sales
growth for book, newspaper and other specialised
retailers, with volumes falling by 0.1 % in the EU-25 and
rising by 0.1 % for the euro-zone in the second quarter
of 2005. These latest rates also marked the fourth
consecutive quarter that year on year sales growth
declined in the EU-25.
Table 8: VOLUME OF SALES INDEX FOR BOOK, NEWSPAPER AND OTHER SPECIALISED RETAILERS,
Q1-04 Q2-04 Q3-04 Q4-04 Q1-05 Q2-05 Q1-04 Q2-04 Q3-04 Q4-04 Q1-05 Q2-05
EU-25 1.7 1.1 -0.1 0.5 -0.4 0.0 3.1 4.4 3.8 3.4 1.1 -0.1
Euro-zone 0.2 0.1 -0.5 0.7 0.1 -0.2 -0.8 -0.2 -0.3 0.7 0.6 0.1
BE 0.0 -1.4 -1.5 2.4 -1.9 1.8 -3.4 -2.9 -6.8 1.5 -4.0 2.1
CZ 0.8 0.9 -0.2 0.4 0.2 -0.9 0.5 3.1 -0.2 1.2 2.1 -2.1
DK 24.0 1.3 0.8 7.6 -2.1 4.3 32.8 30.5 27.2 35.8 7.8 11.4
DE -3.7 -1.8 1.0 1.8 -0.9 -0.3 -3.8 -2.9 -2.4 -2.4 0.3 1.8
EE 1.9 4.1 9.6 -3.5 10.0 3.8 20.7 19.2 29.6 12.0 21.2 20.6
EL 3.9 -0.9 0.6 -0.6 -1.9 1.8 6.4 4.6 5.4 2.8 -4.9 0.3
ES 0.7 -0.1 -2.2 3.8 1.4 0.1 5.1 1.2 -0.4 2.2 3.3 3.1
FR 1.3 0.5 0.4 1.7 0.0 -0.8 0.4 2.1 2.8 4.3 2.7 0.7
IE 0.6 1.1 0.4 1.4 0.2 1.6 0.6 1.5 2.4 3.2 3.2 3.8
IT -0.9 -1.0 -1.4 -1.1 -0.8 -1.1 -3.0 -3.5 -4.4 -4.8 -3.9 -4.3
CY 0.2 -5.7 -2.2 0.3 0.2 : 4.0 -7.5 -11.6 -8.1 -7.0 :
LV -5.5 7.5 -1.2 7.1 10.4 8.4 7.1 15.5 9.5 7.1 27.1 26.5
LT 9.1 -2.8 -0.2 2.7 8.7 -8.6 8.0 -2.2 3.8 9.3 8.1 1.9
LU 1.7 0.5 -1.7 4.1 -1.9 : 1.0 3.5 -3.8 6.5 0.6 :
HU -0.9 2.0 2.4 0.8 1.8 2.4 8.9 9.4 9.9 4.5 6.8 7.5
MT : : : : : : : : : : : :
NL -0.7 0.7 -1.4 -2.4 -0.5 -0.5 -6.1 -0.6 0.4 -4.1 -3.6 -4.7
AT 1.2 6.1 -0.9 2.4 -1.3 -0.1 -2.2 5.7 7.3 8.6 6.7 -0.1
PL -3.4 4.8 -5.5 -1.1 -7.4 2.1 -2.4 7.6 -3.5 -6.2 -11.8 -15.5
PT 6.4 -5.4 7.2 -4.2 1.4 -4.0 -3.7 -0.9 0.4 3.2 -2.5 -6.0
SI : : : : : : : : : : : :
SK -28.4 21.1 6.6 -4.1 4.2 7.3 -9.9 3.0 6.1 -12.1 29.1 14.3
FI 3.2 0.5 2.2 1.2 1.5 : 8.1 6.9 6.1 6.8 5.7 :
SE 3.8 1.9 3.6 2.7 1.8 2.1 13.9 10.2 12.8 11.8 10.4 10.4
UK 4.8 2.7 1.0 -1.0 -1.6 -0.2 10.9 13.2 12.7 7.3 1.1 -2.0
BG 3.6 4.9 3.6 4.1 2.9 4.2 12.2 20.2 17.9 20.2 14.2 15.8
RO 12.4 0.1 -2.4 8.4 -17.8 : 10.7 11.4 5.4 19.9 -14.5 :
6 Statistics in focus — Industry, trade and services — 33/2005 ————————————————————————
#
Employment index for retail trade
The latest employment indices for the retail trade sector
show that the number of persons employed continued to
rise in the euro-zone in the second quarter of 2005.
Seasonally adjusted indices rose by 0.4 % between the
first and second quarters of 2005, in contrast to the
marginal increase of 0.1 % that was posted for the first
quarter of 2005. As such, the rate of increase in the
level of employment in the retail trade sector returned to
a similar level to that experienced during 2004.
The freshest information that is available for the EU-25
is for the first quarter of 2005, when the number of
persons employed rose by 0.1 % in relation to the final
quarter of 2004.
[image:6.595.41.563.226.415.2]In terms of year on year changes in employment within
the retail trade sector, there was a 1.4 % increase in the
second quarter of 2005 in the euro-zone, while the
number of persons employed grew by 1.6 % in the
EU-25 in the first quarter of 2005.
Table 9: EMPLOYMENT INDEX FOR RETAIL TRADE, GROWTH RATES (%); SOURCE: EUROSTAT STS
0.00 0.25 0.50 0.75
Q3-04 Q4-04 Q1-05 Q2-05 EU-25 (1) Euro-zone
Q1-04 Q2-04 Q3-04 Q4-04 Q1-05 Q2-05 Q1-04 Q2-04 Q3-04 Q4-04 Q1-05 Q2-05
EU-25 0.1 0.4 0.5 0.5 0.1 : 1.7 1.5 1.5 1.6 1.6 :
Euro-zone 0.6 0.4 0.4 0.5 0.1 0.4 2.2 2.0 1.8 2.0 1.4 1.4
BE -2.1 : : : : : -4.5 : : : : :
CZ c c c c c c c c c c c c
DK : : : : : : : : : : : :
DE 0.6 -0.3 0.5 -0.1 -0.3 -0.6 1.7 1.1 1.2 0.8 -0.5 -0.5
EE -4.3 2.9 1.3 0.4 1.2 : -5.0 -2.1 -0.9 0.2 5.9 :
EL 1.6 1.3 0.6 1.4 -0.4 : 2.9 4.5 3.9 4.9 2.9 :
ES 0.6 0.8 0.5 0.0 0.5 0.3 3.3 2.8 2.2 2.2 1.5 1.3
FR 0.2 0.4 0.2 0.1 0.1 -0.1 1.3 1.3 1.1 0.9 1.1 0.2
IE c c c c c c c c c c c c
IT c c c c c c c c c c c c
CY 1.9 0.3 1.3 0.8 -0.9 : 1.0 1.0 4.2 5.7 0.3 :
LV 1.2 1.5 0.4 0.0 0.9 -0.8 7.3 6.2 4.6 1.8 4.4 0.2
LT 1.4 2.3 4.0 1.2 -4.2 1.1 10.1 11.3 10.5 9.2 3.2 1.9
LU 0.1 0.5 0.9 1.3 0.9 0.3 1.1 0.9 0.9 3.2 3.5 3.6
HU 3.9 1.5 1.6 0.8 -1.3 -0.4 9.6 8.9 9.0 8.1 2.6 0.7
MT -0.8 -1.1 3.2 1.6 1.4 : -7.1 -5.4 0.7 3.3 5.4 :
NL -0.9 -0.7 -0.5 -0.5 -0.2 c -2.5 -2.8 -2.6 -2.8 -2.0 c
AT 0.3 0.8 0.3 0.5 0.0 0.1 0.2 1.1 1.6 1.9 1.6 0.8
PL -0.9 0.4 0.8 0.8 1.0 0.5 -0.1 -0.4 0.3 1.1 3.0 3.1
PT -0.1 0.0 0.1 0.3 0.3 0.5 -0.5 -0.1 -0.1 0.0 0.4 1.4
SI 0.4 0.7 -0.1 0.1 0.0 : -0.3 0.9 1.0 1.2 0.8 :
SK 5.4 -0.1 -1.2 -1.0 9.2 0.5 -0.6 4.3 3.4 3.0 6.7 7.3
FI 2.4 -0.4 4.0 1.7 0.0 1.6 0.5 -1.0 3.8 8.1 5.3 7.4
SE -0.7 3.8 1.5 0.4 -1.2 : 2.0 1.1 3.0 5.1 4.5 :
UK 0.0 0.2 0.2 0.4 0.3 : 1.5 1.2 0.9 0.8 1.2 :
BG 4.2 1.8 -6.3 6.4 7.5 2.3 24.3 29.0 3.0 5.7 9.5 9.8
RO -1.4 -1.3 -2.7 -1.9 24.9 -0.5 -6.6 -6.3 -7.3 -7.4 17.9 18.7
[image:6.595.50.554.461.755.2]Quarter on quarter growth rates, seasonally adjusted data Year on year growth rates, gross data
Figure 2: EMPLOYMENT INDEX FOR RETAIL TRADE, SEASONALLY ADJUSTED DATA, GROWTH RATES COMPARED
TO THE PREVIOUS QUARTER (%); SOURCE: EUROSTAT STS
E S S E N T I A L I N F O R M A T I O N – M E T H O D O L O G I C A L N O T E S
VOLUME OF SALES
The objective of the
volume of sales index
is to show the quantity
of goods sold in the retail trade sector. It is an indicator for final
domestic demand and provides information about consumer
confidence.
Its
legal basis
is the
Council Regulation for short-term statistics
1165/98 from 19 May 1998
1. Division 52 of the NACE Rev. 1
classification
2covers retailing.
The
volume of sales
3represents the value of turnover in constant
prices and as such it is a quantity index. It
can be calculated as
turnover at current prices, deflated by the deflator of sales, or as a
quantity index derived directly from the quantity of goods sold.
Turnover comprises the totals invoiced by the observation unit
during the reference period. This corresponds to market sales of
goods or services supplied to third parties. It includes all duties and
taxes on the goods or services invoiced by the unit with the
exception of the VAT invoiced by the unit vis-à-vis its customer and
other similar deductible taxes directly linked to turnover.
Member States are required
to transmit
gross and working-day
adjusted data to Eurostat and are encouraged to also send
seasonally adjusted and trend data. Eurostat calculates the
adjustment only if nationally adjusted data are not available.
Eurostat aggregates working-day adjusted data
from the
Member States in order
to compile the euro-zone and EU-25
series
. Seasonally adjusted euro-zone and EU-25 series are then
produced using TRAMO/SEATS. Missing components for the
euro-zone and EU-25 aggregates are estimated using an ARIMA method.
The
reference period
is the calendar month. Aggregate
data
should be transmitted to Eurostat no later than two months
after the end of the reference period. More detailed data have to be
transmitted within three months. This deadline may be extended by
15 more calendar days for those Member States whose value added
in Division 52 of NACE Rev. 1 represents less than 3% of the
Community total.
The
weights
used for aggregations are based on information from
the Structural Business Statistics database or on information coming
directly from the Member States. Weights and base year are revised
every five years.
The current base year is 2000.
EMPLOYMENT INDEX
The index shows the evolution of the number of persons employed
in the retail trade sector.
The
legal basis
is again the
Council Regulation for short-term
statistics 1165/98
from 19 May 1998.
1
Official Journal No L 162 of 5 June 1998. Also available via the Business Methods web-site: http://forum.europa.eu.int/Public/ irc/dsis/bmethods/home.
2
NACE Rev. 1 - Statistical classification of economic activities in the European Community, Eurostat, 1996 (ISBN 92-826-8767-8).
3
This abbreviated version of the definition of the volume of sales index