TopCap: A Tool to Quantify Soil Surface
Topology and Subsurface Structure
Amin Garbout, Craig J. Sturrock, Elena Armenise, Sujung
Ahn, Robert W. Simmons, Stefan Doerr, Karl Ritz,
and Sacha J. Mooney*
The surface of a material such as soil, as characterized by its topology and roughness, typically has a profound effect on its functional behavior. While nondestructive imaging techniques such as X-ray computed tomography (CT) have been used extensively in recent years to characterize the inter-nal architecture of soil, less attention has been paid to the morphology of the soil surface, possibly because other techniques such as scanning electron microscopy and atomic force microscopy are viewed as more appropriate. However, X-ray CT exploration of the surface of a soil also permits analyses immediately below its surface and beyond into the sam-ple, contingent on its thickness. This provides important information such as how a connected structure might permit solute infiltration or gaseous diffusion through the surface and beyond into the subsurface matrix. A previous limitation to this approach had been the inability to segment and quantify the actual three-dimensional structural complexity at the surface, rather than a predefined geometrically simplistic volume immediately below it. To overcome this, we formulated TopCap, a novel algorithm that operates with ImageJ as a plugin and automatically captures the actual three-dimensional surface morphology, segments the pore structure within the acquired volume, and provides a series of incisive morphological mea-surements of the associated porous architecture. TopCap provides rapid, automated analysis of the immediate surface of materials and beyond, and while developed in the context of soil, is applicable to any three-dimensional image volume.
Abbreviations: 2D, two-dimensional; 3D, three-dimensional; CT, computed tomogra-phy; GUI, graphical user interface; ROI, region of interest; SIOX, Simple Interactive Ob-ject Extraction.
The texture and roughness of a surface
are important factors controllingthe functional behavior of any material, such as its mechanical properties (Pyka et al., 2013; Mohamad et al., 2014), frictional behavior (Sahin et al., 2007), or fluid dynamics across the surface (Taylor et al., 2006). This is especially the case for a biomaterial such as soil, where the outer surface typically acts as a dynamic interface between the above- and belowground compartments. The surface structure of soil has profound functional con-sequences via its control of the movement and flow of gases, liquids, and solutes and can impact the emergence of germinating seedlings. The complexity of soil structure across a range of functional scales and depths is well known (Haygarth and Ritz, 2009); however, the physical structure of the immediate surface has remained remarkably understudied. The impact of rainfall on the soil surface can lead to a reduction in porosity and the for-mation of a soil crust or seal through particle detachment and rearrangement (Assouline and Mualem, 1997; Fohrer et al., 1999). An alternative source of crust development is microbial activity and subsequent enmeshment of materials at the soil surface, forming bio-crusts, which have been previously well researched under both arid and semiarid (e.g., Chamizo et al., 2012) and temperate conditions (Jeffery et al., 2007). In both cases, it is probable that a surface crust leads to a reduction in hydraulic conductivity and an increase in surface runoff and flooding, in addition to a poorer environment for plant emergence and establishment (Sandin et al., 2017).
Core Ideas
• A new ImageJ plugin, TopCap, automatically captures soil surface complexity from CT images.
• TopCap can quantify the immediate subsurface structure, highlighting soil crusting and sealing.
• Crust thickness varies under different soil textures following similar rainfall.
A. Garbout, Imaging and Analysis Centre (IAC), Natural History Museum, London SW7 5BD, UK; A. Garbout, C.J. Sturrock, K. Ritz, and S.J. Mooney, Divi-sion of Agriculture & Environmental Sciences, School of Biosciences, Univ. of Nottingham, Loughborough LE12 5RD, UK; E. Armenise, R.W. Simmons, and K. Ritz, School of Water Energy and Environment, Cranfield Univ., Cranfield MK43 0AL, UK; S. Ahn, Korea Forest Ser-vice, Seoul, Korea; S. Doerr, College of Science, Swansea Univ., Swansea SA2 8PP, UK. *Corresponding author ([email protected]).
Received 2 May 2017. Accepted 2 Oct. 2017. Supplemental material online.
Citation: Garbout, A., C.J. Sturrock, E. Armenise, S. Ahn, R.W. Simmons, S. Doerr, K. Ritz, and S.J. Mooney. 2018. TopCap: A tool to quantify soil surface topology and subsurface structure. Vadose Zone J. 17:170091. doi:10.2136/vzj2017.05.0091
Special Section: Noninvasive Imaging of Processes in Natural Porous Media
© Soil Science Society of America. This is an open access article distributed under the CC BY license
(https://creativecommons.org/licenses/ by/4.0/).
Within the material sciences and engineering sector, surface metrology plays a key role in quality control for manufacturing, especially with the increasing development of advanced compo-nents. The inspection and assessment of surface roughness can be performed by many different techniques (e.g., interferometry, microscopy, contact or laser profilometry) that have contrasting inherent capabilities but also limitations concerning the size of the samples (typically only at the millimeter scale) or the interaction of the instrument with the surface (Gao et al., 2008). For example, laser profilometry can quickly capture the surface of a material, but inaccuracies can occur due to atypical points captured when scanning due to the optical properties of the material (Rousseau et al., 2012). Furthermore, a surface with cracks or concavities can be difficult to measure due to limitations in access by the instru-ment probe.
Continuing developments in three-dimensional (3D) imaging and particularly tomographic techniques enable the internal visualiza-tion of materials at increasingly high resoluvisualiza-tions (nanometers to micrometers). The nondestructive nature of X-ray micro computed tomography (CT) has been applied to the analysis of the inner struc-ture of a wide range of biomaterials including plants (Garbout et al., 2011; Pajor et al., 2013), rocks (Zakirov et al., 2016), soils (Helliwell et al., 2013), and animals (Badea et al., 2008) and has also been used in many areas of industry for the internal inspection of components (Bull et al., 2013). X-ray CT has also been applied to the 3D measure-ment of surfaces of additive manufactured porous alloy materials (Kerckhofs et al., 2012; Pyka et al., 2014). Depending on the dimen-sions of the surface roughness, CT can be applied accurately and in
a robust manner for surface roughness quantification of 3D porous materials. Chinga-Carrasco et al. (2008) demonstrated the suit-ability of the technique as a method to assess coatings and surface properties of paper, with a performance comparable to atomic force microscopy or laser profilometry.
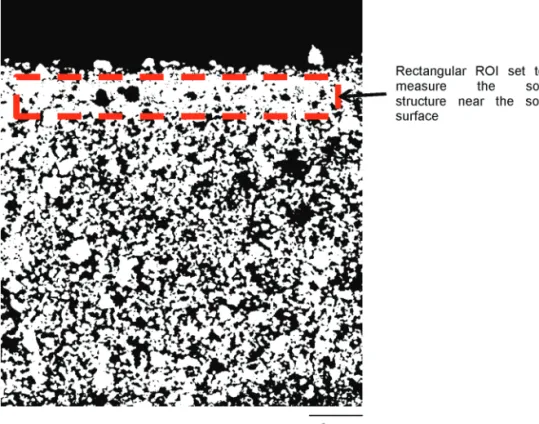
Unlike techniques limited to surface examination, there is great potential, especially in the biomaterial sciences, in the application of CT imaging to contribute to our understanding of the relation-ships between the surface topology and the functional properties of a material. One key goal would be the ability to quantify the structure at the immediate surface of a soil and link this with the behavior of the subsurface matrix. However, accurate quantifica-tion of soil surfaces with irregular, non-planar topologies have represented a major impediment to adoption of the technology because the uniformly sized region of interest (ROI) approach, commonly used in image analysis operations (Fig. 1), does not capture the complexity of the soil surface structure.
Alternative approaches to overcome this limitation include manual two-dimensional measurements of the structure near the surface using the intensity values of CT image pixels along a specified tran-sect (i.e., mapping changes in the X-ray attenuation of the material in a cross-section image). Riley et al. (2014) utilized a similar approach to visualize eggshell surface morphology. However, two-dimensional (2D) measurements of 3D media give an incomplete description of the true surface topography and then subsurface pore structure. Removing the non-planar surface from the analy-sis by “cropping” a new ROI in an image has been typically used as a solution to deal with the complex 3D surface geometry in many previous stud-ies (e.g., Helliwell et al., 2014; Tracy et al., 2015). In this approach, the image datasets are trimmed to remove regions based on the roughness, edge effects, or complexity. A key issue is that these regions are, in many cases, crucial interfaces or pathways, and removing them leads to a loss of important data that explain how a surface and internal structure are interconnected.
To overcome this, some approaches have been developed based on 3D object extrac-tion tools such as Simple Interactive Object Extraction (SIOX), a plugin developed and implemented under FIJI, a freeware image processing tool with a graphical user interface (GUI) (http://imagej.net/SIOX:_ Simple_Interactive_Object_Extraction). SIOX permits simple extraction of fore-ground objects from 2D images. This plugin is semiautomated and requires a modest interactive effort on the part of the user to Fig. 1. Example of a thresholded soil micro-CT image: A typical region of interest (ROI) cannot
avoid misclassification of the material surface. However, it cannot currently be applied to a stack of images, as is typically the require-ment for CT imagery, hence the procedure needs to be repeated for each slice or image, which is not preferable when the number of images per CT scan typically exceeds 2000.
In metrology, different image filtration techniques have been used that aim to separate the desirable and undesirable fea-tures in a surface topography dataset (De Chiffre et al., 2000). Application of mathematical morphology theory supported
the emergence of morphological filters and so-called “envelope” filtering systems (also known as E-systems) (Srinivasan, 1998; Scott, 2000). The E-system approach simulates the process of rolling a ball with a selected radius over the surface (von Weingraber, 1954). The envelope filter is relative to the geo-metrical properties of the surface and thus gives better results on the functional prediction of surfaces. Several algorithms have been developed using these approaches (Shunmugam and Radhakrishnan, 1974; Lou et al., 2011), each with some drawbacks. Primarily, these methods are either time consum-ing, especially for large datasets and structuring elements, or hard to extend to areal data. Furthermore, the maximum ball radius is typically limited in practice due to the associated huge computational requirement, while for many real applications, ball or disk radii much larger than the signal length are required (Jiang et al., 2011). Consequently, there is a need to develop tools able to extract surfaces automatically without significant user interaction to accurately segment the surface of a material from the background via a robust and repeatable methodology.
Here we introduce and describe TopCap (Topography Capture), a novel method formulated as a plugin tool for ImageJ, designed primarily to quantify the structure of the immediate, heteroge-neous surface of any material. We developed the method in the context of soil, generally considered to be the most biologically active and structurally complex component of the terrestrial bio-sphere (Ritz and Young, 2011). The plugin was designed primarily to accurately quantify the heterogeneity of pore morphology at the near and immediate surface of a material, accounting for the exact geometrical complexity as revealed by imagery of the actual surface rather than a predefined rectangular ROI. Using the concept of morphological operations, TopCap automatically:
ʶ detects and captures the material surface by iterative morpho-logical operations of dilatation and erosion in three dimensions;
ʶ defines sections parallel to the surface and measures the micro-structural characteristics;
ʶ collates the defined sections and pore geometry within each separated section; and
ʶ calculates the total pore volume, porosity, and other pore mor-phological measurements within each of the defined sections.
6
Materials and Methods
X-ray Computed Tomography
The soil samples used in this work were scanned using a Phoenix Nanotom 180NF system (GE Sensing & Inspection Technologies). The scanner consisted of a 180-kV nanofocus X-ray tube fitted with a diamond transmission target and a five-megapixel flat panel detector (Hamamatsu Photonics). A maximum X-ray energy of 130 kV and 100 mA current was used to scan each soil core. A total of 1440 projection images were acquired throughout a 360° rota-tion. Typical scan time was around 50 min per core. Resolution varied between scans and is stated where relevant. Reconstruction of the projection images was used to produce 3D volumetric datasets using the software datos|rec (GE Sensing & Inspection Technologies). The reconstructed CT volumes were visualized and resized in VGStudio Max 2.1 prior to the assessment of the soil surfaces.
Mathematical Description
Detection of the Boundaries of the Surface
To extract the boundary pixels of a foreground structure such as the extreme soil surface (Fig. 2), a morphological filtering approach was adopted (Lou et al., 2013). Morphological filtering consists of a defined series of operators that transform an image (I) by probing it with a predefined shape or structuring element (H). In TopCap, a 3 by 3 structuring element was used. Two of the most fundamental operations within a morphological filtering approach are dilation and erosion (Burger and Burge, 2016), and essentially all other morphological operations are generally built from a combination of these two. Conventionally, A Å B corre-sponds to the dilation of A by B and A $ B to the erosion of A by B. In binary images, dilation is an operation that increases the size of foreground objects. It is defined as
(
)
{
| for some and}
I HÅ º p q+ p IÎ q HÎ [1]
where p is an element (pixel) from the image space I to which is added an element q from H (the structural element). One of the basic applications of dilation is to bridge gaps and connect objects. In con-trast, erosion is an operation that increases the size of background objects (and shrinks the foreground objects) in binary images:
(
)
{
2 | , for every}
I H º pÎ p q+ ÎI q HÎ [2]
The consequence of Eq. [2] is that the background regions grow in size and foreground features tend to disconnect or further sepa-rate. Further erosion results in more growth of the background or shrinking of the foreground.
together in composite operations referred to as opening and closing. TopCap offers the possibility of setting the desired sequence of dilations and erosions.
We composed our filter by repeated application of the structuring element H. This removes holes and fissures in the foreground structure that are smaller than H multiplied by n (the number of iterations of H). This permits the extraction of the boundary of the foreground object surface. The background pixels enclosed in the foreground structure are removed after the dilation sequence with a particle sizing filter (Abràmoff et al., 2004). This method is more accurate than a convex hull filter to obtain the boundary of an object surface. The detection of surfaces permits labeling the background image black. The foreground pixels are labeled white, as well as the background pixels included in the fore-ground image.
Interval Sections Parallel to the Surface
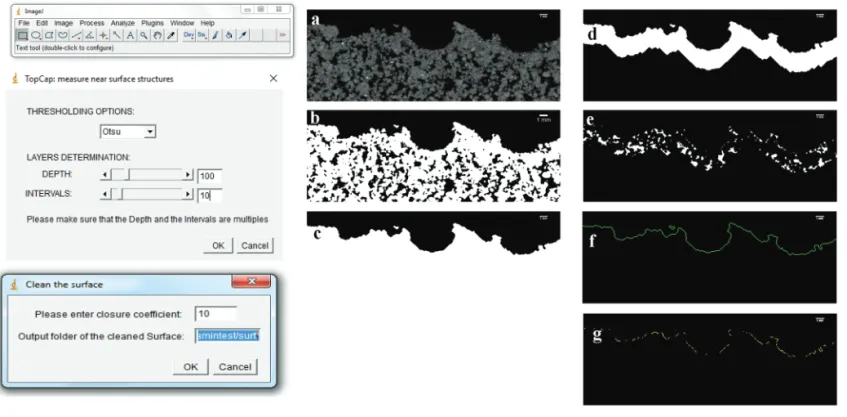
The extraction of the boundary of the soil surface is achieved by the application of successive dilation operations (as explained above) followed by filtration of the pores in the soil and then iterative erosion. Sections parallel to the surface are obtained by iterative erosions of the foreground image. The numbers of ero-sions are specified by the user in the GUI (Fig. 2). The obtained masks for each section, and the pores within each section are then saved in a specified folder (Fig. 2d and 2e), allowing examination of the pore space at specific separate soil depths.
Theoretical Validation
To validate TopCap, our first approach was to generate a series of artificial images, which comprised 128 stacked images of 10 by 500 by 10 pixels representing a single white rectangle (with a width of 10 pixels) on a black background (Fig. 3). The position (x, y) of each
rectangle in each of the 128 stacked images was set as
( )
sin 10
500 ; with 0 128 11
u
L= éêê + ùúú < <u
ë û [3]
0 and 500
x= y= -L
where u is the slice number and L is the distance from the bottom of the image to the rectangle.
slices. The volume of the section (M) located from the surface to the 30-voxel depth was calculated as M = 30S. The output of the plugin and the predicted properties were very similar, even when the holes were one-pixel width.
6
Results and Discussion
Comparison of TopCap
with Other Approaches
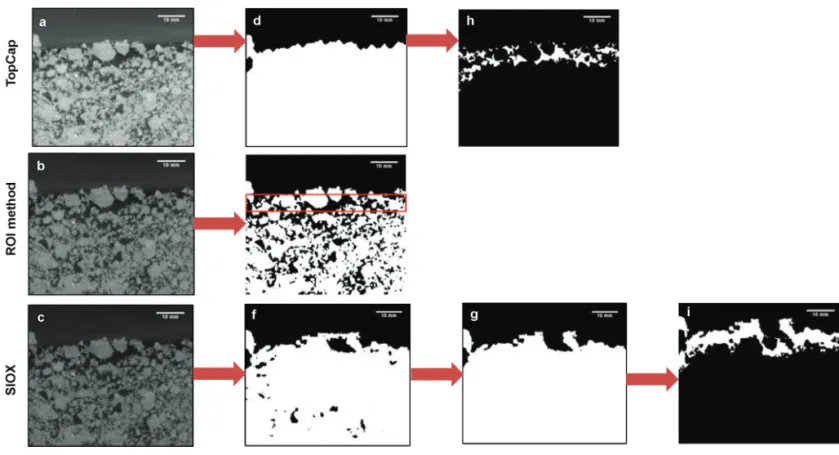
The output from TopCap was compared with two other methods routinely applied to similar studies, namely selection of a rectan-gular ROI and SIOX. Each tool was used to identify or segment the soil surface and calculate the porosity associated with differ-ent depth intervals from the surface to a maximum of 6.7 mm or 50 voxels (Fig. 4). This particular soil surface was used due to its complexity, with a significant number of visible surface cracks and
numerous biopores. Fifty image slices with a spatial resolution of 134 mm were used for the test.
After segmentation, the ROI method, as shown in Fig. 1, con-sisted of selecting a first rectangular ROI as near as possible to the surface and measuring the porosity within the selec-tion. Subsequent rectangles were then selected below the first selection to assess porosity with depth. The rectangular selec-tion does not offer the possibility of capturing the soil surface without selecting background pixels and overestimating the porosity nearest the surface; it also needs to be repeated for each slice. TopCap was tested on the same soil, following the method described in the Technical Manual (see below), where the surface was captured automatically, as was the porosity in three dimensions, for the different intervals or depths within seconds (Fig. 4d and 4h). Minimal user input was required, and the whole process took approximately 10 min (for comparison, Fig. 3. Validation images with holes of (a) one-, (b) two-, and (c) six-pixel width used to test TopCap; (d) porosity measured within depth with different intervals, showing three peaks corresponding to the distance of pores to the surface; and (e) image with holes of six-pixel width showing the surface in white and detected pores in different colors according to their distance from the surface.
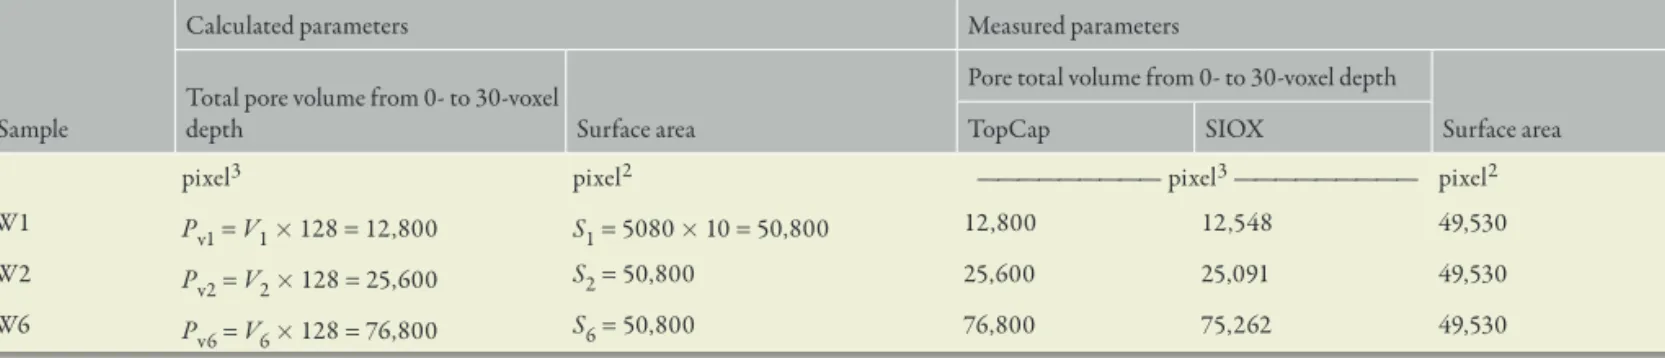
Table 1. Comparison of measurements by TopCap and Simple Interactive Object Extraction (SIOX): three samples with rectangular holes W1, W2, and W6 with one-, two-, and six-pixel widths and volumes V1, V2, and V3, respectively, and selecting Interval = 1 and Depth = 40.
Sample
Calculated parameters Measured parameters
Total pore volume from 0- to 30-voxel
depth Surface area
Pore total volume from 0- to 30-voxel depth
Surface area
TopCap SIOX
pixel3 pixel2 ————————— pixel3 ————————— pixel2
assessment of the artificial structure took about 2 min) using the computer configuration described below. SIOX was also able to automatically extract the soil surface, however, and impor-tantly, only in two dimensions, and thus it had to be repeated for each image or slice unless a macro can be created to auto-mate the process. Also with SIOX, there is an additional step that requires manual input to remove the black pixels within the mask (Fig. 4f and 4g), whereas this step is automatic with TopCap. The operation via SIOX took approximately 1 h (for comparison, assessment of the artificial structure took about10 min). Qualitative analysis shows that the final surface extracted by SIOX was not as accurate as TopCap, as it was unable to handle the irregularity of the soil surface adequately (Fig. 4d
and 4g). This has important implications for the subsequent porosity analysis, which visually appears to be overestimated by SIOX compared with TopCap (Fig. 4h and 4i). In addition, the opportunity to quantify porosity at specified depth intervals is not available automatically within SIOX. For comparative purposes, we undertook a transect-style analysis of porosity at approximately 130-mm depth intervals to a depth of 0.67 mm for each method (Fig. 5), where the overestimation of the poros-ity within the crust area seen in Fig. 4 is clearly demonstrated. For comparative purposes, a similar analysis to that shown in Fig. 5 was undertaken on the artificial structures and presented in Supplemental Fig. 1 and Table 1, showing greater complementar-ity than with the soil surfaces examined.
Fig. 4. Evaluation of soil surface detection and measurement of porosity by TopCap, the region of interest (ROI) approach, and Simple Interactive Object Extraction (SIOX): (a,b,c) the original grayscale images are converted to a binary mask by (d) TopCap, (e) the ROI method, and (f ) SIOX. Note that the ROI method does not capture the complexity of the soil surface; successive ROI images are needed to measure porosity at different depths; (g) the SIOX approach requires a further step to manually remove the black pixels within the soil before obtaining the final surface mask as pre-viously shown by TopCap in (d). The final extracted porosity of the immediate soil surface is shown for (h) TopCap and (i) SIOX. One voxel = 74 mm.
Demonstration of TopCap
on Different Soil Types
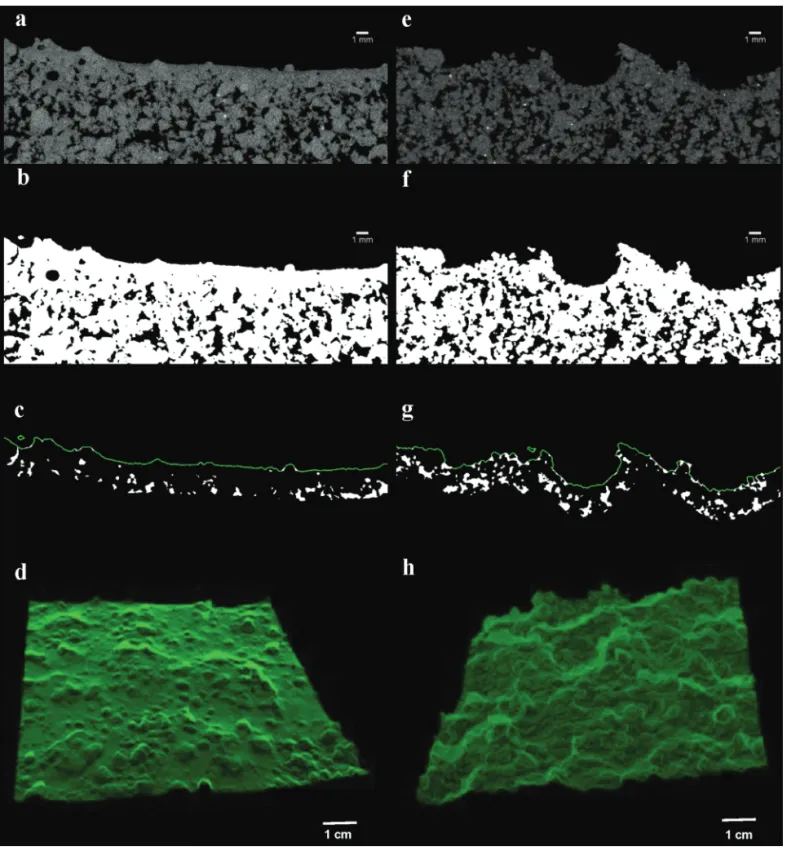
TopCap was tested on two texturally contrasting, crust-susceptible soils. A silty clay loam from Butterwick, Lincolnshire (52°59¢12² N, 0°3¢33² E) classified as the Wisbech series (Soil Survey of England and Wales) and a sandy loam from the Eardiston series sampled from Coughton, Ross-on-Wye, Herefordshire (51°53¢43² N, 2°33¢50² W). The qualitative and quantitative results (Fig. 6 and 7,
respectively) obtained from TopCap revealed a clear soil crust at the surface and an initial decrease in porosity at the immediate surface corresponding to the variable surface roughness between the soil types. Crucially, this demonstrated the presence of a physi-cal crust at the immediate surface not measurable by alternative approaches. The soil crust was clearly thicker in the silty clay loam soil, and a visual inspection of the CT images (Fig. 6a, 6b, and 6c) showed the considerable difference in porosity between the
near-surface and below-surface material, as low as 4% of the total volume (Fig. 7). The sandy loam soil had a thinner crust with a greater porosity at the immediate surface compared with the silty clay loam soil (Fig. 6e, 6f, and 6g), with the lowest porosity ?9% of the total volume (Fig. 7). Further morphological data shown in Table 2 illustrates that the total pore volume and surface area were lower in the silty clay loam, highlighting development of the crust, whereas the surface area index (the surface area of the measured surface compared with that of a perfectly flat and smooth surface) was smaller for the sandy soil loam than for the silty clay loam, sug-gesting greater surface roughness for the sandy soil. These support results from a parallel experiment on the same soil types, sampled at the same time, where crusts formed more readily in the silty clay loam soils when subjected to variations in rainfall intensity, leading to significant reductions in unsaturated hydraulic con-ductivity compared with the sandy loam soil (Armenise et al., 2018; Supplemental Fig. S1). A limitation here is that the porosity derived by imagery cannot be validated by physical measurements due to the high resolution and small volumes considered. However, this approach will ultimately support efforts to improve our under-standing of the physical processes affected by surface crusts and permits the characterization of the dynamics of soil crust devel-opment through repeated CT scanning experiments. While the differences between the two soils explored here are considerable,
it is worth noting that these soil surfaces were generated under experimental conditions on sieved soils repacked into columns at the same bulk density. One would expect the soil surfaces under field conditions to vary more than in the example we have provided here. However, we have confirmed that TopCap is applicable to all forms of soil surface by testing it on field-structured soils such as a sandy loam soil that had been tilled 6 mo before sampling and where earthworm activity was observed (Supplemental Fig. S3).
Advantages and Limitations
TopCap permits exploration of both 2D and 3D data with mini-mal user input. There is flexibility to vary the ball radius, which enhances the applicability of the morphological filtering, allowing it to be used across a range of nonuniform surfaces. By developing TopCap as an ImageJ macro, the processing of a high number of samples or image slices (?1000–2000 per scan) in a fully auto-mated way with minimal user input is possible. As an example, one image stack of 400 images in a 400- by 130-pixel array was processed in 100 s (via a personal computer with the following specifications: processor Intel Xeon CPU E5-2630, with 128 GB of RAM and a Quadro K5000 graphics card).
Despite the possibility offered to increase the radius of the ball by adjusting the coefficient of closure to filter the surface and extract Fig. 7. Pores volumes measured for 100-voxel depth with a binning of 10 voxels for two soil samples. Plots are from the results obtained after selecting the options DEPTH = 100 and INTERVALS = 10: (A) silty clay loam soil surface; (B) sandy loam soil surface.
Table 2. Example of TopCap morphological measurements for the silty clay loam (Soil 1) and sandy loam (Soil 2) soils. The mask volume and the total pore volume were calculated for a 100-voxel depth. For comparative purposes, the physically derived total porosity of both soils packed to 1.2 g cm−3 was 0.55 mm3 mm−3.
Soil sample
Measured parameters
Total pore volume Mask volume Porosity Projected surface Surface area Surface of cavities Cavities ratio SAI† ——————— mm3 ——————— mm3 mm−3 ———————————— mm2 ———————————— mm2 mm−2
Soil 1 240 2338 0.103 352 1007 138 0.138 0.349
Soil 2 326 2455 0.133 352 1230 472 0.383 0.286
it, caution must be used to minimize user bias because choosing a high coefficient will reduce the precision of the surface detection and thus the measure of roughness. Furthermore, in cases where the images have a low contrast, the Otsu thresholding algorithm as used for the soil samples here may be suboptimal, so a further preprocessing step may be invoked before using the plugin. We would recommend that TopCap users explore other thresholding algorithms available in ImageJ in these circumstances. The selection of the closure coefficient is important because it conditions how the plugin will accurately capture the surface. The coefficient should be selected by measuring the diameter of the largest gap or pore at the surface on a 2D slice image, and the optimal coefficient should not exceed more than half of the measured distance. A high closure coefficient will tend to overestimate the porosity near the surface and smooth the surface, losing details about the soil surface rough-ness (Supplemental Fig. S4). The porosity for the first 10 voxels for a closure coefficient of 16 was 48%, dropping to 40% in the interval 10 to 20 voxels below the surface. This can be explained by the fact that background pixels were included in the pore space. However, a low coefficient will not allow detection of the surface because gaps and pores at the surface would not be closed; therefore, the coef-ficient should be chosen carefully and with parsimony. For other user-defined parameters such as DEPTH and INTERVALS, it is not necessary to consider minimizing user bias.
6
Conclusions
We have developed TopCap, a new algorithm to automatically cap-ture, segment, and measure the 3D morphological properties of the immediate soil surface, providing several benefits over preexisting methods for soil surface segmentation for a range of different soil types. The data obtained have the potential to provide an unprec-edented insight into the biophysical properties and functioning of the soil surface. The surface of a soil remains a crucial but often ignored interface, although it is usually the initiation site of impor-tant processes concerning the transport and exchange of gases and liquids. Tools such as TopCap offer the potential to examine the mechanisms behind such behavior in ways generally not considered possible until now. In addition, TopCap could be applied to a wider range of materials where the complexity of the 3D surface and its immediate below-surface porosity has implications for behavior and function, such as plant leaves, where the position of the sto-mata and guard cells in relation to the overall lower epidermis are important for gaseous transport.
Supplemental Material
Supplement 1 contains four supplemental figures. Supplemental Fig. S1 shows a comparison of the output from (A) SIOX and (B) TopCap on porosity for three depth intervals (0–10, 10–20, and 20–30) and three pixel hole sizes (1, 2, and 6); Fig. S2 shows the effect of rainfall duration and soil type on the unsaturated hydraulic conductivity (Kun); Fig. S3 shows an example of the output from TopCap from an undisturbed field soil; and Fig. S4 shows the effect of different closure coefficients (8–16)
on the soil porosity as a function of depth. Supplement 2 contains the TopCap technical manual, and Supplement 3 contains the source code for the TopCap Plugin.
Acknowledgments
This work was supported by the Biotechnology and Biological Sciences Research Council [grant numbers BB/J006092/1, BB/J006793/1] UK, both of which were also partly support-ed by the UK Department of Environment, Food and Rural Affairs under the Government Partnership Award scheme. Sacha J. Mooney and Craig J. Sturrock are supported by the ERC Futureroots project.
References
Abràmoff, M.D., P.J. Magalhães, and S.J. Ram. 2004. Image processing with ImageJ. Biophotonics Int. 11:36–41.
Armenise, E., R.W. Simmons, S. Ahn, A. Garbout, S.H. Doerr, S.J. Mooney, et al. 2018. Soil seal development under simulated rainfall: Structural, physical and hydrological dynamics. J. Hydrol. 556:211–219. doi:10.1016/j.jhydrol.2017.10.073
Assouline, S., and Y. Mualem. 1997. Modeling the dynamics of seal formation and its effect on infiltration as related to soil and rainfall characteristics. Water Resour. Res. 33:1527–1536.
Badea, C.T., M. Drangova, D.W. Holdsworth, and G.A. Johnson. 2008. In vivo small-animal imaging using micro-CT and digital subtraction angiography. Phys. Med. Biol. 53:R319–R350. doi:10.1088/0031-9155/53/19/R01
Bull, D.J., L. Helfen, I. Sinclair, S. Spearing, and T. Baumbach. 2013. A comparison of multi-scale 3D X-ray tomographic inspection techniques for assessing carbon fibre composite impact damage. Compos. Sci. Technol. 75:55–61. doi:10.1016/j.compscitech.2012.12.006
Burger, W., and M.J. Burge. 2016. Digital image processing: An algorithmic introduction using Java. 2nd ed. Springer, London. doi:10.1007/978-1-4471-6684-9
Chamizo, S., Y. Canton, I. Miralles, and F. Domingo. 2012. Biological soil crust development affects physicochemical characteristics of soil surface in semiarid ecosystems. Soil Biol. Biochem. 49:96–105. doi:10.1016/j.soilbio.2012.02.017
Chinga-Carrasco, G., H. Kauko, M. Myllys, J. Timonen, B. Wang, M. Zhou, and J.O. Fossum. 2008. New advances in the 3D characterization of mineral coating layers on paper. J. Microsc. 232:212–224. doi:10.1111/j.1365-2818.2008.02092.x
De Chiffre, L., P. Lonardo, H. Trumpold, D.A. Lucca, G. Goch, C.A. Brown, et al. 2000. Quantitative characterisation of surface texture. CIRP Ann. 49:635–642, 644–652. doi:10.1016/S0007-8506(07)63458-1
Fohrer, N., J. Berkenhagen, J.M. Hecker, and A. Rudolph. 1999. Changing soil and surface conditions during rainfall: Single rainstorm/subsequent rainstorms. Catena 37:355–375. doi:10.1016/S0341-8162(99)00026-0 Gao, G., R.K. Leach, J. Petzing, and J.M. Coupland. 2008.
Surface measurement errors using commercial scanning white light interferometers. Meas. Sci. Technol. 19:015303. doi:10.1088/0957-0233/19/1/015303
Garbout, A., L.J. Munkholm, S.B. Hansen, B.M. Petersen, O.L. Munk, and R. Pajor. 2011. The use of PET/CT scanning technique for 3D visualization and quantification of real-time soil/plant interactions. Plant Soil 352:113–127. doi:10.1007/s11104-011-0983-8
Haygarth, P.M., and K. Ritz. 2009. The future of soils and land use in the UK: Soil systems for the provision of land-based ecosystem services. Land Use Policy 26:S187–S197. doi:10.1016/j.landusepol.2009.09.016 Helliwell, J.R., A.J. Miller, W.R. Whalley, S.J. Mooney, and C.J. Sturrock.
2014. Quantifying the impact of microbes on soil structural development and behaviour in wet soils. Soil Biol. Biochem. 74:138– 147. doi:10.1016/j.soilbio.2014.03.009
Helliwell, J.R., C.J. Sturrock, K.M. Grayling, S.R. Tracy, R.J. Flavel, I.M. Young, et al. 2013. Applications of X-ray computed tomography for examining biophysical interactions and structural development in soil systems: A review. Eur. J. Soil Sci. 64:279–297. doi:10.1111/ejss.12028 Jeffery, S., J.A. Harris, R.J. Rickson, and K. Ritz. 2007. Microbial community
phenotypic profiles change markedly with depth within the first centimetre of the arable soil surface. Soil Biol. Biochem. 39:1226–1229. doi:10.1016/j.soilbio.2006.12.023
2012. High-resolution microfocus X-ray computed tomography for 3D surface roughness measurements of additive manufactured porous materials. Adv. Eng. Mater. 15:153–158. doi:10.1002/adem.201200156 Lou, S., X. Jiang, and P.J. Scott. 2011. Fast algorithm for morphological filters.
J. Phys. Conf. Ser. 311:012001. doi:10.1088/1742-6596/311/1/012001 Lou, S., X. Jiang, and P.J. Scott. 2013. Geometric computation theory
for morphological filtering on freeform surfaces. Proc. R. Soc. A 469:20130150. doi:10.1098/rspa.2013.0150
Mohamad, M., H.F.A. Marzuki, E.A.E. Ubaidillah, M.F.Z. Abidin, S. Omar, and I.M. Rozi. 2014. Effect of surface roughness on mechanical properties of aluminium–carbon laminates composites. Adv. Mat. Res. 879:51–57.
Pajor, R., A. Fleming, C.P. Osborne, S.A. Rolfe, C.J. Sturrock, and S.J. Mooney. 2013. Seeing space: Visualization and quantification of plant leaf structure using X-ray micro-computed tomography: Viewpoint. J. Exp. Bot. 64:385–390. doi:10.1093/jxb/ers392
Pyka, G., G. Kerckhofs, I. Papantoniou, M. Speirs, J. Schrooten, and M. Wevers. 2013. Surface roughness and morphology customization of additive manufactured open porous Ti6Al4V structures. Materials 6:4737–4757. doi:10.3390/ma6104737
Pyka, G., G. Kerckhofs, J. Schrooten, and M. Wevers. 2014. The effect of spatial micro-CT image resolution and surface complexity on the morphological 3D analysis of open porous structures. Mater. Charact. 87:104–115. doi:10.1016/j.matchar.2013.11.004
Riley, A., C.J. Sturrock, S.J. Mooney, and M.R. Luck. 2014. Quantification of eggshell microstructure using X-ray micro computed tomography. Br. Poult. Sci. 55:311–320. doi:10.1080/00071668.2014.924093
Ritz, K., and I.M. Young, editors. 2011. Architecture and biology of soils. CAB Int., Wallingford, UK.
Rousseau, B., P. Rivard, A. Marache, G. Ballivy, and J. Riss. 2012. Limitations of laser profilometry in measuring surface topography of polycrystalline rocks. Int. J. Rock Mech. Min. Sci. 52:56–60.
doi:10.1016/j.ijrmms.2012.03.003
Sahin, M., C.S. Çetinarslan, and H.E. Akata. 2007. Effect of surface roughness on friction coefficients during upsetting processes for different materials. Mater. Des. 28:633–640. doi:10.1016/j.matdes.2005.07.019 Sandin, M., J. Koestel, N. Jarvis, and M. Larsbo. 2017. Post-tillage
evolution of structural pore space and saturated and near-saturated hydraulic conductivity in a clay loam soil. Soil Tillage Res. 165:161–168. doi:10.1016/j.still.2016.08.004
Scott, P.J. 2000. Scale-space techniques. In: Proceedings of the 10th International Colloquium on Surfaces, Chemnitz, Germany. 31 Jan.–1 Feb. 2000. Chemnitz Univ. of Technology, Chemnitz. p. 153–161. Shunmugam, M.S., and V. Radhakrishnan. 1974. Computation of the
three-dimensional envelope for roughness measurement. Int. J. Mach. Tool Des. Res. 14:211–216. doi:10.1016/0020-7357(74)90028-6
Srinivasan, V. 1998. Discrete morphological filters for metrology. In: P.H. Osanna et al., editors, Proceedings of the 6th ISMQC Imeko Symposium on Metrology for Quality Control in Production, Vienna. 8–10 Sept. 1998. Abteilung Austauschbau und Messtechnik, Technische Univ. Wien, Vienna. p. 623–628.
Taylor, J.B., A.L. Carrano, and S.G. Kandlikar. 2006. Characterization of the effect of surface roughness and texture on fluid flow: Past, present, and future. Int. J. Therm. Sci. 45:962–968. doi:10.1016/j.ijthermalsci.2006.01.004
Tracy, S.R., K.R. Daly, C.J. Sturrock, N.M.J. Crout, S.J. Mooney, and T. Roose. 2015. Three-dimensional quantification of soil hydraulic properties using X-ray computed tomography and image-based modeling. Water Resour. Res. 51:1006–1022. doi:10.1002/2014WR016020
von Weingraber, H. 1954. Zur Definition der Oberflächenrauheit. In: Werkstattstechnik Maschinenbau. Springer, Berlin.