David Duffy
Kieran McQuinn
David Byrne
Ciara Morley
Spring 2015
The
Economic
Research
Institute
was
founded
in
Dublin
in
1960,
with
the
assistance
of
a
grant
from
the
Ford
Foundation
of
New
York.
In
1966
the
remit
of
the
Institute
was
expanded
to
include
social
research,
resulting
in
the
Institute
being
renamed
The
Economic
and
Social
Research
Institute
(ESRI).
In
2010
the
Institute
entered
into
a
strategic
research
alliance
with
Trinity
College
Dublin,
while
retaining
its
status
as
an
independent
research
institute.
The
ESRI
is
governed
by
an
independent
Council
which
acts
as
the
board
of
the
Institute
with
responsibility
for
guaranteeing
its
independence
and
integrity.
The
Institute’s
research
strategy
is
determined
by
the
Council
in
association
with
the
Director
and
staff.
The
research
agenda
seeks
to
contribute
to
three
overarching
and
interconnected
goals,
namely,
economic
growth,
social
progress
and
environmental
sustainability.
The
Institute’s
research
is
disseminated
through
international
and
national
peer
reviewed
journals
and
books,
in
reports
and
books
published
directly
by
the
Institute
itself
and
in
the
Institute’s
working
paper
series.
Researchers
are
responsible
for
the
accuracy
of
their
research.
All
ESRI
books
and
reports
are
peer
reviewed
and
these
publications
and
the
ESRI’s
working
papers
can
be
downloaded
from
the
ESRI
website
at
www.esri.ie
The
Institute’s
research
is
funded
from
a
variety
of
sources
including:
an
annual
grant
‐
in
‐
aid
from
the
Irish
Government;
competitive
research
grants
(both
Irish
and
international);
support
for
agreed
programmes
from
government
departments/agencies
and
commissioned
research
projects
from
public
sector
bodies.
Sponsorship
of
the
Institute’s
activities
by
Irish
business
and
membership
subscriptions
provide
a
minor
source
of
additional
income.
Quarterly
Economic
Commentary
The
Quarterly
Economic
Commentary
analyses
current
economic
trends
and
provides
macro
‐
economic
forecasts
for
the
current
and
following
year.
It
assesses
international
economic
prospects
and
provides
short
‐
term
forecasts
in
the
framework
of
a
consistent
set
of
national
accounts
for
Ireland.
Its
wide
range
of
users
includes
government
departments,
policy
‐
makers,
social
partners,
international
organisations,
academics
and
the
national
and
international
financial
sectors.
Research
Bulletin
The
Research
Bulletin
provides
short
summaries
of
work
published
by
ESRI
staff
and
overviews
of
thematic
areas
covered
by
ESRI
programmes
of
research.
Bulletin
articles
are
designed
to
be
easily
accessible
to
a
wide
readership.
A
reference
or
references
to
the
full
publication
is
included
at
the
end
of
each
Bulletin
article.
An
archive
of
bulletin
articles
will
be
found
at
www.esri.ie/bulletin
Quarterly Economic
Commentary
David Duffy Kieran McQuinn David Byrne Ciara Morley
Spring 2015
The forecasts in this Commentary are based on data available by 12 March 2015. Draft completed 19 March 2015
Special Articles
Research Notes
The Commentary is edited by Kieran McQuinn and David Duffy. Kieran McQuinn is an Associate Research Professor, David Duffy is a Senior Research Officer, David Byrne and Ciara Morley are Research Assistants at the Economic and Social Research Institute (ESRI).
The Quarterly Economic Commentary has been accepted for publication by the Institute, which does not itself take institutional policy positions. It has been peer reviewed by ESRI research colleagues prior to publication. The authors are solely responsible for the content and the views expressed.
Special Articles are published in the QEC in order to foster high-quality debate on various aspects of the Irish economy and Irish economic policy. They are subject to refereeing prior to publication.
Table of Contents
Summary Table ... ii
National Accounts 2014, 2015, 2016 ...iii
CHAPTERS The Irish Economy - Forecast Overview and Summary ... 1
The International Economy ... 3
The Domestic Economy ... 10
General Assessment ... 27
Detailed Forecast Tables ... 31
APPENDIX Nowcasting Appendix ... 37
RESEARCH NOTES “The Irish Electricity Market: New Regulation to Preserve Competition” ... 41
Summary Table
2012 2013 2014 2015 2016 Output (Real Annual Growth %)
Private Consumer Expenditure -1.2 -0.8 1.1 2.0 2.4
Public Net Current Expenditure -2.1 1.4 0.1 0.5 0.7
Investment 5.0 -2.4 11.3 12.5 9.2
Exports 4.7 1.1 12.6 5.1 4.5
Imports 6.9 0.6 13.2 4.4 4.6
Gross Domestic Product (GDP) -0.3 0.2 4.8 4.4 3.7
Gross National Product (GNP) 1.1 3.3 5.2 4.1 3.5
Prices (Annual Growth %)
Consumer Price Index (CPI) 1.7 0.5 0.2 0.1 1.0
Growth in Average Hourly Earnings 0.9 2.4 0.0 1.0 1.0
Labour Market
Employment Levels (ILO basis (000s)) 1,843 1,880 1,914 1,964 2,019
Unemployment Levels (ILO basis (000s)) 316 282 243 211 185
Unemployment Rate (as % of Labour Force) 14.7 13.1 11.3 9.7 8.4
Public Finance
General Government Balance (€ bn) -13.9 -10.0 -6.8 -4.5 -0.6
General Government Balance (% of GDP) -8.0 -5.7 -3.7 -2.3 -0.3
General Government Debt (% of GDP) 121.7 123.3 109.6 106.5 101.3
External Trade
Balance of Payments Current Account (€ bn) 1.5 6.6 10.5 13.4 15.2
Current Account (% of GNP) 1.0 4.5 6.6 7.9 8.5
Demand
Final Demand 2.4 0.5 8.8 4.4 4.1
Domestic Demand -0.6 -0.3 3.6 3.4 3.6
National Accounts 2014
A: Expenditure on Gross National Product
2013 2014 Change in 2014
€ bn € bn Value Price Volume
Private Consumer Expenditure 83.3 85.6 2.7 1.6 1.1
Public Net Current Expenditure 26.0 26.0 0.0 -0.1 0.1
Gross Fixed Capital Formation 26.5 30.4 14.5 2.9 11.3
Exports of Goods and Services 184.1 207.8 12.9 0.3 12.6
Physical Changes in Stocks 0.8 1.8
Final Demand 320.7 351.6 9.6 0.8 8.8
less:
Imports of Goods and Services 147.7 168.1 13.8 0.6 13.2
Statistical Discrepancy 1.8 1.9
GDP at Market Prices 174.8 185.4 6.1 1.2 4.8
Net Factor Payments -27.3 -27.0
GNP at Market Prices 147.5 158.4 7.4 2.1 5.2
B: Gross National Product by Origin
2013 2014 Change in 2014
€ bn € bn € bn %
Agriculture 3.0 3.1 0.1 2.5
Non-Agriculture: Wages, etc. 71.9 73.1 1.3 1.8
Other 61.1 68.4 7.2 11.8
Adjustments: Stock Appreciation 0.6 0.6
Statistical Discrepancy -1.8 -1.9
Net Domestic Product 134.8 143.3 8.5 6.3
Net Factor Payments -27.3 -27.0 0.3 -1.1
National Income 107.5 116.3 8.8 8.2
Depreciation 23.7 24.0 0.3 1.4
GNP at Factor Cost 131.2 140.3 9.1 7.0
Taxes less Subsidies 16.3 18.1 1.8 11.1
GNP at Market Prices 147.5 158.4 10.9 7.4
C: Balance of Payments on Current Account
2013 2014 Change in 2014
€ bn € bn € bn
X - M 36.4 39.7 3.3
F -27.3 -27.0 0.3
Net Transfers -2.5 -2.3 0.2
Balance on Current Account 6.6 10.5 3.9
National Accounts 2015
A: Expenditure on Gross National Product
2014 2015 Change in 2015
€ bn € bn Value Price Volume
Private Consumer Expenditure 85.6 88.7 3.6 1.6 2.0
Public Net Current Expenditure 26.0 25.9 -0.1 -0.6 0.5
Gross Fixed Capital Formation 30.4 34.9 14.8 2.1 12.5
Exports of Goods and Services 207.8 220.7 6.2 1.0 5.1
Physical Changes in Stocks 1.8 1.0
Final Demand 351.6 371.3 5.6 1.1 4.4
less:
Imports of Goods and Services 168.1 176.0 4.7 0.4 4.4
Statistical Discrepancy 1.9 1.9
GDP at Market Prices 185.4 197.1 6.3 1.8 4.4
Net Factor Payments -27.0 -28.9
GNP at Market Prices 158.4 168.2 6.2 2.0 4.1
B: Gross National Product by Origin
2014 2015 Change in 2015
€ bn € bn € bn %
Agriculture 3.1 3.2 0.1 2.5
Non-Agriculture: Wages, etc. 73.1 76.1 2.9 4.0
Other 68.4 76.0 7.7 11.2
Adjustments: Stock Appreciation 0.6 0.6
Statistical Discrepancy -1.9 -1.9
Net Domestic Product 143.3 154.0 10.7 7.4
Net Factor Payments -27.0 -28.9 -1.9 7.1
National Income 116.3 125.1 8.7 7.5
Depreciation 24.0 25.0 1.0 4.2
GNP at Factor Cost 140.3 150.1 9.7 6.9
Taxes less Subsidies 18.1 18.1 0.0 0.1
GNP at Market Prices 158.4 168.2 9.8 6.2
C: Balance of Payments on Current Account
2014 2015 Change in 2015
€ bn € bn € bn
X - M 39.7 44.6 4.9
F -27.0 -28.9 -1.9
Net Transfers -2.3 -2.4 -0.1
Balance on Current Account 10.5 13.3 2.9
National Accounts 2016
A: Expenditure on Gross National Product
2015 2016 Change in 2016
€ bn € bn Value Price Volume
Private Consumer Expenditure 88.7 92.2 3.9 1.5 2.4
Public Net Current Expenditure 25.9 26.3 1.3 1.0 0.7
Gross Fixed Capital Formation 34.9 39.1 12.1 2.7 9.2
Exports of Goods and Services 220.7 233.0 5.6 1.1 4.5
Physical Changes in Stocks 1.0 1.0
Final Demand 371.3 391.6 5.5 1.3 4.1
less:
Imports of Goods and Services 176.0 184.7 4.9 0.3 4.6
Statistical Discrepancy 1.9 1.9
GDP at Market Prices 197.1 208.8 5.9 2.2 3.7
Net Factor Payments -28.9 -30.6
GNP at Market Prices 168.2 178.2 6.0 2.4 3.5
B: Gross National Product by Origin
2015 2016 Change in 2016
€ bn € bn € bn %
Agriculture 3.2 3.3 0.1 2.5
Non-Agriculture: Wages, etc. 76.1 79.1 3.0 4.0
Other 76.0 83.3 7.3 9.6
Adjustments: Stock Appreciation 0.6 0.6
Statistical Discrepancy -1.9 -1.9
Net Domestic Product 154.0 164.4 10.4 6.8
Net Factor Payments -28.9 -30.6 -1.7 5.9
National Income 125.1 133.8 8.7 7.0
Depreciation 25.0 25.5 0.5 2.0
GNP at Factor Cost 150.1 159.3 9.2 6.1
Taxes less Subsidies 18.1 19.0 0.8 4.5
GNP at Market Prices 168.2 178.2 10.0 6.0
C: Balance of Payments on Current Account
2015 2016 Change in 2016
€ bn € bn € bn
X - M 44.6 48.3 3.6
F -28.9 -30.6 -1.7
Net Transfers -2.4 -2.5 -0.1
Balance on Current Account 13.3 15.2 1.8
The Irish Economy - Forecast Overview and Summary
We continue to believe that the Irish economy will grow strongly in 2015 with GNP set to increase by just over 4 per cent. Recent data from the Quarterly National Accounts show the economy grew by 2.3 per cent between Q3 and Q4 2014. The strong expected performance in 2015 comes after the Irish economy grew by over 5 per cent in 2014 with a significant portion of that growth due to increases in labour productivity.
While 2014 saw the sources of growth re-balancing with a greater contribution coming from domestic sources, foreign demand for Irish exports will continue to be very important for the growth outlook in 2015. The poor performance of the Euro Area is an ongoing concern; however, a mitigating consideration is the positive outlook for the US and UK markets. The recent economic assessment of the Euroframe1 group forecasts relatively strong performances for the US and UK
economies with growth rates in 2015 of 3.2 and 2.8 per cent respectively. Overall, we expect total exports to increase by 5.1 per cent in 2015 with imports increasing by 4.4 per cent.
Domestic sources of growth increased in relevance through 2014 and we envisage continued strong contributions from investment, in particular, and to a lesser extent consumption in 2015. In terms of the housing market, for example, we forecast 16,000 new housing units to be built in 2015, which is up from 11,000 in 2014. Investment, in general, is forecast to increase by just under 13 per cent in 2015.
The increased level of activity in the economy should see unemployment rates falling by the end of 2015 to less than 10 per cent for the first time since 2008. One interesting puzzle in the labour market is the continued stagnant rate of labour force participation. We expect this to increase marginally as labour market conditions continue to improve.
We outline our first forecast for 2016 in this Commentary. Given the expected significant increases in investment in 2015 and continued improvements in productivity, we expect the Irish economy to be quite near its potential level at
1 The ESRI is a member of Euroframe, a network of ten independent European research institutes, which produces
the end of the present year. Only the rate of unemployment will be divergent from its long-run equivalent rate.2 Taking these factors into consideration leads
us to a growth rate in GNP of 3.5 per cent in 2016. Based on an assumption of fiscal neutrality,3 we forecast a fiscal deficit in 2016 of 0.3 per cent.
In this Commentary we focus, to quite an extent, on the performance of the Euro
Area. Research Note 2015/1/2 by McQuinn and Whelan summarises a new
research paper entitled “Europe’s Long-Term Growth Prospects: With and Without Structural Reforms”.4 Based on long-run growth forecasts from a Solow
model, McQuinn and Whelan conclude that a baseline outlook for the European economy over the medium and longer-term is quite pessimistic with annual growth rates between 2014 and 2020 set to average only 0.7 per cent per annum. Additionally the research shows that, even when fairly ambitious structural reforms are implemented, the European economy is still likely to grow at a slower pace than it has in the past.
The Commentary also focuses on the likely implications of the recently announced macro-prudential measures implemented by the Central Bank of Ireland. Forthcoming research by Duffy, McInerney and McQuinn5 empirically
examines the implications of these measures for house prices, housing supply and mortgage lending in the Irish market. Overall, the research concludes that the impact of the measures will be contractionary suggesting that, while house price inflation may be reduced due to these new measures, this reduction may come at the expense of fewer houses being supplied and fewer mortgage loans being extended than would otherwise be the case.
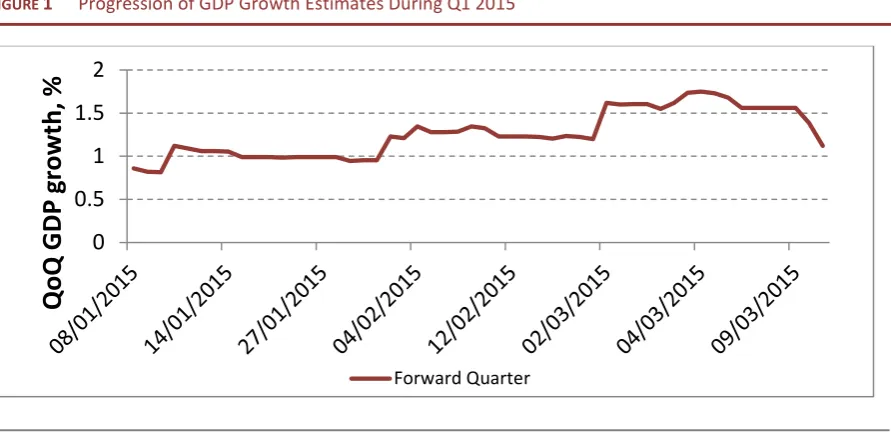
Finally, this Commentary introduces an Appendix, which outlines what the nowcasting approach, recently adopted by the Commentary, suggests is the current rate of GDP growth in the Irish economy. The Appendix, which will be a regular feature of future Commentaries, indicates that the economy is growing by approximately 1 per cent in Q1 2015 with respect to Q4 2014.
2 Over the period 1960 to 2014 the median unemployment rate is 7.8 per cent.
3 Fiscal neutrality means that demand in the economy is neither stimulated nor diminished by taxation and
Government spending.
4 McQuinn K. and K. Whelan (2015). “Europe’s Long-Term Growth Prospects: With and Without Structural Reforms”,
ESRI and UCD Working Paper, forthcoming.
5 Duffy D., N. McInerney and K. McQuinn (2015). “Macro-Prudential Policy in a Recovering Housing Market: Too Much
The International Economy
Since the last Commentary, inflation fell further from target in most developed countries, while worldwide growth in the second half of 2014 proved to be weaker than expected. This has prompted monetary policy actions from a number of authorities in response, most notably the launching of the European Central Bank’s Quantitative Easing (QE) programme. Declining oil prices have played a major part in the widespread fall in inflation. The oil price movements should, however, provide some stimulus to global growth. There is also considerable benefit to Ireland and the Euro Area from the recent depreciation of the Euro versus other major currencies. Figure 1 shows forecast growth in Ireland’s main trading partners. The United States and United Kingdom economies are forecast to grow by approximately 3 per cent and 2.5 per cent respectively. The Euro Area returned to some growth in 2014 and is forecast to grow moderately in 2015 and 2016 also.
FIGURE 1 Real GDP Growth (% change, year-on-year)
Euro Area United States United Kingdom
Sources: FocusEconomics, IMF, OECD, HM Treasury and Federal Reserve.
The World Economy
Oil prices fell by approximately a half between the second quarter of 2014 and the first quarter of 2015, caused by strong supply, weak demand growth and accumulating oil inventories. Growth in global oil demand has been hampered by general international macroeconomic weakness and has been outstripped by supply. In November, OPEC decided not to cut its supply levels, widely seen as an
attempt to defend its market share against competition from US shale oil and gas production. The US producers have relatively higher costs of production and require the price per barrel of oil to be higher to break even. The year to date has seen oil supply begin to respond, however, and the International Energy Agency forecasts that oil supply will continue to fall in 2015. Oil price forecasts from the Energy Information Administration put Brent crude oil prices at US$58 per barrel in 2015 and US$75 per barrel in 2016, compared with the January 2015 trough of US$48 per barrel.
In a recent assessment of the Euro Area and global economies, Euroframe included a simulation6 of the potential stimulatory impacts of the recent drop in
oil prices7 on economic growth. This simulation includes two scenarios; one in
which the decline in oil prices is permanent and one where it is temporary. The baseline forecasts for global GDP growth for 2015 and 2016 are 3.7 per cent and 3.8 per cent respectively. A permanent fall in oil prices gives rise to an additional 0.5 per cent growth in each year. The United States is shown to benefit more strongly from a permanent fall than the Euro Area due to the US having more oil-intensive production in its economy. A temporary decline in oil prices also has a positive impact on global growth; however the magnitude of the impact is much smaller. Given the open nature of the Irish economy, Ireland would be likely to benefit by more than the Euro Area average from the increase in global growth following the oil price shock.
The recent movements in energy prices have been the largest contributor to worldwide falling inflation, leaving inflation rates significantly below target. In contrast to previous episodes in which oil prices fell significantly, nominal interest rates are currently close to the zero lower bound. This leaves little scope for conventional monetary policy to become more accommodative so as to offset the impact on consumer prices. As a result, it is likely that inflation will remain low for some time to come. With market-based measures of inflation expectations falling appreciably over the last year, the anchoring of inflation expectations has become a significant cause for concern.
6 The simulation was conducted using the NiGEM model of the world economy from the National Institute of Economic
and Social Research.
7 The Euroframe simulation assumes a Dollar/Euro exchange rate of approximately 1.25 in 2015 and 2016. This is
The Euro Area Economy
Real GDP in the Euro Area grew by 0.9 per cent in 2014, marking annual GDP growth for the first time since 2011. As emphasised by Figure 1, growth in the Euro Area remains weaker and more uncertain than in other major economies. Economic data for the Euro Area provide a mixed picture; some indicators show growth returning or picking up, while others remain less promising. The Euro Area unemployment rate was 11.2 per cent in January, down from 11.3 per cent in the previous month and from 11.8 per cent in January 2014. An increasing rate of money supply growth and a return to growth in loans to the private sector are also indicative of a return to economic growth. However, GDP growth continues to lag particularly badly in France and Italy. Recent research8 has shown that the
structural reforms typically called for by Euro Area institutions are not likely to provide a strong addition to Euro Area growth over the medium term.
Euro Area policies and institutions continue to provide an ongoing source of debate. It is unlikely that fiscal policy across the Euro Area will provide any stimulus to growth over the next two years, leaving it necessary for monetary policy to become more accommodative. The negotiations in early 2015 between the Greek government and its creditors proved to be much more prolonged and difficult than was expected. The negotiations were reminiscent of earlier years of the Euro crisis, with frequent talk of exit from the single currency against a backdrop of rising sovereign bond yields and deposit flight from the banking sector. While an interim deal was reached, these negotiations serve as a reminder that Europe and its institutions are not beyond returning to crisis situations.
Annual inflation in the Euro Area was -0.3 per cent in February, a small increase from -0.6 per cent in January, with 15 of the 19 members of the Euro Area in deflation in February. Energy price inflation was -7.9 per cent in February while core inflation, excluding energy prices, was 0.6 per cent. While falling energy prices have played a significant part in the low inflation across most developed countries, core inflation in the Euro Area is low and had been falling throughout 2014. In January, ECB President Mario Draghi highlighted the possibility of “second-round effects” from low inflation. Despite the significant impact of energy prices, low rates of inflation could lead to impacts on wage and price-setting and affect inflation developments over the medium term. This point is underscored by recent declines in a range of market-based measures of inflation expectations. Given deflation and the possibility of inflation expectations
8 McQuinn K. and K. Whelan (2015). “Europe’s Long-Term Growth Prospects: With and Without Structural Reforms”,
becoming more unfavourable to price stability, monetary policy had not been sufficiently accommodative to deal with the risks of a deflationary spiral.
Against this backdrop, in January the ECB announced a range of new measures to achieve its price stability objective. The most notable of these measures is the launching of a QE programme, one which purchases sovereign bonds in addition to the existing programmes to purchase asset-backed securities and covered bonds. The programme started in March 2015 and involves the Euro System making €60 billion in purchases per month until September 2016 at least. The announced schedule for these purchases allows sufficient scope for them to continue further, should that be necessary to achieve a sustained adjustment in the path of inflation. Initially, QE is set to expand the ECB balance sheet by over €1 trillion, or approximately 10 per cent of Euro Area nominal GDP. This is relatively moderate in size compared with recent QE programmes in the US (20 per cent of GDP), UK (25 per cent of GDP) and Japan (40 per cent of GDP).
The QE programme has had an immediate impact as a foreign exchange instrument and is likely to continue to do so. Weakening the Euro further will benefit Euro Area exporters and thereby have the welcome impact of promoting growth. Furthermore, QE helps the ECB to achieve its mandate by leading to imported inflation, with the effect magnified if QE leads to outward investment flows into foreign currency debt. QE is likely to have a signalling effect also because, as noted above, the ECB has given guidance that it will continue the programme until at least September 2016. In January, the ECB also lowered the cost of borrowing as part of its TLTRO operations to increase lending to the real economy.
While the announcement of Euro Area QE has been widely welcomed, the practical implementation has received some criticism. The Euro Area and United States, for example, have significant differences which may lead to QE being less effective in Europe. In the US, the dominance of household debt over liquid assets means that lower real interest rates lead to greater household spending. The opposite holds in Germany9 and France.10 Rising stock market valuations also
do not spur spending in Euro Area households as much as American ones, given households in Europe hold less in equities.
9 Geiger, F., J. Muellbauer and M. Rupprecht (2014). “The Housing Market, Household Portfolios and the German
Consumer”. Presented at the Bundesbank, DFG and IMF conference, Eltville, June 2014.
10 Chauvin, V. and J. Muellbauer (2013). “Consumption, Household Portfolios and the Housing Market: a Flow of Funds
The US Economy
As noted in the Winter Commentary, discussion in the US has turned to the normalisation of monetary policy. Given recent inflation developments and relatively weaker economic growth in the second half of 2014, it now appears likely that interest rates will rise in the second half of 2015, rather than the first. In its communication, the Federal Open Market Committee has said that it will wait for further improvement in the labour market, and until it is reasonably confident that inflation is returning to target over the medium term, before it raises the federal funds rate. Market expectations indicate that the first rise will occur in the second half of 2015, with the federal funds rate eventually rising to 1.5 per cent by 2018. Headline CPI inflation was -0.7 per cent in January, driven by a 9.7 per cent fall in energy prices.
Real GDP in the US rose by 2.4 per cent in 2014 compared with 2013. For the fourth quarter, growth was 2.2 per cent, revised down from 2.6 per cent in the advanced estimate. This represented a slowdown in the rate of growth from the 4.6 and 5.0 per cent growth rates in the second and third quarters respectively. While real personal consumption expenditure grew at a stronger rate than in the previous quarter, investment growth slowed and net trade provided a drag on GDP growth. Real exports grew at 3.2 per cent in the fourth quarter compared with growth of 4.5 per cent in Q3, while imports grew at 10.1 per cent in Q4 compared with -0.9 per cent in Q3. The robust economic growth in the United States is significant for Irish exports, contrasting with the still-tentative recovery in the Euro Area.
The unemployment rate in the United States was 5.5 per cent in February, falling slightly from 5.6 per cent the previous month. The unemployment rate has fallen from 6.7 per cent in February 2014. Employment growth in February was 295,000, exceeding market expectations, and marking the 12th consecutive
The UK Economy
Inflation in the United Kingdom was 0.3 per cent in January, a fall from 0.5 per cent in December. Like the Euro Area and US, inflation in the UK has fallen significantly below its target. The Bank of England forecasts inflation to fall further in the short term and into negative territory, due to continued pass-through of falling energy prices. Based on international forward interest rates, markets have priced in a mid-2016 interest rate rise in the UK, with the Bank Rate reaching 1 per cent by 2018. This represents a later initial interest rate rise and a more gradual schedule of rises than had been the expectation during the second half of 2014.
Real GDP in the United Kingdom grew by 0.5 per cent quarter-on-quarter in Q4 2014 and by 2.7 per cent compared with the same quarter of 2013, according to the Office for National Statistics. GDP for the year 2014 as a whole rose by 2.6 per cent compared with 2013. The peak-to-trough decline in GDP was 6 per cent, a deeper impact than the 5.5 per cent decline in the early 1970s downturn, the 5.6 per cent decline of early 1980s, and 2.2 per cent of the early 1990s. The recovery in growth has proved to be weaker than from these previous recessions also, taking longer to exceed the pre-downturn peak and having less cumulative growth in like-for-like comparisons of the recoveries. Despite its historical weakness, the recovery in the UK has importance for Ireland given the United Kingdom’s stature among Ireland’s trade partners. Similarly, the recovering UK labour market has pass-through effects on the labour market in Ireland.
The unemployment rate fell to 5.7 per cent in the fourth quarter, from 6.0 per cent the previous quarter and from 7.2 per cent the previous year. Quarterly employment growth was 103,000 in the fourth quarter, with an increase of 608,000 compared with Q4 2013. As a result, the employment rate rose to 73.2 per cent of the working age population, compared with 72 per cent a year earlier. The UK employment rate is the highest it has been since records began in 1971. With labour force participation flat for the year, employment growth is the driver of the declining unemployment rate.
Monetary Developments in Other European Economies
abandoning its currency cap versus the Euro.11 The SNB cited divergent monetary
policies between the Euro Area and United States and the likelihood that this would become even more pronounced. In addition, the Rouble crisis had meant that investors in search of a “safe haven” had led to further pressure on the Franc. The abandonment of the cap is likely to hurt Swiss exporters, given the subsequent appreciation of the Franc.
Similar inflows of foreign currency have been observed in Denmark, particularly in the wake of the moves by the SNB and ECB. To inhibit these flows, the Nationalbank cut its deposit rate four times between January 1 and February 5, from -0.1 per cent finally to -0.75 per cent. It has also committed to unlimited interventions in foreign exchange markets to maintain its policy of a fixed exchange rate between the Krone and Euro. In Sweden, in response to low inflation and fears of expectations of low inflation becoming entrenched, the Riksbank became the first central bank to bring its main policy rate into negative territory, while it also launched a QE programme.
11 Since 2011, the Swiss National Bank (SNB) had implemented a cap which prevented the Swiss Franc from rising above
The Domestic Economy
Output
The recovery in the Irish economy, evident since mid-2013, gathered apace through 2014 with overall GNP growing by just over 5 per cent. Figure 2 demonstrates the degree to which the speed of growth increased throughout 2014 as growth forecasts picked up significantly in the third quarter. We expect this strong performance to continue into 2015 with output set to increase by just over 4 per cent.
FIGURE 2 Irish Real GDP and GNP Year-on-Year Forecasts for 2015 (%)
Source: QEC forecasts.
The sizeable increase in activity indicated by the CSO Quarterly National Accounts in September 2014 was picked up by the nowcasting model now used in the Commentary to accompany the standard forecasting exercise.12 Key variables in
the nowcasting model indicate strong growth, including PMI (Purchasing Managers’ Indices), retail sales and certain housing market variables. Moving into 2015, the approach suggests that the economy grew by approximately 1 per cent between Q4 2014 and Q1 2015.
In this Commentary we publish our initial forecast for 2016. In thinking about a more medium-term outlook for the economy, we use a growth accounting
12 See Appendix for more details on the latest nowcasting estimates.
0.0 1.0 2.0 3.0 4.0 5.0 6.0
2013q1 2013q2 2013q3 2013q4 2014q1 2014q2 2014q3 2014q4 2015q1
framework presented in Byrne and McQuinn (2014)13 and McQuinn and Whelan
(2015).14 This approach takes into account the productive capacity of the
economy and, consequently, enables us to establish whether the economy is operating at or near potential levels of output.
Our analysis suggests that, given the relatively strong outlook for 2015, the Irish economy is set to be almost at its potential level by the end of the year. Key parameters such as the investment rate and total factor productivity growth will be at or slightly above their long-run median values by the end of 2015, with only the unemployment rate still divergent from its long-run equivalent path. Based on this medium-term perspective, we would expect that GNP will grow by 3.5 per cent in 2016. Figure 3 illustrates that, even with these strong forecasts, both GNP and GDP will only be back to the pre-financial crisis peak in 2007 by the end of 2016. The full extent of the lost output due to the financial crisis is clearly apparent from the graph.
FIGURE 3 Actual (1995-2014) and Forecast (2015-2016) Level of Irish Real GDP and GNP (2007 = 100)
Sources: Central Statistics Office and QEC forecasts.
A key feature of economic performance in 2014 was the extent to which domestic demand and investment, in particular, played an increasing role in overall performance. Housing supply would appear to be increasing with the overall number of units built in 2015 projected to exceed 16,000 for the first time since 2009. Business investment is also likely to witness significant increases through 2015. While overall consumption levels have increased somewhat
13 Byrne, D. and K. McQuinn (2014). "Irish Economic Performance 1987-2013: A Growth Accounting Assessment".
Research Note 2014/4/1.
14 McQuinn K. and K. Whelan (2015). “Europe’s Long-Term Growth Prospects: With and Without Structural Reforms”,
ESRI and UCD Working Paper, forthcoming.
30 40 50 60 70 80 90 100 110
marginally, retail sales and car sales, in particular, saw large increases for the second half of last year. Our outlook for consumption is influenced by the significant levels of household debt which still prevail in the economy. Unfortunately, the near glacial speed with which households’ balance sheets are being repaired, highlighted especially by the slow pace of the mortgage arrears resolution process, continues to act as a drag on economic activity.
Foreign demand for Irish goods and services is expected to continue to be an important part of the economic recovery in 2015. There would appear to be two sets of countervailing forces confronting the domestic economy; recent forecasts from the Euroframe group indicate that both the United States and the United Kingdom (still significant trading partners) are set to experience robust rates of economic activity in 2015 and 2016. However, the growth outlook for the Euro Area, as comprehensively assessed in McQuinn and Whelan (2015), continues to face significant structural as well as cyclical challenges.
Of the 5 per cent growth rate in the Irish economy in 2014, analysis of the labour market suggests that a sizeable component of the growth (3 per cent) is due to productivity developments with the residual due to employment growth. Our outlook for the labour market in 2015 indicates that the unemployment rate will be less than 10 per cent for the first time since 2008. Overall growth in the economy of at least 3.5 per cent in 2016 would see the unemployment rate down to its long-run median rate of approximately 8 per cent by the end of that year.
TABLE 1 Industry and Output
2013 2013 2014 2015 2016
Value Volume Change
€ bn % % % %
Agriculture 3.8 16.5 10.0 7.0 8.0
Industry 35.2 -2.3 1.1 3.0 4.0
Distribution, Transport, Software
and Communications 43.9 -5.2 8.0 9.0 10.0
Public Administration and Defence 6.3 -2.2 1.1 2.0 3.0
Other Services 68.2 2.4 3.4 3.5 -1.5
GVA at Factor Cost 158.5 -0.4 4.3 5.1 3.6
Monetary and Financial Conditions
In January, the Central Bank announced the results of its consultation process concerning the proposed macro-prudential regulations15 announced in October
2014. The measures introduce proportionate limits for loan-to-value (LTV) and loan-to-income (LTI) ratios for principal dwelling houses and for LTV ratios for buy-to-let mortgages. One modification to emerge following the consultation process was a higher loan-to-value limit being set for first-time buyers on the first €220,000 of the value of a residential property. In the Winter Commentary, Duffy and McQuinn (2014) had outlined a counter-cyclical rules approach which suggested that the specific limits for the LTVs and LTIs be set on the basis of a regular analysis of four different criteria which evaluate the state of the property and mortgage credit market. While the Central Bank has acknowledged that there will be some counter-cyclical dimension to these regulations, we still feel that an explicit rules-based approach would result in greater transparency and a more efficient overall market outcome.
Also, it is not clear what the rationale is for first-time buyers enjoying relatively more liberal conditions. A wide number of studies such as Chambers, Garriga and Schlagenhauf (2007a, 2007b and 2008) and Ortal-Magné and Rady (1999) and (2006)16 conclude that when credit conditions are liberalised it is relatively
younger and poorer households who tend to “benefit” from greater credit provision. In an Irish context, Duffy and O’Hanlon (2014)17 find that first-time
buyers are more likely to be in negative equity, with, for example, over 79 per cent of FTBs who drew down a mortgage between 2005 and 2012 experiencing negative equity. Thus, if the purpose of the new regime is to prevent households from experiencing credit-related issues, it is unclear why the conditions should be less binding for first-time buyers.
In terms of overall deleveraging, the private sector continued, in net terms, to repay loans with Irish banks during the second half of 2014
.
Non-Financial
15 In the “Household Sector Consumption” section, we discuss the implications of the macro-prudential measures on
the rental market, while the possible effects on housing supply are discussed in the “Supply Conditions” section.
16 Chambers, S.M., C. Carriga and D. Schlagenhauf (2007a). “Mortgage Contracts and Housing Tenure Decisions”.
Federal Reserve Bank of St. Louis, Working Paper 2007-040A, September 2007.
Chambers, S.M., C. Carriga and D. Schlagenhauf (2007b). “Equilibrium Mortgage Choice and Housing Tenure Decisions with Refinancing”. Federal Reserve Bank of Atlanta, Working Paper 2007-25, December 2007.
Chambers S.M., C. Carriga and D. Schlagenhauf (2008). “The Loan Structure and Housing Tenure Decisions in an Equilibrium Model of Mortgage Choice”. Federal Reserve Bank of St. Louis, Working Paper 2008-024B, July 2008. Ortal-Magné and S. Rady (1999). “Boom In, Bust Out: Young Households and the Housing Price Cycle”. European Economic Review, 43, pp. 755-766.
Ortal-Magné and S. Rady (2006). “Housing Market Dynamics: On the Contribution of Income Shocks and Credit Constraints”. The Review of Economic Studies, 73, No. 2, pp. 459-485.
17 Duffy, D., and N. O’Hanlon (2014). “Negative Equity in Ireland: Estimates Using Loan Level Data”. Journal of European
Corporation (NFC) loan repayments continued to exceed draw-downs in December 2014. The monthly decrease in December of €1.5 billion was reflected across all three maturity categories of NFC loans - short, medium, and long-term. The post-crisis decline in NFC lending was initially concentrated in longer-term loans, while short-term loans including the use of overdrafts continued to increase, albeit at a much slower pace. Lending to Irish resident NFCs reported a year-on-year decline of 7.2 per cent in December 2014, following an annual decrease of 6.4 per cent in November. Longer-term NFC lending has been declining since mid-2013 which may be an indication of a declining investment focus in the NFC sector. However, the pace of decline has slowed in recent months.
Certain sectors of the economy are registering increases in lending. For example new business lending to small and medium-sized enterprises (SMEs), excluding financial intermediation and property-related sectors, increased during Q3 2014 for the third consecutive quarter. Financial Intermediation and the property-related sectors of Real Estate and Construction activities account for approximately 80 per cent of total credit advanced. Of the remaining 21 per cent, Wholesale/Retail Trade and Repairs, Hotels and Restaurants, Manufacturing and Primary industries are the main sectors accessing credit from Irish resident credit institutions. To provide an indication of current lending practices within the Irish economy, Figure 4 plots credit advanced by sector in Q4 2014.
FIGURE 4 Credit Advanced by Sector
Source: Central Bank of Ireland.
Certain Irish financial institutions have, of late, returned to profitability for the first time since 2008. In the first half of 2014, Allied Irish Bank and Bank of Ireland, in particular, have both recorded profit-before-tax of €437 million and €327 million respectively. While the continued presence of both mortgage arrears and other non-performing loans hinders a more robust recovery in the
25%
54% 21%
Property Related
Financial Intermediation
balance sheets of Irish credit institutions, the improving profitability and the completion of the ECB stress tests in Q4 2014 should see an increase in the amount of credit extended to the real economy in 2015.
Ireland raised €4 billion at its first 30-year bond sale buoyed, to a certain extent, by the European Central Bank QE program outlined in January which includes government bond purchases. The 30-year debt was sold at a yield of just below 2.1 per cent with investors bidding over €11.2 billion in the sale. Along with raising €4 billion in 7-year debt in early January, the National Treasury Management Agency (NTMA) is already half way towards meeting its target of €12 - €15 billion in long-term bonds. Most recently, the NTMA auctioned off €500 million of the benchmark 15-year government bond at a yield of 1.56 per cent. Total bids received amounted to €1,576 million which was 3.15 times the amount on offer.
In mid-February the yield on the 10-year Irish sovereign fell below 1 per cent for the first time, as fears of Greece exiting the euro zone receded. This has been viewed as further evidence of Ireland’s strong recovery from the debt crisis. In the short term, the improvement in borrowing costs is a positive development for
Irish sovereign bonds. However, as noted in previous Commentaries, any
deterioration of international sentiment will have significant implications for the borrowing costs of both the State and domestic financial institutions.
Prices and Earnings
The annual rate of inflation was negative for the third month in a row in February. Data from the CSO show that prices on average, as measured by the Consumer Price Index (CPI), were 0.5 per cent lower in February 2015 compared with 12 months previously, the lowest level in four and a half years. Similarly, prices on average, as measured by the EU Harmonised Index of Consumer Prices (HICP), decreased by 0.4 per cent compared with February 2014.
Water supply and sewage collection charges were introduced in Ireland on 1 January 2015. The coverage of the CPI/HICP is defined as those goods and services purchased by households for the purposes of consumption. The contribution of water supply added 0.22 per cent and sewage collection added 0.19 per cent to the annual inflation rate.
We forecast that inflation will remain subdued in 2015 and 2016 but will rise slightly compared to the rate recorded in 2014. These modest increases reflect both the combination of increased domestic economic activity and increases in Euro Area inflation rates due, partially, to the QE measures announced in January.
TABLE 2 Inflation Measures
2013 2014 2015 2016
Annual Change
% % % %
CPI 0.5 0.2 0.1 1.0
Personal Consumption Deflator 1.9 1.6 1.6 1.5
HICP 0.5 0.3 0.2 1.2
Sources: Central Statistics Office and ESRI forecasts.
Preliminary estimates from the CSO on Earnings and Labour Costs for Q4 2014 reveal that Average Hourly Earnings increased by 1.7 per cent over the year. This compares with a decrease of 1.6 per cent in the year to Q3 2014 from €21.36 to €21.02 per hour.
We forecast growth in average earnings of 1 per cent in 2015 and 2016. While these increases may appear somewhat modest, it is worth noting that unemployment, while falling in 2015 and 2016, will still be above its long-run median rate by the end of 2016. The continued presence of over-capacity in the Irish labour market may well result in modest wage and pay increases. In some respects, this is similar to developments in the U.S. and U.K. labour markets at present; falling unemployment rates have not resulted in a significant increase in wage rates. We also forecast current transfers (social welfare payments) will continue to decline in line with the rise in employment. Based on the increase in employment we also forecast a continuing increase in personal disposable income.
Components of Demand
Exports, Imports and Balance of Payments
The latest CSO figures indicate that exports (merchandise) fell by 5 per cent in the month to January 2015 but were up 15 per cent on an annual basis. Similarly, imports were up 8 per cent over the year to January 2015 but recorded a 1 per cent drop from December 2014. In the 12 months to December 2014 both exports and imports increased (in volume terms) by 17 per cent and 9 per cent respectively.
In 2014 the value of imports reached its highest level since 2008. The main contributors to growth were Machinery and Transport Equipment, at 27 per cent, and Chemicals and Related Products, at 21 per cent. In 2014, 30 per cent of Irish imports came from the UK with the US accounting for 11 per cent of total imports for the year.
TABLE 3 Proportion of Total Exports from Ireland (%) and Growth Rates
2010 2011 2012 2013 2014
Proportion of Total Exports from Ireland (per cent)
UK (incl. Northern Ireland) 15.5 15.6 16.5 16.2 15.1
EU Member States (excl. UK & NI) 42.6 42.0 42.5 40.8 39.7
US & Canada 24.2 24.4 20.7 22.0 23.0
Growth Rate (GDP)
UK 1.9 1.6 0.7 1.7 2.6
EU Member States 2.0 1.8 -0.4 0.1 1.3
US 2.5 1.6 2.3 2.2 2.4
Sources: Central Statistics Office and Euroframe.
Export developments in 2014 were dominated by the impact of foreign processing of Irish-owned goods for export, or what is commonly known as “contract manufacturing”. While this is a long-standing feature of Irish trade, changes in the business structure of multinational enterprises during 2014 led to a change in the size of this activity. In the most recent Quarterly National Accounts, the CSO reiterated the fact that the related addition to gross value added from contract manufacturing, over and above wages and salaries paid, is not particularly significant in explaining the recent growth in Irish GDP. We forecast that any growth associated with this phenomenon will begin to dissipate in 2015 and 2016.
A Balance of Payments current account surplus of 7.7 per cent of GDP was recorded in Q4 2014. Compared with Q4 2013, merchandise exports were up 27 per cent while merchandise imports were up 16.5 per cent. On the services side, exports were up 8 per cent over the same period. This was mainly due to increased computer services exports of 13 per cent. Services imports experienced an increase of almost 22 per cent driven primarily by growth in royalties and licensing payments of 38.5 per cent.
Household Sector Consumption
Certain indicators suggest that increases can be expected in household consumption levels in 2015. The volume of retail sales grew by 8.8 per cent year-on-year in January 2015. When car sales are excluded, there was an increase of 0.1 per cent in the volume of retail sales in January 2015 when compared with the month previous and an increase of 4.8 per cent in the annual figure. The number of new private cars licensed for the first time increased by 29.2 per cent in February 2015 compared to February 2014, while the number of new goods vehicles licensed was up 58 per cent from January 2014.
Similarly, the three-month moving average of the KBC Ireland/ESRI Consumer Sentiment Index continues on an upward trend increasing from 92.3 in January to 95.9 in February. When compared to values of 83.3 in February 2014 and 57.8 in 2013, there is strong evidence that consumer confidence has grown steadily over the past two years.
However, as can be seen in Figure 5, lending to Irish households continues to fall on an annual basis, decreasing by 3.7 per cent in December 2014. Loans for house purchase, which account for 81 per cent of total household loans, declined at an annual rate of 2.7 per cent. Lending for consumption and other purposes also declined by 7.5 per cent year-on-year.
FIGURE 5 Lending to Irish Resident Households (Annual Percentage Change)
Source: Central Bank of Ireland. - 25.0
- 15.0 - 5.0 5.0 15.0 25.0
Jan
2008 2009Jan 2010Jan 2011Jan 2012Jan 2013Jan 2014Jan
Additionally, along with other sectors of the economy, household deleveraging continued into December 2014 with loan repayments exceeding new draw-downs by €3.9 billion over the entire year. In the Winter Commentary we noted that household loan draw-downs exceeded repayments in September 2014 for the first time since September 2013. This relationship reversed again in December with household loan repayments exceeding draw-downs by €43 million during the month. In the case of loans for house purchase, repayments exceeded draw-downs by €2.2 billion in the year to end-December 2014. Repayments also exceeded draw-downs by €1.7 billion for non-housing loans to households in 2014.
Consequently, in forecasting consumption levels it is evident that legacy effects from the financial crisis may still act as a drag in this area. Micro-level evidence of the effects of deleveraging on household consumption for Irish households is
evident in McCarthy and McQuinn.18 Based on the most recent Quarterly
National Accounts from the CSO for the year 2014, personal consumption increased by just 1.1 per cent between 2013 and 2014. Therefore, in combining the overall effects of increased earnings and growing employment with the continued presence of distressed household balance sheets, we forecast relatively modest increases in consumption of 2 per cent and 2.4 per cent in 2015 and 2016 respectively.
Property Market Developments
In January residential property prices fell by 1.4 per cent nationwide. This is the largest fall in national prices observed in a single month since February 2012. Despite this fall, residential property prices remain 15.5 per cent higher than 12 months previous. In Dublin residential property prices fell by 1.9 per cent in January, while house prices outside of Dublin fell by less than 1 per cent in January. Overall, as seen in Figure 6, residential prices are still substantially higher than the same period last year with a 21.6 per cent rise in Dublin and an annual increase of 9.3 per cent in the rest of the country.
18 McCarthy, Y. and K. McQuinn (2014). “Deleveraging in a highly indebted property market: who does it and are there
FIGURE 6 Residential Property Price Index (Base Jan 2005 =100)
Source: Central Statistics Office.
In spite of substantial house price increases in recent months and in light of the small decline recorded in January, house prices in Dublin are currently 38.5 per cent lower than at their highest level in early 2007. Outside of Dublin, residential property prices are also substantially lower (41.9 per cent) than their highest level in September 2007. In Duffy, McInerney and McQuinn,19 the estimates from a
house price model in McQuinn20 are updated. This suggests that, as of Q4 2014,
Irish house prices were still undervalued by approximately 10 per cent.
The introduction of the new macro-prudential measures by the Central Bank is likely to lead to some uncertainty in terms of how key housing variables evolve over the next year. Duffy et al., using the Gerlach-Kristen and McInerney21 model,
examine the impact of the LTV and LTI restrictions on mortgage credit levels, house prices and housing supply. Overall, they find that house prices and housing supply declines by approximately 4 per cent to 5 per cent vis-à-vis a baseline level due to these measures. The impact may take up to four years to be fully realised. Duffy et al. also find that mortgage lending may fall by between 15 to 20 per cent due to these measures.
One other area affecting certain households which may also be impacted by the recent macro-prudential measures is the rental market. As can be seen from
19 Duffy, D., N. McInerney and K. McQuinn (2015). “Macro-Prudential Policy in a Recovering Housing Market: Too Much
Too Soon?” ESRI Working Paper,forthcoming.
20 McQuinn, K. (2014). “Bubble, Bubble Toil and Trouble? An Assessment of the Current State of the Irish Housing
Market”. Special Article, Quarterly Economic Commentary, Summer 2014.
21 Gerlach-Kristen, P. and N. McInerney (2014). “The Role of Credit in the Housing Market”, ESRI Working Paper No. 495.
0 20 40 60 80 100 120 140 160
Jan-05 Jan-06 Jan-07 Jan-08 Jan-09 Jan-10 Jan-11 Jan-12 Jan-13 Jan-14 Jan-15
Figure 7, rental rates in the economy have been trending upwards since early 2012, with the CSO rate, in particular, indicating that present rental rates are almost back to the peak of the “boom” period. While house prices fell by over 50 per cent during the recession, the peak to trough in the rental market was lower, with a decline at just over 25 per cent. This may in part be due to the increase in the number of households opting to rent, as shown in Census 2011. Between 2006 and 2011 the number of households in Ireland increased by 187,000 or almost 13 per cent, to 1,649,000, while the number of households renting increased by 160,060. Thus, almost 86 per cent of the households formed between 2006 and 2011 were in the private rented sector.
There has been some speculation that the introduction of the new limits on LTVs and LTIs may lead to further increases in rents as certain marginal households may not now be able to raise the new down-payment level required. Certain aspects of the housing literature do lend some credence to this viewpoint; Duca, Muellbauer and Murphy,22 for example, show that in the case of the US rental
market, when limits were imposed on LTVs, rents were permanently increased for a given house price level.
FIGURE 7 CSOandPRTB/ESRI Rent Index (Index Q3 2007 = 100)
Sources: CSO and PRTB/ESRI.
22 Duca J., J. Muellbauer and A. Murphy (2011). “House Prices and Credit Constraints: Making Sense of the U.S.
Experience”. Economic Journal, Royal Economic Society, Vol. 121(552), pp. 533-551.
75.0 80.0 85.0 90.0 95.0 100.0 105.0 110.0
2007Q3 2008Q3 2009Q3 2010Q3 2011Q3 2012Q3 2013Q3 2014Q3
[image:32.595.71.521.411.637.2]Supply Conditions
Investment
Preliminary National Accounts data for 2014 show that the volume of investment grew by 11.3 per cent in 2014. Analysis of available indicators continues to suggest that investment will make a large contribution to growth in domestic demand and hence to economic growth over the short term. Registrations, completions and planning permissions suggest that the volume of housing completions will increase again in each of the next two years, to an annual average of 18,000 units in 2016. This remains below the rate of new household formation, estimated at approximately 25,000 new households per annum (Duffy, Byrne and FitzGerald23). Growth in construction will also be driven by a
continuation of the upward trend in commercial construction. Thus, the volume of investment in building and construction is forecast to grow by 14 per cent in 2015. Having grown strongly in both 2014 and 2015, some moderation in growth is expected in 2016 at over 13 per cent, although this in part will reflect the higher base. However, as noted in the previous section, the introduction of the new macro-prudential measures may have implications for our forecasts with housing supply levels not increasing by as much as expected.
Investment in machinery and equipment generally responds to the same stimuli as investment in construction and so this component of investment is also forecast to grow. While this is a volatile component, especially due to aircraft purchases, the underlying trend is still one of growth. The continuing low interest rate environment should also contribute to growth of 7.7 per cent in 2015, with marginally slower growth of just over 6.5 per cent in 2016. Based on growth in the component parts, our expectation is that overall investment will grow by close to 13 per cent in 2015. Following the strong growth rates of recent years we will experience some moderation in investment growth in 2016. However, investment growth will remain strong at over 9.5 per cent in volume terms.
Labour Market
Since the fourth quarter of 2012 there has been a continuous expansion of employment and reduction in unemployment in Ireland. These improvements in labour market conditions remain one of the most reliable indicators of recovering economic activity. The latest Quarterly National Household Survey (QNHS) for the final quarter of 2014 reports an annual increase in employment of 1.5 per cent in
23 Duffy, D., D. Byrne and J. FitzGerald, (2014). “Alternative Scenarios for New Household Formation in Ireland”. Special
the year to Q4 2014. This compares with an increase of 3.3 per cent in the year to Q4 2013. Total employment now stands at its highest level since Q3 2009.
The increase in total employment of 29,100 in the year to Q4 2014 was comprised of an increase of 2.7 per cent in full-time employment and a decrease in part-time employment of 2.3 per cent. Employment increased in 11 of the 14 economic sectors over the year and fell in only three (Agriculture, Forestry and Fishing; Public Administration and Defence; and Human Health and Social Work Activities). The largest rate of increase was recorded in Construction, up 12.6 per cent in the year followed by annual growth of almost 5 per cent in Financial, Insurance and Real Estate Activities. It is possible that reductions in the long-term unemployment rate over the year are largely driven by the fact that the Construction sector is beginning to return to more long-term sustainable levels.
The proportion of total unemployment currently accounted for by long-term unemployment stands at 57.8 per cent in the fourth quarter of 2014. This compares to a value of 61.4 per cent recorded 12 months previous and 59.9 per cent in Q4 2012. The long-term unemployment rate fell to 5.7 per cent in the fourth quarter of 2014 down 1.5 per cent from Q3. The seasonally adjusted unemployment rate is now 10.4 per cent which is the lowest recorded rate since the Q1 2009 when it stood at 10.2 per cent. Unemployment decreased by 15.6 per cent in the year. This is the tenth quarter in succession where unemployment has declined on an annual basis.
The number of employees in the public sector continued to decline in the fourth quarter of 2014 bringing the total reduction in employment in the public sector over the three years (Q4 2011 - Q4 2014) to 4.2 per cent. Private sector employment continues to remain strong with annual growth in Q4 2014 of 3.2 per cent compared with the increase of 2.4 per cent recorded in the year to Q4 2013.
annual average unemployment rate will be 9.7 per cent in 2015 and 8.4 per cent in 2016. Employment growth will continue in both industry and services with strong employment growth in Construction likely to continue into 2016.
Public Finances
A key feature of the improved economic performance of the economy has been the strength of the tax take throughout 2014. The end-year Exchequer returns show that the public finances performed well in 2014, in line with expectations, given the buoyancy of the monthly Exchequer returns and strong growth in the economy. Overall taxation receipts increased by over 9 per cent in 2014, with the 5 per cent increase in pay related social insurance (PRSI) for the same period indicating a significant increase in labour market activity. Net voted expenditure was down 2 per cent, although this masked an overrun on net current voted expenditure as a result of higher health spending. On the basis of these returns, we estimate that the general government balance was 3.7 per cent, once again well within the target set under the bailout agreement.
The Exchequer returns for February suggest that the growth in tax revenues has continued into 2015. Ongoing growth in employment as well as increases in personal incomes, improving consumer sentiment and corporate profits should underpin growth in tax revenue throughout 2015 and 2016. However, our belief remains that it will be difficult to reduce expenditure levels over the forecast period.
If our expectations for growth in these variables prove to be correct, then the deficit should decline to 2.3 per cent of GDP this year, with a further reduction to 0.3 per cent in 2016. This represents a significant improvement in the public finances particularly when compared with the sizeable deficits incurred in 2010 and 2011. As stated in the “Output” section above we believe that, given our growth forecasts, the Irish economy will be near to its potential level at the end of 2015. In that context, if the economy continues to grow significantly in 2016, budgetary policy will play an important role in moderating economic activity and ensuring that there is no repeat of the destabilising pro-cyclical policy evident in the run up to the financial crisis of 2007/08. This may require, for example, that budgetary policy targets fiscal surpluses in 2017 and 2018.