This is a repository copy of
Design and application of a multi-modal process tomography
system
.
White Rose Research Online URL for this paper:
http://eprints.whiterose.ac.uk/685/
Article:
Hoyle, B.S., Jia, X., Podd, F.J.W. et al. (6 more authors) (2001) Design and application of a
multi-modal process tomography system. Measurement Science and Technology, 12 (8).
pp. 1157-1165. ISSN 1361-6501
[email protected] https://eprints.whiterose.ac.uk/
Reuse See Attached
Takedown
If you consider content in White Rose Research Online to be in breach of UK law, please notify us by
White Rose Consortium ePrints Repository
http://eprints.whiterose.ac.uk/
This is an author produced version of a paper published in Measurement Science and
Technology. This paper has been peer-reviewed but does not include the final
publisher proof-corrections or journal pagination.
White Rose Repository URL for this paper:
http://eprints.whiterose.ac.uk/archive/00000685/
Citation for the published paper
Hoyle, B.S. and Jia, X. and Podd, F.J.W. and Schlaberg, H.I. and Tan, H.S. and Wang,
M. and West, R.M. and Williams, R.A. and York, T.A. (2001) Design and application of
a multi-modal process tomography system. Measurement Science and Technology, 12
(8). pp. 1157-1165.
Citation for this paper
Hoyle, B.S. and Jia, X. and Podd, F.J.W. and Schlaberg, H.I. and Tan, H.S. and Wang,
M. and West, R.M. and Williams, R.A. and York, T.A. (2001) Design and application of
a multi-modal process tomography system. Author manuscript available at:
http://eprints.whiterose.ac.uk/archive/00000685/ [Accessed: date].
Published in final edited form as:
Hoyle, B.S. and Jia, X. and Podd, F.J.W. and Schlaberg, H.I. and Tan, H.S. and Wang,
M. and West, R.M. and Williams, R.A. and York, T.A. (2001) Design and application of
a multi-modal process tomography system. Measurement Science and Technology, 12
(8). pp. 1157-1165.
Design and application of a multi-modal process tomography system
B S Hoyle
*a, X Jia
b, F J W Podd
a, H I Schlaberg
a, H S Tan
c, M Wang
b, R M West
b, R A Williams
b,
T A York
ca
Institute of Integrated Information Systems, School of Electronic and Electrical Engineering,
University of Leeds, Leeds, LS2 9JT, UK
b
Particle and Colloid Engineering Centre, School of Process, Environmental and Materials
Engineering, University of Leeds, Leeds, LS2 9JT, UK
c
Department of Electrical Engineering and Electronics, UMIST, Manchester, M60 1QD, UK
ABSTRACT
This paper presents a design and application study of an integrated multi-modal system designed to support a range of common modalities: electrical resistance, electrical capacitance and ultrasonic tomography. Such a system is designed for use with complex processes that exhibit behaviour changes over time and space, and thus demand equally diverse sensing modalities. A multi-modal process tomography system able to exploit multiple sensor modes must permit the integration of their data, probably centred upon a composite process model. The paper presents an overview of this approach followed by an overview of the systems engineering and integrated design constraints. These include a range of hardware oriented challenges: the complexity and specificity of the front end electronics for each modality; the need for front end data pre-processing and packing; the need to integrate the data to facilitate data fusion; and finally the features to enable successful fusion and interpretation. A range of software aspects are also reviewed: the need to support differing front-end sensors for each modality in a generic fashion; the need to communicate with front end data pre-processing and packing systems; the need to integrate the data to allow data fusion; and finally to enable successful interpretation. The review of the system concepts is illustrated with an application to the study of a complex multi-component process.
Keywords: multi-modal tomography, multi-sensor tomography, data fusion.
PACS: 87.59.F
1. INTRODUCTION
Process tomography (PT) has been widely shown to offer a new insight into a number of processes (Williams and Beck 1995). For complex processes its power is potentially multiplied when data from more than one PT sensor can be fused, together with data from other non-tomographic sensors. Typically the fusion of multiple sensor data will inherently require the use of a process model, to relate the inferred parameters.
The use of such a model will also offer the important advantage of embodying the best current understanding of the operation of the process. The result could then be the estimation of key derived parameters of the composite process model. For example, estimations of cross-sectional component distributions can provide derived data of efficiency and optimal batch residence times in a process mixer; or, of integrated component fraction in a flow process. This can in turn lead to better understanding for process design, or, if real-time results are available, to use in process control.
Figure 1 below illustrates a possible configuration used to monitor a process that contains a flowing mixture. The composite system includes multiple tomographic and non-tomographic sensors, plus ancillary monitoring such as digital video for assistance in model verification.
*
PT-M1 PT-M2
Flowing mixture
r(t) Temperature sensor
f2(x,y) p(t) f1(x,y)
MPEG video Pressure
sensor
z(t)
Sensor data fusion and model parameter estimation
Derived process information
Figure 1: Overview of Data and Model Links with Multiple Sensors
Multi-modal systems inherently encourage a systematic approach in contrast to current generation PT systems that are complex, expensive and designed primarily for the prototype laboratory. A successful system must allow individual sensor data to be collected and combined effectively. It must therefore exploit opportunities for rationalisation and sharing of resources, and deal with hazards of mutual interference. A multi-modality platform has been developed based upon these principles. Its aim is to offer a comprehensive, integrated and synchronised data acquisition and processing platform. This is intended primarily for scientific use, but its features can be scaled to later specific applications, either for single or multi-modal systems. Currently the platform supports capacitance, resistance and ultrasound modalities.
All aspects, both hardware and software, are modular, facilitating simple upgrade and modification. The system also supports the acquisition of non-tomographic data that can be fused with the multi-modal tomographic data to provide composite data interpretation. The platform software toolsuite allows selection of a variety of measurement protocols for multi-modal sub-systems, and processing algorithms.
This report outlines the constituent parts of the platform in schematic detail. Section 2 describes the systems and hardware aspects; section 3 defines the major software features. Sections 4, 5 and 6 outline the resistance, capacitance and ultrasound sub-systems. Section 7 provides sample results of the system in use.
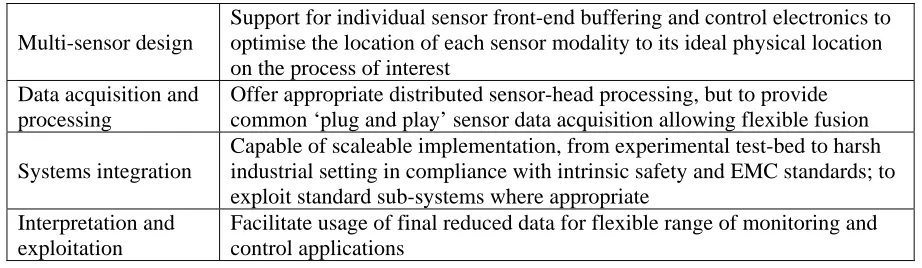
2. SYSTEM ENGINEERING AND HARDWARE
Multi-sensor design
Support for individual sensor front-end buffering and control electronics to optimise the location of each sensor modality to its ideal physical location on the process of interest
Data acquisition and processing
Offer appropriate distributed sensor-head processing, but to provide common ‘plug and play’ sensor data acquisition allowing flexible fusion
Systems integration
Capable of scaleable implementation, from experimental test-bed to harsh industrial setting in compliance with intrinsic safety and EMC standards; to exploit standard sub-systems where appropriate
Interpretation and exploitation
[image:5.595.66.527.82.216.2]Facilitate usage of final reduced data for flexible range of monitoring and control applications
Table 1: Key requirements for multi-modal PT system
2.1 System Overview
[image:5.595.45.541.349.731.2]A range of Systems Engineering and Data Standards were approved and developed throughout the detailed design phase. The implementation was then based upon a tiered logical design embracing hardware and software. This includes the following: sub-systems (S); data definition layers (L), defined as a set of electronic or software formats; and processing sub-systems (P), defined in software. The detailed specification is given in Table 2, which also defines the abbreviation used for each layer or unit.
Sensing Sub-systems
S-S Each able to control its tomographic sensor in response to commands; to acquire and marshal its raw data; and convert this data, typically from analogue to digital form to suit the specification of the Sensor Data Layer
Sensor Data Layer SD-L Defines the format of signals in the electronic bus link between each S-S and the Data Acquisition Sub-system.
Data Acquisition Sub-system
DA-S At each S-S, that gathers the standardised digital data, provides simple signal processing, for example, to provide noise filtering.
Communication Sub-system
C-S A (potentially long) link from each sensor sub-system to a host computer system
Multi-modal Interface Sub-system
MM-S Marshals digital data from all multi-modal sensors under the control of the Configuration and Control Program.
Processed Data Layer
PD-L Offers direct access to the collected data from each sensor, including appropriate timing information - this layer is intended for experimental use to allow analysis etc by external software and hardware.
Reconstruction Sub-system
R-P Takes the processed sensor data and provides the necessary tomographic reconstruction.
Intensive Processing Sub-system
IP-S An (optional) capability that can provide increased processing to provide real-time capabilities.
Raw Image Layer RI-L Offers direct access to the internal images produced from the reconstruction processing - allowing post-processing using external software, e.g. AVS. Data Fusion
Sub-system
DF-P Allows the combination of the multiple sensor data to reveal high-level that may be interpreted in terms of the target process.
Interpretation and Feature Fusion Layer
IFF-L Provides a common format in which to offer derived data to be passed to other systems, or logging systems.
Configuration and Control Program
CC-P Provides experimental configuration services; provide integration functions; and delivers requested outputs.
Figure 2 shows the schematic organisation of these sub-systems and data layers.
Multi-modal sensor sub-systems Core system and processing
S-S1 SD-L DA-S
[image:6.595.110.500.126.253.2]DA-S C-S IFF-L DF-S RI-L R-P PD-L MM -S C-S SD-L S-Sn CC-P
Figure 2: System Schematic Outline
The system is implemented as a set of hardware units, in the form electronic circuit cards, and software modules. Data from the various modal sensors are integrated through a host PC. The CC-P command and control module directs the sensor data acquisition and processing.
The system design provides for modal units to be deployed over a disparate plant environment. In the current implementation they may be spaced up to 20m from each other, and from the host PC. Power supplies can also be localised. This design feature is intended to suit later implementations, where each sub-system may be mounted at a specific plant site. Each sub-system could be designed to deal with specific plant requirements, such as intrinsic safety regulations, where such onerous requirements would only apply to the modal sensor parts. Although designed to support such a fully separated application, for applications in which all plant can be concentrated in one location, the units can be simply integrated into a common rack, complete with a common power supply.
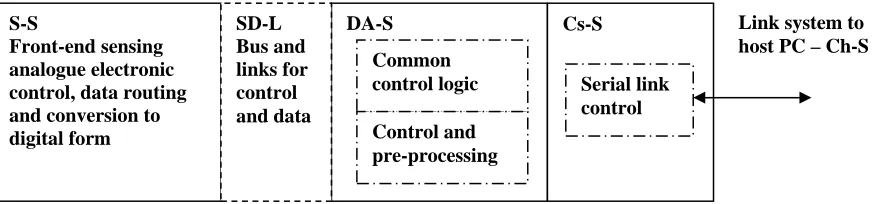
Each of the ‘front end’ sensor sub-systems, where most hardware modules are located, features a common set of functions, as illustrated in Figure 3. The functionality of the Communication sub-system is naturally split between the sensor (Cs-S) and the host (Ch-S).
Cs-S Link system to host PC – Ch-S
[image:6.595.66.502.515.617.2]Serial link control SD-L Bus and links for control and data DA-S Control and pre-processing Common control logic S-S Front-end sensing analogue electronic control, data routing and conversion to digital form
Figure 3: Sensor Sub-system Schematic Outline
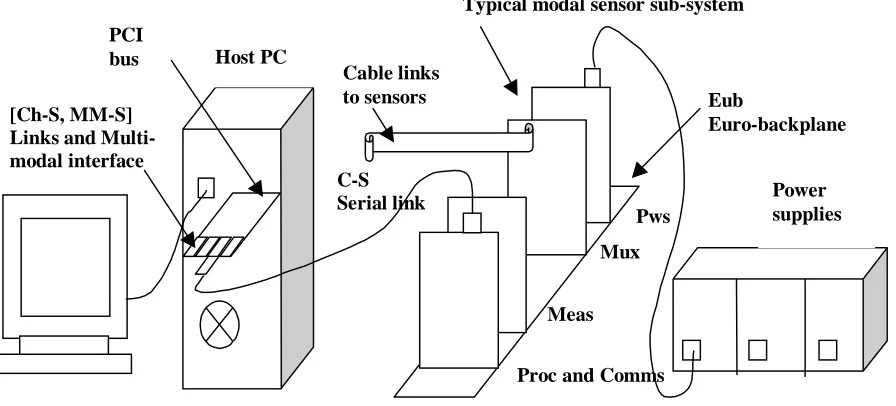
C-S Serial link
Pws
Mux
Meas
Proc and Comms PCI
bus
Eub
Euro-backplane [Ch-S, MM-S]
Links and Multi-modal interface
Typical modal sensor sub-system
Host PC
Cable links to sensors
[image:7.595.76.524.85.288.2]Power supplies
Figure 4: Multi-Modal Platform Pictorial View
Control is provided from a single processing and communication card that embraces DA-S, Cs-S functions, via the SD-L interface implemented as signal protocols and bus definitions. Protocols are defined for all sub-systems, with a number of specific modal commands. Firmware supports control flexible strategies; typically either Get single measurement or Get frame of measurements. The card receives measurement data in the digital protocol from the bus. It can also perform pre-processing tasks before forwarding the data via the Cs-S function.
The integration path between the sensor sub-systems is the high-speed communication function C-S. The current implementation exploits a commonly available, well proven wire-based solution giving a bi-directional base rate of 20Mbit/s (the limiting data rate in the current implementation). Variants could easily use optical systems, offering greater noise immunity and better intrinsic safety capability. Industry standard systems, such as IEEE 1394 Firewire, offering 100Mbit/s, could also be used.
The high-speed serial link is connected at the host PC via a single circuit card that embraces the functions of communications (Ch-S) and multi-modal interface (MM-S). This card is currently implemented to a 130Mbyte/s PCI-bus specification. It offers 4 ports and supports up to 4 multi-modal sensor systems of any mix. All sub-systems operate to a common base data protocol. At initialisation the host system interrogates all sub-sub-systems to collect their configuration information: modality, number of sensors, capabilities etc. This offers a multi-modal ‘plug and play’ capability, with a nominal data rate for each modal link of about 32Mbyte/s.
2.2 Hardware Units
The Processing and Communication Card, shown schematically in Figure 5 below, is a standard unit in all modal sub-systems.
Eurocard backplane bus
EPROM DSP Serial port
Serial
communication channel
PLD
[image:7.595.109.477.624.741.2]The Analog Devices ADSP-2181 digital signal processor (DSP) controls data acquisition and pre-processing. The EPROM initialises the DSP on power-up or reset, and holds the firmware for programmable logic device (PLD). The PLD provides interfacing functions between the modules. The serial port module receives commands and routes data to the host PC. This features a daughter card that implements the serial link hardware (currently using an inmos CO11 device).
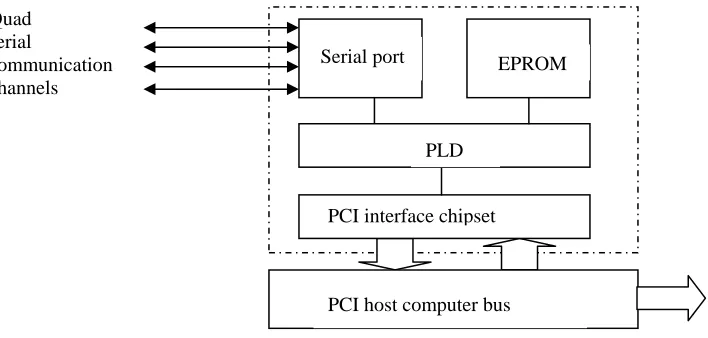
The Multi-modal Interface Card resides in the host PC and provides a high-speed interface for up to 4 modal sub-systems. The current system is implemented for a PCI host computer bus. Figure 6 provides a block diagram.
Quad serial
communication channels
DSP
Serial port EPROM
PLD
EPROM
PLD
PCI interface chipset
[image:8.595.124.478.201.370.2]PCI host computer bus
Figure 6 : Multi-modal Interface Card Block Diagram
The quad serial ports are interfaced using a PLD whose controlling firmware resides in an EPROM. To suit the Processing and Communication Card serial channel implementation, this currently employs inmos CO11 devices. The PLD also provides the bi-directional interface to a proprietary PCI chipset that in turn provides access to the host PC native bus. The PCI implementation was convenient but clearly could be simply updated in line with new technology.
A 96-pin double-sided Eurocard bus backplane is employed as the convenient hardware standard for data communication within each modal sub-system. This provides sufficient bus lines, either for the commonly-shared units of the multi-mode instrumentation, and for the local utilities of the sensor subsystem. It features 16-bit address bus/16-16-bit data bus lines and a range of power supply lines.
3. SOFTWARE MODULES AND TOOLSUITE
The data processing and software modules, in line with the requirements of the overall system, aim to facilitate the deployment of multiple sensors; and allow their individual data to be collected efficiently; combined effectively; and interpreted to suit a monitoring or control need. The design follows the modular methods used for the systems and hardware features. Wherever possible components are based on existing standards to maximise ease of further development and maintenance.
M1 M2.. Mn
011010111
(0110)(1100)..
4.56, 1.23 .. Analogue sub-system
Digital sub-system: PLD
DSP
‘plug and play’ interface
Computer system
[image:9.595.156.483.73.240.2]Required process information
Figure 7 : Composite System and Multi-modal Sensor Data Flows
The various services, particularly in the system designed for experimental prototype use, offer a software
toolsuite, in which data streams and processes may be configured to suit an experimental requirement. As
outlined above, the toolsuite relies upon key logical components, tabulated below in Table 3, with their defined abbreviations. These standardised aspects have specific meanings as applied to particular points in the data processing stream.
Data Layers -L Provide a defined link between processing elements, and facilitate external display or post-processing of the data at that point in the processing stream.
Processing programs -P Perform specific processing operations upon the data stream at that point.
Table 3 : Toolsuite logical components
To provide simplicity and portability, the core real-time software was written in C using Posix compliant extensions. The design of graphical user interface features, which build configuration files for use by real-time modules, was carried out using C++ and Java, in conjunction with graphical class libraries.
To permit flexibility in the detailed design, the general standards intentionally make no reference to the detailed form in which the data is passed between processes. The system designed for experimental use takes a particular approach that allows further flexibility. This defines the channels between processes as inter-process pipes, allowing the underlying operating system to deal with their efficient implementation. This allows users to add software modules without consideration of the underlying communication complexities.
A further feature that permits extensive processing power is the connection of the processing modules via logical stream sockets. Such sockets can link processes within a given processor, but can also be implemented via a network. In general this is realised with appropriate system drivers using TCP/IP protocol over a network, for example using an Ethernet communications link. This allows separate processors to run in parallel where appropriate.
[image:9.595.99.483.387.466.2]Microsoft Windows-NT was the selected operating systems for the host PC for the current implementation, although the toolsuite could be ported to other systems with minor effort. NT routinely provides symmetric multiprocessor (SMP) support and hence can directly exploit multi-thread parallelism. The current implementation has been used on both single and twin processor NT systems.
The following sections provide complementary details of the data layers and programs that form the toolsuite.
3.1 Sensor Sub-system Command and Control
A configuration and control program (CC-P) provides a variety of services depending upon the implementation.
In the laboratory (PC based) system implemented the program offers an ‘experimental user interface’. This provides a set of menus from which the configuration of sensors in use, data acquisition options, reconstruction options, and parameters for other modules can be set.
In the simplest case of an embedded system the CC-P could simply offer a set of pre-set timed operations to specific and constrained sensor operations. Some of the data layers may be activated to deliver continuous, or sampled, output of ‘intermediate’ or ‘final’ data. Such output would then be used for process monitoring or closed loop control applications.
In its most sophisticated mode the CC-P system could collect multiple sensor data, reconstruct each data stream, and perform on-line data fusion. When in ‘Run’ mode the system provides visual (window) displays of selected data layer channels. Thus a ‘rolling’ sensor output could be displayed, and its on-line reconstructed image (similar to a current single mode system). When in ‘Configure’ mode a simple set of options is offered. The range of sensors would be available (sensed directly from the sensor-heads and its status information). A graphical experiment designer allows the ‘interconnection’ of data streams and processes.
As described above in hardware terms, the software toolsuite must communicate with each sensor sub-system (as defined in Figure 3 above) in a standard manner irrespective of its modality. The system that facilitates this is based upon a set of commands, most of which are common to all sensor types (such as the interrogation of what device is connected to a particular link), plus a number of others special to a particular sensor type.
The following generic commands are defined: -
Initialise - return ok
Get configuration information (pass data exchange version) - return information as byte stream Get Frame
Get Single Measurement Get Status
Set Parameter e.g. Pre-amp gain Get Parameter(s)
The commands typically expect specific return data. Some returned data fields are of course, modality dependent but these will always be used only after status information has been obtained. For example: -
Get Status Command (Identify attached device) 1: System Type: (1 byte)
most significant 4 bits define type: 1-ECT, 2-ERT, 3-UST least significant 4 bits define version: 0-15
2: Sensing planes: 0-64K (2 bytes) 3: Sensors per plane: 0-64K (2 bytes)
4: Measurement resolution (number of bits): 0-255 (1 byte)
This command in effect implements the ‘plug and play’ sensor feature described in the hardware and systems engineering review above. Each Sensor sub-system is connected to the Multi-modal interface and is interrogated on initialisation. A typical (abbreviated) status information return from this interrogation process is:-
TFC-VCIPT-1.0
CONTACT = [email protected] #SENSOR_INTERFACE
DATA_EXCHANGE_VERSION = 0 SENSOR_MODALITY = UST HARDWARE_VERSION = 0 SOFTWARE_VERSION = 0 SYSTEM_ID = 1
COPYRIGHT = Virtual PT Group
MANUFACTURER= VCIPT Systems Group NUMBER_OF_PLANES = 1
NUMBER_OF_SENSORS_PER_PLANE = 16 #END
Get Single Measurement Command (Only perform measurement on selected sensors and return value,) ECT, ERT system (Arguments: Sensor 1, Sensor 2)
1: Measured value (1-2bytes) US system (Arguments: Emitter) 1: No. of data points (2 bytes) Data points in following format: a: Emitter (1 byte)
b: Receiver (1 byte)
c: Time of flight (1-2 bytes depending on defined resolution)
Further special command groups are defined to provide control over special functions of Sensor subsystems types. For example, for the UST Sensor sub-system: -
Send Statistics Command (Return values of how many echoes each transducer has received and generated) 1: Reflected echoes received (Number of sensors x 1-2 byte)
2: Reflected echoes generated (Number of sensors x 1-2 byte) 3: Transmitted echoes received (Number of sensors x 1-2 byte) 4: Transmitted echoes generated (Number of sensors x 1-2 byte)
Fire Transducer Command (Trigger one transducer without initiating the acquisition process) (Arguments: Transducer No.)
3.2 Sensor and System Data Processing
A range of processing facilities is available within the system.
Firstly the DSP capability that forms part of the Sensor sub-system offers an opportunity to process and to reduce the data before it is forwarded to the host computer. Specific firmware can be downloaded to a Sensor-subsystem in ‘design’ mode. A wide range of pre-processing modules are possible, some generic, but most will be modality dependent. An obvious generic example is the removal of systematic noise through the use of a digital filter. A specific modal example, for UST, sieves the data, removing unwanted (out of bounds) echoes.
At the second level the toolsuite is able to accommodate a variety of reconstruction algorithms provided for multiple modalities, from simple linear back-projection to more accurate, but less adaptable, model based algorithms that may be used for specific applications. A range of reconstruction algorithms, specified in the overall architecture as R-P, have been used.
standard (RI-L), has been defined, this employs a header to identify the experimental test, the time link in the test and the general format, number of pixels, bits per pixel, colour planes etc.
Facilities are also included to permit data streams to be systematically fused, as defined in the system architecture, (DF-P). Since all data is time stamped the critical basis for the combination of data streams is provided. In general data fusion is facilitated through the integration of sequences of images through a given algorithm. This includes the ability to ‘shift’ one set of images relative to another (to account for transport delays); and the possibility of deriving statistical interpretations. The general facility to incorporate modular data may be exploited to include interpretation algorithms in the data processing stream. Model based data fusion can also be accommodated (West and Williams, 1999).
Resulting interpreted data could offer a set of ‘user data’ values designed to interface to process monitoring and control systems. For example a mixing interpretation algorithm could offer a ‘mixing index’ that defines the spatial disparity in a cross-section. The interpretation layer (IFF-L) allows this data to be extracted.
4. SENSOR SUB-SYSTEMS
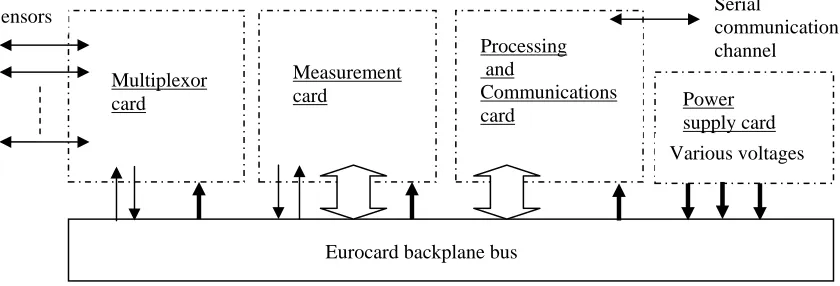
Typical sensor sub-systems have the features shown generically in Figure 3, with some modal variations. Their general configuration is illustrated below in Figure 8.
Serial
communication channel Measurement
card
Processing and
Communications card
Multiplexor
card Power
supply card Various voltages Sensors
[image:12.595.77.497.327.470.2]Eurocard backplane bus
Figure 8 : Typical Sensor Sub-system Block Diagram
4.1 Electrical resistance tomography sensor sub-system
The Electrical Resistance Tomography (ERT) sensor sub-system is composed of circuit cards that correspond with the typical generic view of Figure 3, and the block diagram of Figure 8 above. In this case the sensors are conducting electrodes that are typically in contact with the process, but need not intrude (Dickin and Wang 1996, Brown, Barber and McArdle 1992, Wang, Dickin and Williams 1997). The drive unit produces sinusoidal currents that are used to estimate a tomographic trans-conductance projection.
The standard Processing and Communication Card receives a command to obtain a measurement or frame. The corresponding data is then obtained. The Measurement Card features direct digital synthesis (DDS) chips for sinusoidal excitation for the selected electrodes through a voltage controlled current source (VCCS). The current source is fed via the bus to the Multiplexer Card. The card uses high-speed CMOS analogue switches.
The Multiplexor Card can support up to 16 electrodes; multiple cards can be used together for larger groupings of electrodes, for example to implement multiple planes. Measurements are routed to a 12-bit, 10µs, sampling analogue to digital converter for high precision data.
4.2 Electrical capacitance tomography sensor subsystem
The Electrical Capacitance Tomography (ECT) sensor subsystem also corresponds in general terms to Figures 3 and 6, although the drive and measurement functions are split in this case between two cards. Sensors are typically plate electrodes that may either be insulated from, or in contact with, the process material. As in the ERT case they need not intrude. The drive unit produces charging currents for the effective capacitors created by electrode pairs, and the measurement of electrode voltages may be used to estimate the corresponding tomographic capacitance projection (Xie et al 1992).
The standard Processing and Communication Card receives a command to obtain a measurement or frame. A separate Signal Generation Card generates the sinusoidal excitation signal used to drive the electrodes, and a synchronised reference signal for phase demodulation. Two direct digital synthesis (DDS) chips are employed to generate the sine waves. Sinusoidal excitation has been employed, rather than the conventional charge-discharge approach, to achieve improved signal to noise performance, stability and flexibility. This approach is based on a prior design (Yang and York 1999). A single excitation signal can be applied to selected electrodes and, similarly, selected electrodes are employed as detectors. This provides the requisite measurements on demand in response to commands. Excitation strategies can be designed flexibly to suit experiments and are not rigidly imposed by the hardware design. Features of the card include phase adjustment between 0° and 360°, with 0.09° resolution, and large capacitance driving capability up to 1000pF.
The excitation signal is passed to a Multiplexor Card, each of which supports up to 8 electrodes; multiple cards can be used together as in the ERT case. The card uses high-speed monolithic CMOS analogue switches. Tests indicate that the coupling capacitance between switches is not significant. A current to voltage converter is employed prior to amplification to produce robust signals for routing via the backplane bus.
The Measurement Card comprises core functions for demodulation, low pass filtering, electrode common-mode noise cancellation, signal offsets, programmable gain amplifier and analogue to digital conversion.
Resulting tomographic data is again routed to the host via the Processing and Communication Card.
4.3 Ultrasound tomography sensor sub-system
The Ultra-Sound tomography (UST) sub-system centres upon a fan-shaped beam piezoelectric transducer, able to operate in both reflection and transmission modes (Hoyle 1996, Yang et al 1999). In this case the Measurement Card and Multiplexor Card functions are integrated onto a single card.
A standard Processing and Communication Card is used and, as usual, obtains system commands. The composite Multiplexor and Measurement Card supports up to 16 transducers. It also has 8 small daughter cards mounted upon it. These provide the high voltage pulser function for pairs of transducers. As in the electrical tomography case, multiple cards can be used together to support more transducers. Systems have been used successfully with 3 cards, supporting 48 transducers.
When a command is received by the Processing and Communication Card, its DSP processor will instigate the requisite sequence of transducer excitations. The first transducer is fired. Typically all active receivers are then triggered for amplified time gain control (TGC) operation. If a pre-set threshold is exceeded a digital event is logged. These are routed to the DSP that samples these received event logs until the latest time that a received event is possible. The next transmit transducer is then fired and the process is repeated.
5. SYSTEM TRIALS
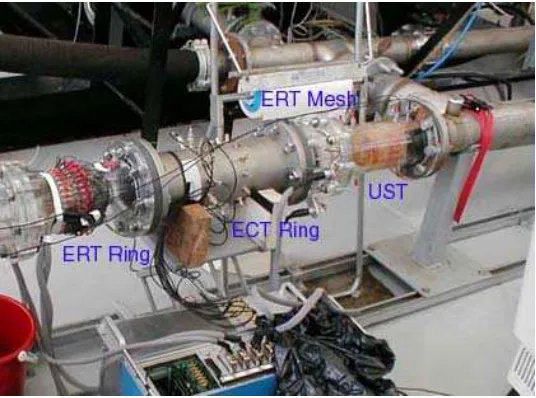
[image:14.595.164.432.223.422.2]A multi-sensor system designed and implemented as described above was used to study a multi-component flow process. The composite sensor system includes ERT, ECT, UST (tomographic) sensors, plus single point temperature and pressure sensors and an MPEG video camera. The sensors are mounted, as shown in Figure 9 below, in a pipe section in an experimental flow loop. Two electronic sub-system racks can be seen, these hold the ECT and ERT sensor sub-systems. The ECT rack is nearest the pipeline, with a distinct set of thin cables leading to the ECT Ring. The ERT rack is furthest from the pipeline with a smaller set of composite sheathed cables leading to the ERT Ring at the left side. The single-point temperature, pressure and video channels are coupled directly to the computer system (not shown). The colour video camera is mounted behind the right-hand sensor unit to view the process mixture entering the rig from the right.
Figure 9: Multi-sensor Flow Measurement System
Unseen at the right side of the pipeline shown is a long section to permit the flow to ‘develop’ a reasonably steady profile. Many of the tests involved stratified horizontal flows in which the degree of evolution over the length of the set of sensors was small. It is clear that, in general terms, the evolution of the flow over the length of the sensor set is a critical issue if multiple sensors are deployed.
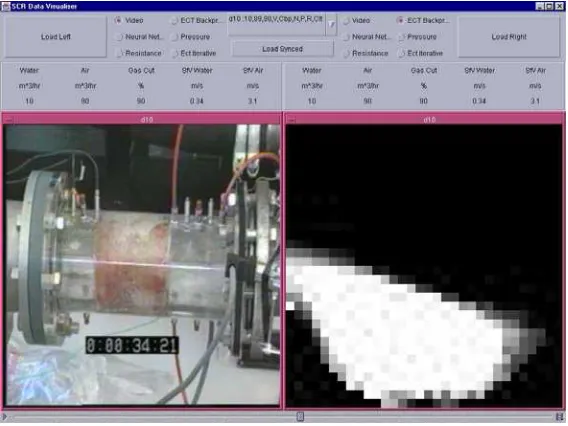
Figure 10: MPEG video data integrated with ECT sensor images
In Figure 11 the same dataset is further processed using an estimation algorithm that provides a direct estimation of liquid fraction (the left-hand bar diagram), and the liquid interface angle (the circular diagram).
Figure 11: Further interpretation processing applied to PT data
[image:15.595.149.435.344.555.2]Figure 12: Time history of estimated parameters
Others opportunities exist to integrate the single point measurement data into a composite model.
6. EVALUATION AND CONCLUSIONS
The system described has been successfully employed in a range of trials and has provided fully synchronised multiple tomographic measurements using ECT, ERT, UST modalities and ancillary non-tomographic data, including sampled pressure, temperature and several channels of MPEG sampled video. The mass synchronised data provides, perhaps for the first time, the ability to perform complex data fusion between the multiple process tomography data sets and test process models.
The high degree of standardisation in the systems described, and the systematic opportunity to fuse data together, in conjunction with a process model, provide a valuable tool that can potentially lead to improved process understanding, design and control.
ACKNOWLEDGEMENTS
The authors are grateful for the support of the UK Office of Science and Technology Foresight Challenge, and to the industrial collaborators who have taken part in this research project: Astra-Zeneca, BP-Amoco, Corus Group, Disperse, Du Pont, ICI, Imerys, Malvern Instruments, Pilkington, Process Tomography, Schlumberger
Cambridge Research.
REFERENCES
Brown, B H, Barber B, McArdle FJ, 1992, ‘Applied potential tomography’, Patent PCT/GB92/01156 (other registrations in GB, Japan and USA).
Dickin F, Wang M, 1996, ‘Electrical resistance tomography for process tomography’, Meas. Sci. & Tech., 7, pp247-260
Hoyle B S, 1996, ‘Process tomography using ultrasonic sensors’, Meas. Sci & Tech., 7, (3), pp272-280.
Wang M, Dickin FJ, Williams RA, 1997, ‘Electrical impedance tomography’, Patent EP0749285B1 (also in JP and USA).
West R M, Williams R A, 1999, ‘Opportunities for data fusion in multi-modality tomography’, Virtual Centre for Industrial
Williams RA and Beck M S (ed), 1995, Process Tomography - Principles, Techniques and Applications, Butterworth-Heinemann.
Xie C G, Huang S M, Hoyle B S, Thorn R, Lenn C, Snowden D and Beck M S, 1992, ‘Electrical capacitance tomography for flow imaging - system model for development of image reconstruction algorithm and design of primary sensors’,
Proceedings IEE Part G, 139, (1), pp89-98.
Yang W.Q., York T.A, 1999, 'A New AC-based Capacitance Tomography System', IEE Proc. Sci., Meas. and Technology : 146, (1), pp47-53