Performance Assessment of the Recurrence of
Cardiovascular Pathologies Symptoms in
a Hypertensive Population
Noel Dougba Dago1,2,*, Nafan Diarrassouba1, Hermann-Désiré Lallié1,2, Souleymane Silué1,
Tuo Yalamoussa2, Inza Jesus Fofana1, Edouard Kouamé N’goran1,2,
Florent Adjiman Kimou3, Adama Coulibaly1,4
1Unité de Formation et de Recherche (UFR) des Sciences Biologiques, Département de Biochimie et de Génétique, Université Peleforo Gon Coulibaly, Korhogo, Côte d’Ivoire
2Unité de Formation et de Recherche (UFR) des Sciences Biologiques, Département de Biologie Animale, Université Peleforo Gon Coulibaly, Korhogo, Côte d’Ivoire
3Centre Hospitalier Régional (CHR), Services Généraux de Cardiologies, Korhogo, Côte d’Ivoire
4Unité de Formation et de Recherche (UFR) des Biosciences, Laboratoire de Pharmacodynamie-Biochimique, Université Felix Houphouet Boigny, Abidjan, Côte d’Ivoire
Abstract
Cardiovascular diseases (CVDs) represent one of the biggest health problem worldwide. However, rural community populations in several underdeveloped countries (i.e. Cote d’Ivoire) were not adequately informed regarding symptoms of this grave pathology. The present study, assesses the recurrence of CVD symptoms in a hypertensive patient population from the General Hospital of Korhogo (northern of Cote d’Ivoire). In total, 111 hypertensive patients were processed for assessing the recurrence of CVD symptoms, which were clustered in (i) functional, (ii) physical, (iii) electrocardiogram and (iv) heart echography (echo Doppler) analyses. Interaction survey among symptoms of processed hypertensive patients were performed using multivariate statistical analysis with several analytical tests. Our findings exhibited heart echography (echo Doppler) as a reliable and reasonable approach evaluating the reappearance of cardiovascular pathology symptoms in the considered populations (p-value<0.05). However, performed statistical analysis, based on both R fitting curve and multiple linear regression surveys, suggested electrocardiogram and functional analyses as acceptable systems for discriminating hypertensive patients when compared to physical approach (p-value<0.05). Further, the same survey recognizing the echo Doppler as a suitable approach in CVDs diagnosis procedure, advised a careful examination of the latter weighing hypertensive patient symptoms. Finally the present survey, by processing both R biplot and principal component analysis, exhibited (i) hypertensive cardiomyopathy (p-value<0.05), (ii) insufficiency provoked by aortic micro leakage, (iii) deficiency induced by mitral micro leakage, (iv) cardiomyopathy triggered by decreasing performance of the myocardial and (v) high blood pressure (HBP) as well as abnormal relaxation of heart left ventricle as determinant and recurrent symptoms in the presently analysed hypertensive patient populations. In conclusion this study proposed a computational statistical methodology evaluating the recurrence of CVD symptoms in northern of Cote d’Ivoire hypothesizing echo Doppler heart echography as well as electrocardiogram analyses as exhibiting high sensitivity and performance measuring hypertensive patient symptoms, reinforcing the usefulness of echocardiography in clinical practice.Keywords
Hypertensive Patients, Cardiovascular Disease (CVD), Symptoms, Echocardiography, Echo Doppler1. Introduction
Cardiovascular diseases (CVDs) are a major source of morbidity and mortality worldwide [1, 2]. In the field of cardiovascular disease, study using the epidemiological have
* Corresponding author:
[email protected] (Noel Dougba Dago) Published online at http://journal.sapub.org/health
Copyright © 2017 Scientific & Academic Publishing. All Rights Reserved
early stages of these diseases are fully investigated. Numerous studies provide relationship analysis between cardiovascular disease occurrence and probable associated symptoms, promoting early diagnostic as an efficient methodology preventing hypertensive and/or arteriosclerotic cardiovascular disease as heart disease symptoms can be caused by several malfunction in the cardio-circulator system [4]. Then, symptoms of heart disease in blood vessel (arteriosclerotic disease) is caused by narrowed, blocked or stiffened blood vessels that prevent heart or other parts of body from receiving enough blood. CVD symptoms may be different for men and women. For instance, men are more likely to have chest pain (angina), while women expected symptoms such as shortness of breath, nausea and extreme fatigue. Moreover, some heart disease symptoms have been caused by abnormal heartbeat (heart arrhythmias) and hear defect that usually become evident soon after birth. Indeed, heart arrhythmia symptoms can include fluttering in chest, tachycardia, bradycardia (slow heartbeat), chest pain or discomfort, shortness of breath, light-headedness. In addition, heart disease caused by weak heart muscle named cardiomyopathy (dilated cardiomyopathy) in the early stage exhibits any symptoms as opposed to heart pathology provoked by infections. There are three types of heart infections; pericarditis which affects the tissue surrounding the heart (pericardium), myocarditis that affects the muscular middle layer of the walls of the heart (myocardium) and endocarditis affecting the inner membrane that separates the chambers and valves of the heart (endocardium). However, structure studies showed that heart has four valves (aortic, mitral, pulmonary and tricuspid valves) that open and close to direct flow through heart. Valves may be damaged by a variety of conditions leading to narrowing (stenosis), leaking (regurgitation or insufficiency) and improper closing (prolapse). So, depending on which valve isn’t properly working, valvar heart disease symptoms generally include fatigue, shortness of breath, irregular heartbeat, and ankles and chest pain and fainting. Hypertension is a majored correctable cardiovascular risk factor. The correct diagnosis of hypertension and precise assessment of cardiovascular risk are essential to give proper treatment in patients with hypertension [5]. Although the echocardiographic examination is usually recommended as a second-line study in the evaluation of hypertensive patients, it is one of most commonly used imaging modality and has given insights in to pathophysiology and clinical implications in patients with hypertension. It can detect anatomical and functional changes easily in a real-time, quick, and reproducible manner [6]. Echocardiography is more sensitive for the detection of asymptomatic organ damage that can be used as a determinant of cardiovascular risk. So, it is important in the clinical management in selected hypertensive patients. However, we believe that an adequate knowledge of heart disease symptoms by applying adequate diagnostic system can greatly contribute for preventing CVD risk, since heart malady is easier to treat when detected early. This is
especially important for patient that have a family history of heart disease. Nevertheless, concerns regarding CVD risks and symptoms occurrence, are toughly ignored by normal population (person with any hypertensive health problem), especially in under developed countries where heart disease risk is becoming a serious public health problem. Here, we proposed in contrast to this inclination, a computational statistical analysis assessing the recurrence of CVD symptoms in a hypertensive patient population sample selected at the General Hospital (GH) of Korhogo (in northern of Cote d’Ivoire) with the purpose to adequately inform rural and urban as well as scientific community of this geographic area, vis-à-vis heart disease that represents a grave health issues worldwide.
2. Material and Methods
2.1. Data Collection
We were interested to evaluate the recurrence of cardiovascular disease (CVD) symptoms in northern of Cote d’Ivoire, since locale population were not adequately informed regarding the appearance of heart diseases and/or troubles and/or cardiovascular pathologies. We collected data as regard 111 hypertensive patients at the Cardiology Department (CD) of the General Hospital (GH) of Korhogo (northern of Cote d’Ivoire). Collected data, regard 2016 year entirely and included patients from several areas in northern of Cote d’Ivoire, since CVDs diagnosis in this area, were performed exclusively at the Cardiology Department of the GH of Korhogo. Next, we organized hypertensive patients and clustered analysed symptoms in four different groups as below reported (Table 1).
2.2. Computational Statistic Analysis
Our analysis comprised in total 111 adult hypertensive patients including both sex. Qualitative data that indicated the presence and/or the absence of CVD symptoms were, transformed in numeric with R software function
“as.numeric” in “zero” (0) indicating absence and/or “one”
CVD symptoms. Also, we achieved a Multivariate Exploratory Data Analysis (MEDA). For this purpose we used the data mining FactoMineR package which offers a large number of functions for exploratory factor analysis [15]. In addition, our statistical analysis included R software
lm (linear model) function and/or script with the purpose to establish the relationship between recurrent CVD symptoms detected in our processed patient populations. Print summary function of thelinear model (lm) script allowed to evaluate
via analytical statistical tests, the permanency of developed multiple linear regression model. Finally, statistical pipeline used for the present study included several principal component analysis modules (i.e. R biplot package) allowing detailed and visual interaction exploration between factors (symptoms) and individual (hypertensive patients) parameters.
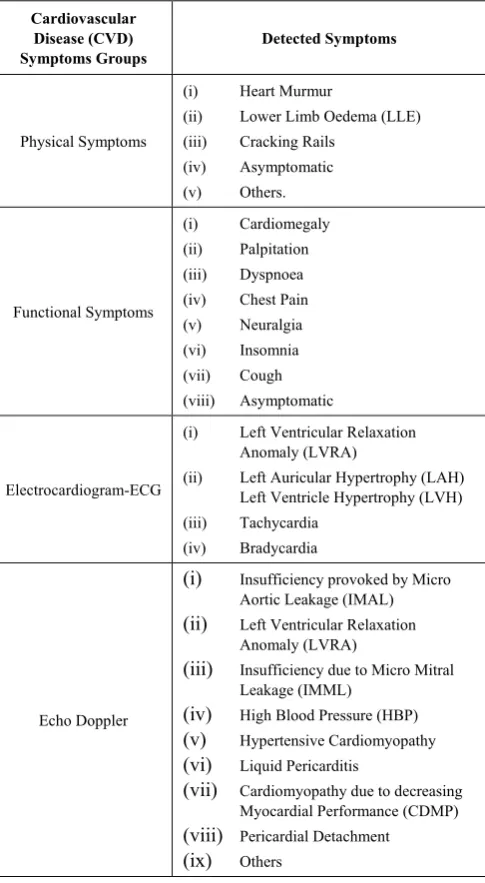
Table 1. Clustering of analysed Cardiovascular Disease (CVD) symptoms in four different groups
Cardiovascular Disease (CVD)
Symptoms Groups Detected Symptoms
Physical Symptoms
(i) Heart Murmur
(ii) Lower Limb Oedema (LLE) (iii) Cracking Rails
(iv) Asymptomatic (v) Others. Functional Symptoms (i) Cardiomegaly (ii) Palpitation (iii) Dyspnoea (iv) Chest Pain (v) Neuralgia (vi) Insomnia (vii) Cough (viii) Asymptomatic
Electrocardiogram-ECG
(i) Left Ventricular Relaxation Anomaly (LVRA)
(ii) Left Auricular Hypertrophy (LAH) Left Ventricle Hypertrophy (LVH) (iii) Tachycardia
(iv) Bradycardia
Echo Doppler
(i) Insufficiency provoked by Micro Aortic Leakage (IMAL)
(ii) Left Ventricular Relaxation Anomaly (LVRA)
(iii) Insufficiency due to Micro Mitral Leakage (IMML)
(iv) High Blood Pressure (HBP)
(v) Hypertensive Cardiomyopathy
(vi) Liquid Pericarditis
(vii) Cardiomyopathy due to decreasing Myocardial Performance (CDMP)
(viii) Pericardial Detachment
(ix) Others
3. Results
3.1. Proportion Analysis of Cardiovascular Pathology Symptoms in Hypertensive Patient Populations
Functional and physical analyses appeared least informative assessing cardiovascular pathology symptoms since more than 60% hypertensive patient populations were recorded as asymptomatic (Figure 1). However, the same analysis referring to these two factors suspected dyspnoea and lower limb oedema as potential recurrent cardiovascular disease (CVD) symptoms (p-value>0.1). Also, pie diagram (symptoms proportion survey), proposed heart echocardiography examination based on echo Doppler analyses, as a reliable methodology evaluating cardiovascular disease symptoms comparing to functional (ratio of variance=0.21; p-value=0.041), physical (ratio of variance=0.03; p-value=0.0002) and electrocardiogram (ratio of variance=0.34; p-value=0.19) approaches, suggesting hypertensive cardiomyopathy (p-value=0.01), insufficiency triggered to the mitral micro leakage (p-value=0.01), insufficiency provoked by the aortic micro leakage (p-value=0.2) as potential recorded recurrent CVD symptoms (Figure 1). Moreover, electrocardiogram analyses (less variable parameter and/or factor when compared to echo Doppler analyses) suggested left ventricle hypertrophy (LVRA) as a recurrent CVD symptoms handing out our described hypertensive patients (Figure 1). Considering as a whole, the present survey recognizing physical, functional, electrocardiogram and echo Doppler approaches as acceptable systems for discriminating hypertensive patient symptoms, advised a relevant discordance between the latter’s in CVDs diagnosis procedure (Figure 1).
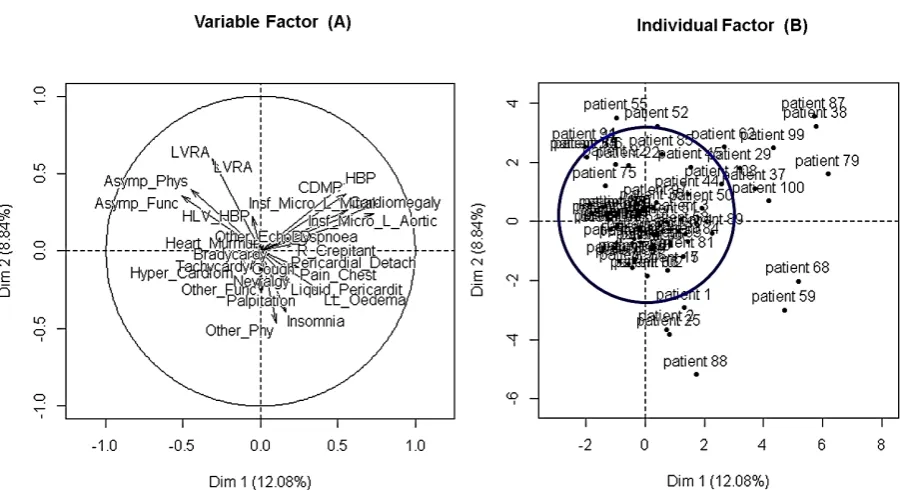
3.2. Assessment of Hypertensive Patients Behaviours by Principal Multifactorial Analysis Discriminating Cardiovascular Disease Symptoms
need careful and accurate interpretation discerning cardiovascular disease and/or pathology symptoms for the presently considered hypertensive patient populations.
3.3. Comparison between Detected Cardiovascular Disease Symptoms by Variance Parameter
Next we clustered analysed cardiovascular disease (CVD) symptoms in functional, physical, echo Doppler and electrocardiogram analyses (see Table 1 of material and methods chapter) with the purpose to simplify their interaction analysis. Then, descriptive statistical survey showed that 84% of hypertensive patients processed by echo Doppler approach were recognized as exhibiting CVD symptoms. Further, 42%, 43% and 12% of handled hypertensive patients by functional, electrocardiogram and physical approaches respectively were recognized as displaying cardiovascular pathology symptoms (Table 2). However, echo Doppler analyses exhibited a high variability
assessing hypertensive patient symptoms with respect to the other’s processed CVDs diagnosis approaches (p- value<0.05) (Figure 3 and Table 2). Moreover, this survey subtly proposed (i) echo Doppler and (ii) both functional and electrocardiogram diagnosis systems as valid methodologies because of exhibiting high sensitivity as opposed to physical analyses evaluating the recurrence of CVD symptoms in our analysed hypertensive patient populations. However, our findings advised that previous mentioned CVD diagnosis approaches (echo Doppler, electrocardiogram and functional parameters) needed careful check-up discerning hypertensive patient symptoms especially for heart echocardiography results and/or data interpretation (echo Doppler) (Figure 3). Considering as a whole, this survey suggested highest sensitivity of echo Doppler approach in the present CVD diagnosis survey, warning cautious interpretation of the latter (echo Doppler) in discerning among hypertensive patient’s symptoms.
Figure 1. Pie Diagram analysing hypertensive patient proportion assessing cardiovascular disease and/or pathology (CVD) symptoms
Table 2. Descriptive statistic assessing the recurrence of cardiovascular disease (CVD) symptoms in hypertensive patient population
Functional Symptoms Echo Doppler Symptoms Physical Symptoms Electrocardiogram Symptoms
Proportion of detected
hypertensive patients (%) 0.42 0.84 0.12 0.43
¼Quartile 0 0 0 0
¾Quartile 1 1 0 1
Variance 0.3 1.07 0.11 0.34
Figure 2. Principal component multifactorial analysis assessing hypertensive patient behaviours and/or reply vis-à-vis of processed cardiovascular disease (CVD) symptoms
3.4. Parallel PCA Survey Explaining the Variability Observed in the Hypertensive Patient Populations
This chapter aims to highlight hypertensive patient’s responses vis-a-vis of detected cardiovascular disease (CVD) symptoms. The principal component analysis (PCA) identified three (3) components as suitable for parallel analysis and discriminated two factors and/or components as involved in the discrete and/or relative variability observed in the processed hypertensive patient populations (Figure 4 panels 2A and B). Also, two factors and/or parameters displayed experimental observed data higher than the median value of theoretic data and/or observations (Figure 4 panel A). Then, integrating the present results with those reported in Table 1, we suspected both echo Doppler and electrocardiogram-ECG factors and/or parameters and/or analyses as the sources of variability observed among the processed hypertensive populations. These results are in accord with the previous one (Figure 3), since echo Doppler and electrocardiogram parameters exhibited a good concordance in term of variance proportion, when they evaluate the recurrence of CVD symptoms in the presently considered hypertensive patient populations. Further, Figure 4A showed both echo Doppler and electrocardiogram-ECG as favouring realistic observations as opposed to physical and functional factors, suggesting the formers as suitable diagnosis approaches evaluating hypertensive patient’s symptoms (Figure 4).
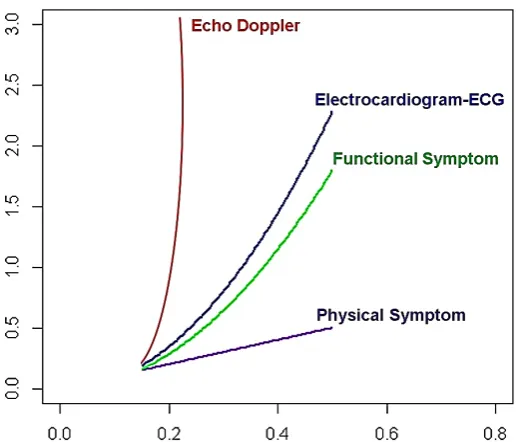
3.5. R Fitting Curve Analysis Comparing Functional, Physical, Electrocardiogram-ECG and echo Doppler Analyses Processing Hypertensive Patients
For this analysis we used R software fitting curve script (function) which is the process of constructing a curve, or
mathematical function, which has the best fit to a series of data points. Also, this survey aid for data visualization to summarize the relationships between physical, functional, electrocardiogram and echo Doppler analyses variables. We performed R fitting curve analysis comparing CVD symptoms detected by functional, physical and electrocardiogram approaches with echo Doppler results, with the purpose to weigh CVD symptoms in the presently processed hypertensive patient populations. The results of this survey by applying polynomial curves function were summarized in Figure 5 and evidenced two (2) tendencies. In fact, fitting curves associated to echo Doppler (red curve), electrocardiogram (bleu curve) and functional (green curve) analyses exhibited strong rise with respect to fitting curve associated to physical analyses (violet curve) (Figure 5). However, Figure 5 supported all analysed diagnosis systems and/or approaches as capable to give satisfactory responses evaluating CVD symptoms as well as presented echo Doppler and electrocardiogram analyses as exhibiting high performance assessing the recurrence of CVD symptoms in the processed hypertensive patients (Figure 5). Taking together, these results reinforced integration between echo Doppler and electrocardiography approaches as satisfactory practices evaluating CVD symptoms, regardless their high variance calling hypertensive patients.
3.6. Multiple Linear Regression Model Assessing Relationship between Electrocardiogram,
Functional and Physical Analyses and echo Doppler
equation (E1): EDS= 0.25 Physical Symptom + 0.3
Electrocardiogram + 0.17 Functional Symptom +0.88;
where EDS indicates CVD symptoms detected by echo Doppler approach. Interestingly, these results wholly supported the previous one (Figure 5). Indeed, the first comment of this result could be that physical, electrocardiogram-ECG and functional parameters exhibited decent concordance with echo Doppler approach in discerning CVD symptoms. However, statistical p-value referred to the estimate parameters associated to both functional (p-value=0.33) and physical (p-value=0.39) factors, suggested a low propensity of the latter’s assessing correctly hypertensive patients symptoms when compared to electrocardiogram-ECG approach (p-value=0.08) and when echo Doppler analyses was assumed as the benchmark. So,
merging the present result with those described in Figure 5, we delicately excluded physical CVDs diagnosis approach as decisive component evaluating the recurrence of cardiovascular pathology symptoms in the presently studied hypertensive patient populations. The same analysis displayed (E1) equation graph intercept coefficient value as
relatively statistically significant (p-value=0.08) and exhibited 1.03 as residual standard error value (p-value=0.2), advising a discrete stability of the developed multiple linear regression model. Taking together, our findings demonstrated integration between echo Doppler and electrocardiogram-ECG analyses as practical methodologies evaluating hypertensive patient’s health status as well as for discriminating the recurrence of CVD symptoms.
Figure 3. Z-score heat-map weighing variance relationship between functional, physical, objective and echo Doppler approaches in detecting CVD symptoms
Figure 5. R fitting curve analysis comparing echo Doppler, physical, objective and functional symptoms in cardiovascular pathology diagnostic process
Table 3. Descriptive statistic survey processing echo Doppler results processing cardiovascular disease (CVD) symptoms
Insufficiency (Micro
Aortic Leakage)
Insufficiency (Micro Mitral Leakage)
LVRA Cardiomyopathy Hypertensive HBP CDMP Pericarditis Liquid Detachment Pericardial Others
Hypertensive Patient
Number 15 17 15 23 10 6 5 2 1
Variance 0.12 0.13 0.12 0.00 0.08 0.05 0.04 0.02 0.01
Standard
Deviation 0.34 0.36 0.34 0.00 0.29 0.23 0.2 0.14 0.09
3.7. Biplot Principal Component Analysis Evaluating Echo Doppler Results Evaluating Cardiovascular Disease Symptoms
As the echo Doppler approach exhibits the highest sensitivity checking for CVD symptoms, we performed a principal component survey focusing on heart echography results exclusively. Then, merging previous results described in Table 3 with those stated in Figure 1 (see upper), we showed hypertensive cardiomyopathy as the most recurrent CVD symptom (p-value<0.05) among process patients, since it displayed the highest sensitivity associated with a lower variance in calling hypertensive patients (Figure 6 panel A and Table 3). These results evoked the high precision as well as high sensitivity of echo Doppler approach discerning for hypertensive patients with hypertensive cardiomyopathy concerns. Also, the first principal component (PC1) parameter of R Biplot graphic proposed (i) aortic deficiency, (ii) insufficiency provoked by mitral micro leakage and (iii) CDMP as recurrent symptoms monitoring the present hypertensive population as opposed to high blood pressure (HBP), abnormal relaxation of heart left ventricle and pericarditis liquid symptoms (Figure 6 panel B). The same analysis, considering the second principal component (PC2) parameter, suggested high blood pressure (HBP) as a satisfactory factor for discriminating hypertensive patients and excluded pericardial detachment and other symptoms as recurrent CVD symptoms (Figure 6). Taking together, this survey strengthened echo Doppler as an adequate tool processing hypertensive patient populations and recorded hypertensive cardiomyopathy (p-value<0.05), insufficiency provoked by both aortic and mitral micro leakage, CDMP and high blood pressure (HBP) as determinant and recurrent symptoms processing hypertensive patients (Figure 6 and Table 3).
4. Discussion
Cardiovascular Diseases (CVDs) encompass any medical conditions related to the heart and blood vessels and remain the biggest cause of deaths worldwide according to World Health Organization (WHO) report [16]. Hypertension represents a major and correctable cardiovascular risk factor. The right diagnosis of hypertension and accurate assessment of cardiovascular risk are essential to give appropriate treatment to hypertensive patients. Heart malady is the leading cause of death and a major cause of medical expenditures in the United States as well as worldwide [16-18]. Although cardiovascular diseases (CVDs) problematics were strongly investigated and evoked by the scientific community, certain populations in many underdeveloped countries (i.e. northern of Cote d’Ivoire) were not sufficiently informed apropos cardiovascular pathology risk factors. Generally, the interactions between symptoms and CVDs occurrence are complex, and it is important to keep in mind that the prevention of cardiovascular risk factors is strongly correlate with right
lethality of this grave pathology in northern of Cote d’Ivoire as well as worldwide. Although echocardiography plays a key role in the evaluation of hypertensive patients, it gives many clues suggesting bad prognosis associated with hypertension, increased left ventricular (LV) mass, decreased LV systolic function, impaired LV diastolic function, and increased left atrial size and decreased function [5]. Moreover, assessment of left ventricular mass by echo Doppler offers prognostic information beyond that provided by traditional risk factors, which can improve the ability to identify individuals at high risk for cardiovascular disease [19, 20]. However, heatmap graph survey based on z-score variance analysis, advised relative agreement between physical, functional and electrocardiogram-ECG parameters assessing hypertensive patient symptoms, since exhibiting comparable variance value (Figure 3 and Table 2). Also, this analysis subtly suggested careful examination of the echocardiography provided by echo Doppler approach (because of high variability) taking decision in CVD diagnosis procedure. This observation suggested that conventional echocardiography has many pitfalls in the interpretation of several echocardiographic parameters. Then, doctors should analyse and interpret echocardiographic findings in conjunction with other conventional analyses; i.e. electrocardiogram (ECG) graph examination [5, 21]. Furthermore developed parallel principal component analysis (PCA) exhibited both echo Doppler and electrocardiogram (ECG) approaches as the source of the variability observed among processed hypertensive patient populations (Figure 4). Nevertheless, the output file of this analysis (a scree graph reported of Figure 4), which compared theoretic (grey dots) and observed (black dots) variance values advised CVD symptoms detected by both electrocardiogram and echo Doppler (echocardiography) analyses as reflecting the most realistic heart health status of our considered hypertensive patients (see also Table 2) [8, 22, 23]. Then, although echocardiography is not a crucial first line imaging study, the present survey are proposing echo Doppler as an excellent tool for the assessment of future cardiovascular risks. Therefore, guided by these findings, we evaluated the relationship between echocardiography (echo Doppler), functional, physical and electrocardiogram analyses by an R fitting curve analysis weighing CVD symptoms recurrence in the presently studied hypertensive populations (Figure 5). R fitting curve analysis function [9] which is the process of constructing curve, or mathematical function, that has the best fit to a series of data points [11] has been used as an aid for data visualization [9, 12] to summarize the relationships between processed echo Doppler, functional, physical and electrocardiogram approaches. These results reinforced the right attitude (high sensitivity) as well as the high performance and reliability of echo Doppler analyses discerning among cardiovascular pathologies symptoms when compared to the other’s processed approaches (Figures 4 and 5 and Table 2). However, assuming echo Doppler graph as benchmark (Figure 5), our findings indicated functional and
electrocardiogram analyses as reliable diagnosis approaches monitoring hypertensive patient’s symptoms (Figure 5). Further, the same tendency was supported by the multiple linear regression statistical model, which evaluated the relationship between echo Doppler and physical, functional and electrocardiogram analyses. Moreover, the equation “E1”
confirmed the concordance between echo Doppler and electrocardiogram approaches evaluating hypertensive patient’s symptoms (p-value=0.08) and excluded physical analyses as an accurate methodology assessing CVDs symptoms (p-value>0.05). Focusing exclusively our analysis on echo Doppler (heart echography) and combining both R biplot and variance principal component survey, we showed (i) hypertensive cardiomyopathy, (ii) insufficiency triggered by both aortic and mitral micro leakage and (iii) cardiomyopathy induced by the decreasing performance of heart myocardium (CDMP) and (iv) high blood pressure (HBP) as CVDs symptoms recurrently recorded in the present considered hypertensive populations (Figure 6 and Table 3). Furthermore, echocardiography by echo Doppler analyses displayed hypertensive cardiomyopathy as the most recurrent CVD symptoms (p-value<0.05) (Table 3 and Figure 6). Considering as a whole, this study exhibited echo Doppler echocardiography practice as an adequate analysis tool to assess CVD symptoms. However, the same analysis revealed some limits of the echo Doppler approach because of exhibiting a high variance value (high variability) in discerning CVD symptoms among considered hypertensive patients (Figure 3 and Table 2). then, conventional echocardiographic methods (echo Doppler), tissue Doppler imaging, three-dimensional echocardiography, and strain echocardiography (newer echocardiographic modalities) are fully encouraged in the evaluationof hypertensive patient’s health performance in current echocardiographic laboratories worldwide [24, 25]. Also, our findings revealed that an adequate analysis of the conventional echocardiographic (echo Doppler) as well as a right interpretation of functional and electrocardiogram (ECG) results evaluating CVD symptoms (Figure 5) in hypertensive patient populations can sturdy contribute to prevent cardiovascular risk.
5. Conclusions
and/or echo Doppler analyses as a reliable methodology discerning hypertensive patient symptoms. Further, this study revealed the high sensitivity of echo Doppler approach as well as the good propensity of electrocardiogram-ECG analyses in detecting hypertensive patient symptoms. To conclude, our findings proposed hypertensive cardiomyopathy, deficiency provoked by aortic and mitral micro leakage, cardiomyopathy induced by decreasing performance of the myocardial, high blood pressure (HBP) and abnormal relaxation of heart left ventricular (LV) as recurrent recorded CVD symptoms in the present handled hypertensive population.
Abbreviations
LVRA: Left Ventricular Relaxation Anomaly; IMML: Insufficiency provoked by Mitral Micro Leakage; HBP: High Blood Pressure; IMAL: Insufficiency provoked by Aortic Micro Leakage; CDMP: Cardiomyopathy triggered by Decreasing Performance of the Myocardium, LLE: Lower Limb Oedema; CVDs: Cardiovascular Diseases.
ACKNOWLEDGMENTS
The authors thank Mr. Coulibaly Drissa, Director of the General Hospital of Korhogo (GHK) and the Team of the Cardiology Department (CD) of the GHK structure for accepting to collaborate with our Research Unit (Unité de Formation et de Recherche des Sciences Biologiques UPGC University) as well as for providing data and assistance for the present study.
REFERENCES
[1] Staessen JA, Wang J, Bianchi G, Birkenhager WH. Essential hypertension (2003). Lancet; 361:1629-1641.
[2] Maatouk I, Wild B, Herzog W, Wesche D, Schellberg D, Schottker B, et al (2012). Longitudinal predictors of health-related quality of life in middle-aged and older adults with hypertension: results of a population-based study. J Hypertens.30:1364–72.
[3] Thomas R. Dawber, Gilcin F. Meadors, and Felix E. Moore, Jr (1950). Epidemiological Approaches to Heart Disease: The Framingham Study. American Journal of Public Health and the Nation’s Health. Vol.41, No. 3, pp. 279-286. doi: 10.2105/AJPH.41.3.279.
[4] Joan L. Pinsky, Alan M. Jete, Laurence G. Branch, William B. Kannel and Manning Feinleib (1990). The Framingham Disability Study: Relationship of Various Coronary Heart Disease Manifestations to Disability in Older Persons Living in the Community. American Journal of Public Health. Vol. 80 No. 11.
[5] Jae-Hwan Lee and Jae-Hyeong Park (2015). Role of echocardiography in clinical hypertension Clinical
Hypertension (2015) 21:9 DOI 10.1186/s40885-015-0015-8. [6] Leitman M, Lysyansky P, Sidenko S, Shir V, Peleg E,
Binenbaum M, et al (2004). Two-dimensional strain-a novel software for real-time quantitative echocardiographic assessment of myocardial function. J Am Soc Echocardiogr. 17:1021-9.
[7] R Core Team (2013). R: A language and environment for statistical computing. R Foundation for Statistical Computing, Vienna, Austria. ISBN 3-900051-07-0,
URL http://www.R-project.org.
[8] Noel Dougba Dago, Nafan Diarrassouba, Anatole Kanga N’guessan, Baba-Moussa Lamine (2016). Computational Statistics Assessing the Relationship between Different Rhizobacteria (P.fluorescens) Treatments in Cereal Cultivation. American Journal of Bioinformatics Research, 6 (1):1-13 DOI: 10.5923/j.bioinformatics.20160601.01. [9] Sandra Lach Arlinghaus (1994). PHB Practical Handbook of
Curve Fitting. CRC Press.
[10] William M. Kolb (1984). Curve Fitting for Programmable Calculators. Syntec, Incorporated.
[11] Halli, S.S. and K.V. Rao (1992). Advanced Techniques of Population Analysis. ISBN 0306439972 Page 165 (cf. ... functions are fulfilled if we have a good to moderate fit for the observed data).
[12] Halimah Badioze Zaman, Peter Robinson, Maria Petrou, Patrick Olivier and Heiko Schröder (2009). Visual Informatics Page 689.
[13] John R. Hauser (2009). Numerical Methods for Nonlinear Engineering Models Page 227.
[14] Dago Dougba Noel, Lallié Hermann Désiré N. M., Diarrassouba Nafan, Silué Souleymane and Giovanni Malerba (2015). Correlation between accuracy sensitivity specificity and positive predictive value in detecting differentially expressed genes. International Journal of Development Research Vol. 5, Issue, 03, pp. 3734-3739 Available online at http://www.journalijdr.com.
[15] Lê S., Josse J. and Husson F. (2008). Facto Mine R: An R Package for Multivariate Analysis. Journal of Statistical Software. 25(1). pp. 1-18. Available:
http://www.jstatsoft.org/v25/i01.
[16] Iqbal D and Ahmad N. (2016). Cardiovascular Diseases and its Treatment. SM J Pharmac Ther. 2 (1): 1009.
[17] Xu K, Kochanek KD, Murphy SL, Tejada-Vera B. Deaths: Final Data for 2007. National Vital Statistics Reports (2010). Vol 58. Hyattsville, MD: National Center for Health Statistics.
[18] Roehrig C, Miller G, Lake C, Bryant J. National health spending by medical condition, 1996---2005. Health Aff (Millwood) (2009). 28(2):w358---w367.
[19] Levy D, Garrison RJ, Savage DD, Kannel WB, Castelli WP. (1989). Left Ventricular Mass and Incidence of Coronary Heart Disease in an Elderly Cohort: The Framingham Heart Study. Ann Intern Med.110:101-107.
doi: 10.7326/0003-4819-110-2-101.
determined left ventricular mass in the Framingham heart study. N Engl J Med.322:1561–6.
[21] Cuspidi C, Ambrosioni E, Mancia G, Pessina AC, Trimarco B, Zanchetti A, et al. (2002). Role of echocardiography and carotid ultrasonography in stratifying risk in patients with essential hypertension: the assessment of prognostic risk observational survey. J Hypertens. 20:1307-14.
[22] Zwick WR and Velicer WF (1986). Comparison of five rules for determining the number of components to retain. Psychological Bulletin, 99, 432-442.
[23] Franklin SB, Gibson DJ, Robertson PA, Pohlmann JT and Fralish JS (1995). Parallel analysis: a method for determining
significant principal components. Journal of Vegetation Science, 6(1), 99-106.
[24] Takeuchi M, Nishikage T, Mor-Avi V, Sugeng L, Weinert L, Nakai H, et al (2008). Measurement of left ventricular mass by real-time three-dimensional echocardiography: validation against magnetic resonance and comparison with two-dimensional and m-mode measurements. J Am Soc Echocardiogr 21:1001-5.