This paper is based on the oral presentation at the 7 International Conference on Road and Airfield Pavement Technology, ICPT 2011, in Bangkok,
Article
Test Methods to Evaluate the Effect of Interface
Bond Conditions on Top-Down and Reflective
Cracking
Yu Chen
*
, George Lopp, and Reynaldo Roque
University of Florida, Civil & Coastal Engineering, Gainesville, Florida, USA E-mail: [email protected]*
Abstract. A composite specimen interface-cracking (CSIC) test was developed to evaluate the effect of the characteristics of the interface between asphalt layers on resistance to top-down and reflective cracking. The system involves repeated tensile loading and monitoring of the rate of damage development (reduction in stiffness) on composite specimens specifically designed for this purpose. Top-down cracking tests were performed on open-graded friction course (OGFC) mixtures placed on dense-open-graded mixtures using both a conventional tack coat and a polymer-modified asphalt emulsion (PMAE) at a higher application rate. Reflective cracking tests were performed on dense-graded mixtures. Results clearly indicated that use of polymer-modified bonding material significantly reduced the rate of damage development for both top-down and reflective cracking. The testing and interpretation methods developed can be used to optimize bonding materials and application rates for enhanced cracking performance. The methods may also provide a suitable specification test for bonded systems.
Keywords: Interface, bond, asphalt, cracking, fracture.
ENGINEERING JOURNAL Volume 16 Issue 4 Received 7 January 2012
Accepted 24 February 2012 Published 1 July 2012
1.
Background
OGFC has been widely used in the United States to improve road safety under wet conditions because of its much higher percentage of air voids, in the range of 15% to 25%, as compared with dense graded mixture [1]. However, most of the OGFC research work done so far has been function related and most pavement design guidelines consider the OGFC as a wearing surface layer with no structural value. For pavements with OGFC, it was recognized that the OGFC mixture may be the ‘first front’ in resisting top-down cracking. However, due to its inherently high air voids and accelerated aging caused by direct exposure to UV radiation and high surface temperatures, OGFC mixtures have been reported to have considerably lower values of fracture energy density and dissipated creep strain energy to failure than dense graded asphalt mixtures [2]. Analysis of findings from pavement field sections in Florida has clearly indicated that the quality of the OGFC and the characteristics of the interface between OGFC and the structural mixture affect top-down cracking performance. In addition, recent laboratory work at the University of Florida [3] suggests that cracks that develop either in the OGFC or the hot mix asphalt structural layer can be effectively arrested and/or deterred by improving the characteristics of the bonded interface between the OGFC and the underlying structural mixture. In addition, pavement stress analyses have clearly indicated that debonding at the interface between asphalt layers results in stresses that are conducive to surface cracking [4, 5, 6]. Therefore, a reliable testing system and data interpretation method are needed for evaluation of the effects of characteristics of the interface between asphalt layers on resistance to top-down and reflective cracking.
2.
Objectives
The objectives of this study are as follows:
Evaluate a new testing and data interpretation system developed to assess the effect of interface characteristics on pavement cracking performance.
Present specimen preparation, testing and data interpretation methods.
Evaluate the effect of interface bond conditions on top-down and reflective cracking.
3.
Scope
This study primarily focused on the presentation of newly developed testing, evaluation, and data interpretation method that allows for the characterisation of the effect of bonded interfaces on top-down and reflective cracking resistance. For top-down cracking, composite specimen interface cracking (CSIC) tests were performed on OGFC mixtures placed on dense graded mixture using both conventional tack coat and polymer-modified asphalt emulsion (PMAE). For reflective cracking, CSIC tests were performed on dense graded mixture placed on dense graded mixture using both conventional tack coat and PMAE. For both tests, one application rate was examined for each interface type, as this study was not meant to optimize application rate. All tests were conducted at one temperature (10°C), which has been determined in prior fracture research at the University of Florida to correlate well with cracking performance of pavements in the field.
4.
Test and Data Interpretation Methods
4.1. Overview
material layer(s), using easily obtained specimens, i.e. Superpave gyratory compacted specimens or cored field specimens.
4.2. Specimen Preparation and Test Method
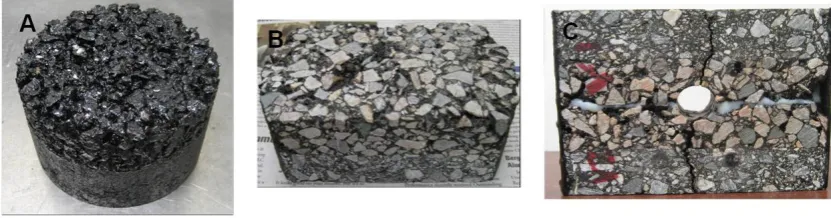
Test specimens can be prepared from either Superpave gyratory compacted specimens or cored field specimens. The laboratory preparation process involves compaction, cutting, gluing and grooving as shown in Fig. 1. The test specimen consisted of two separately prepared composite specimens bonded together at the pavement surface for top-down cracking and at the bottom of the structural layer for reflective cracking. The top-down cracking specimens were composed of a 25 mm thick OGFC mixture compacted on dense graded mixture; whereas the reflective cracking specimens were composed of a 19 mm dense graded structural layer on a dense graded overlay. For both specimen types, a 19.05 mm diameter stress concentrator is cored at the specimen center. The final specimen was trimmed to 38 mm depth from the original 150 mm diameter composite specimen. The specimen’s curved ends were reinforced with carbon fiber to eliminate a potential bending failure.
Fig. 1. Composite specimen preparation process.
The CSIC test was performed by applying a repeated haversine load for 0.1 second followed by a 0.9 second rest period by way of two split cylinder yokes inserted in the hole in the center of the specimen (see Fig. 2). The radius of the two yokes was 9.5 mm, matching the radius of the stress concentrator in order to ensure uniform contact and to properly distribute the load. A seating load of 44 N was applied to ensure the specimen always in tension and that contact was never lost between the yokes and specimen. Four extensometers, two on each side of the specimen, were centrally mounted on gage points attached to the specimens at a distance of 19.1 mm from the composite specimen symmetrical plane. A plan view sketch of a specimen depicting load and measurement system is shown in Fig. 2 (dimensions in parentheses correspond to reflective cracking specimens).
4.3. Data Collection and Interpretation Method
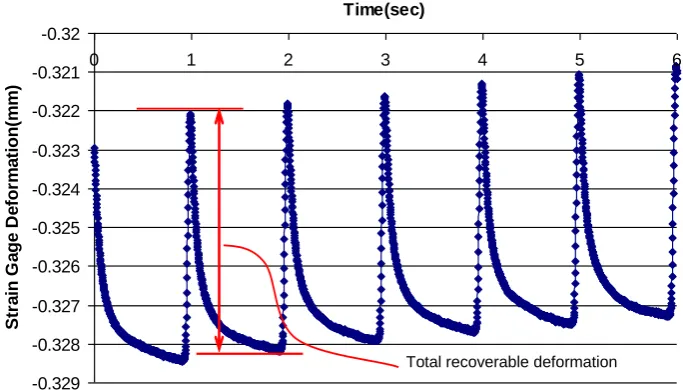
Extensometer data was acquired at a rate of 5 samples per second and plotted to allow the operator to observe for abrupt changes in deformation as an indication of local damage evolution. If a sudden change occurred, or whenever desired, the operator recorded a burst of data for 6 consecutive loading cycles at a rate of 500 data points per second, which allowed for calculation of the specimen’s total recoverable deformation (see Fig. 3).
[image:3.595.89.505.285.394.2]Stress Concentrator Dense
Graded
OGFC
Plane of Symmetry
(a) (b)
D=19.1
Strain Gage
19.1 Load
OGFC (Dense Graded)
Dense Graded
OGFC (Dense Graded)
Dense Graded
Crack
unit:mm
Fig. 2. (a) Specimen loading and measurement system and (b) cracking mechanism.
-0.329 -0.328 -0.327 -0.326 -0.325 -0.324 -0.323 -0.322 -0.321 -0.32
0 1 2 3 4 5 6
Time(sec)
Str
a
in
G
a
g
e
D
e
fo
rm
a
ti
o
n
(m
m
)
Total recoverable deformation
Fig. 3. Total recoverable deformation.
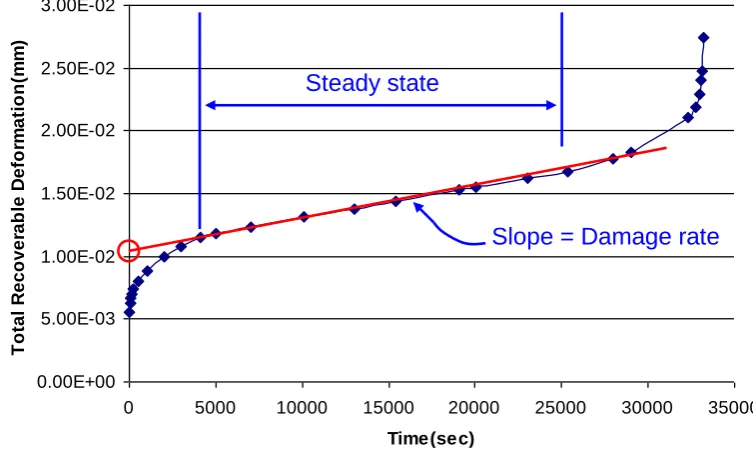
The total number of load cycles required to break the composite specimen was used as a straightforward cracking resistance comparison parameter for specimens with different interface conditions subjected to the same loading conditions. However, this parameter provided only the fracture resistance of the whole specimen without any information regarding the damage evolution in the specimen.
[image:4.595.86.519.82.215.2] [image:4.595.129.471.277.472.2]0.00E+00 5.00E-03 1.00E-02 1.50E-02 2.00E-02 2.50E-02 3.00E-02
0 5000 10000 15000 20000 25000 30000 35000
Time(sec)
T
o
ta
l
R
e
c
o
v
e
ra
b
le
D
e
fo
rm
a
ti
o
n
(m
m
)
Steady state
Slope = Damage rate
Fig. 4. Typical total recoverable deformation and damage rate.
5.
Test Results
5.1. Top-down Cracking
The composite specimens used for this evaluation were prepared with OGFC and dense graded mixture designs commonly used in Florida. A conventional tack coat and PMAE (Novabond) from Road Science, LLC, were applied on the dense-graded specimen surface at an application rate of 0.204 l/m2 and 1.358
l/m2, respectively. Based on finite element model (FEM) results and prior research experience with these
materials it was determined that a peak load of 2535 N was appropriate. Three replicate specimens were prepared and tested for both the conventional tack coat interface and the Novabond interface.
Figures 5 and 6, which show test results for top-down cracking specimens in terms of number of cycles to failure and damage rate, clearly indicate that specimens with the Novabond interface outperformed the specimens with conventional tack coat in terms of cracking resistance. It appears that the relatively thick nature of the PMAE at the interface, along with the higher strain tolerance and excellent bond characteristics of the PMAE, results in an interface that can more effectively dissipate tensile stresses and provide greater resistance to damage. It is well known that the PMAE migrates upward into the high air void content OGFC, thereby filling voids in the aggregate and creating an interface of high cohesion. The CSIC successfully distinguished the expected difference in cracking resistance between these two interfaces.
5.2. Reflective Cracking
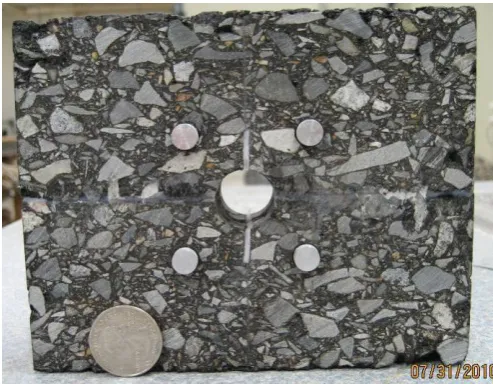
Three replicate specimens for each of the two types of interfaces, 0.453 l/m2 diluted conventional tack coat
and 0.905 l/m2 Novabond, were prepared by Road Science, LLC for reflective cracking tests. The
completed specimen, which involved the introduction of a Teflon spacer to represent an existing crack, which more effectively concentrated stress at the interface, is shown in Fig. 7.
[image:5.595.103.480.91.319.2]Test1
Test1 Test2
Test2 Test3
Test3 Average
Average
0 10000 20000 30000 40000 50000 60000 70000
Novabond Conventional Tack
N
o
.
o
f
C
y
c
le
s
to
F
a
il
u
re
Fig. 5. Total number of cycles to failure for Novabond and conventional tack.
Test1
Test1
Test2
Test2
Test3
Test3
Average
Average
0.00E+00 5.00E-08 1.00E-07 1.50E-07 2.00E-07 2.50E-07 3.00E-07 3.50E-07 4.00E-07
Novabond Conventional Tack
D
a
m
a
ge
R
a
te
Fig. 6. Damage rates of Novabond and conventional tack.
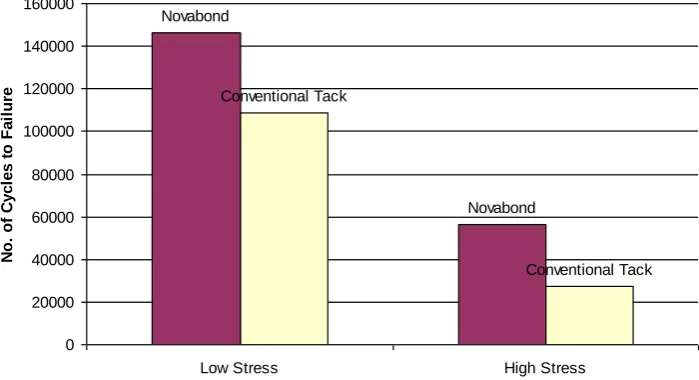
[image:6.595.143.481.85.267.2] [image:6.595.155.465.318.489.2] [image:6.595.188.435.538.730.2]Novabond
Novabond
Conventional Tack Conventional Tack
0 20000 40000 60000 80000 100000 120000 140000 160000
Low Stress High Stress
N
o.
of
C
y
c
le
s
t
o
Fa
il
ure
Fig. 8. Total number of cycles to failure for Novabond and diluted conventional tack.
Novabond
Novabond
Conventional Tack
Conventional Tack
0.00E+00 5.00E-08 1.00E-07 1.50E-07 2.00E-07 2.50E-07 3.00E-07
Low Stress High Stress
D
a
m
a
ge
R
a
te
Fig. 9. Damage rates of Novabond and diluted conventional tack.
It appears that the Novabond PMAE was able to effectively dissipate tensile stresses even between two dense-graded mixtures. It should be noted that this benefit was observed in laboratory prepared specimens, for which it is possible for some of the PMAE to squeeze out from the interface during compaction (as compared to the field, where the PMAE has nowhere to go).
6.
Conclusion
In this study, it was shown that the newly developed CSIC test successfully distinguished effects of pavement layer interface characteristics on both top-down and reflective cracking performance. The following conclusions can be drawn from this study:
This newly introduced test method can serve as tool for evaluating the cracking performance of interface materials on pavements.
The total number of cycles to failure, and damage rate are two effective measurements of cracking performance for composite specimens with different interface conditions.
[image:7.595.123.473.83.273.2] [image:7.595.121.465.325.511.2]References
[1] P. S. Kandhal and R. B. Mallick, “Open graded friction course: state of the practice,” National Center for Asphalt Technology, Auburn, AL, NCAT Report 98-7, 1998.
[2] C. Koh, “Tensile properties of open graded friction course (OFGC) mixture to evaluate top-down cracking performance,” Ph.D. dissertation, University of Florida, Gainesville, FL, 2009.
[3] B. Birgisson, R. Roque, A. Varadhan, T. Thai, and L. Jaiswal, “Evaluation of thick open graded and bonded friction courses for Florida,” Florida Department of Transportation, University of Florida, Gainesville, FL, Final Rep., 2006.
[4] M. Y. Shahin, K. Kirchner, E. W. Blackmon, and H. Tomita, “Effect of layer slippage on performance of asphalt-concrete pavements,” Transportation Research Record, no. 1095, pp. 79-85, 1986.
[5] M. Ameri-Gaznon and D. Little, “Octahedral shear stress analyses on an ACP overlay on a rigid base,” in Proceedings of the Association of Asphalt Paving Technologists, 1990, vol. 59, pp. 443-479.
[6] S. Gomba, J. Liddle, and Y. A. Mehta, “Evaluation of interlayer bonding in hot mix asphalt pavements,” The International Journal of Pavements, vol. 4, no. 1 and 2, pp. 13-24, 2005.
[7] C. Raab, M. N. Partl, and A. E. H. O. A. El Halim, “Evaluation of interlayer shear bond devices for asphalt pavements,” Baltic J Road Bridge Eng, vol. 4, no. 4, 176–195, 2009.
[8] M. T. Mukhta, and B. J. Dempsey, “Interlayer stress absorbing composite (ISAC) for mitigating reflection cracking in asphalt concrete overlays,” Illinois Cooperative Highway Research Program, Final Report Project IHR-533, 1996.
[9] K. W. Kim, Y. S. Doh, and S. Lim, “Mode I reflection cracking resistance of strengthened asphalt concretes,” Construction and Building Materials, vol. 13, no. 5, pp. 243−251, 1999.
[10] S. F. Brown, N. H. Thom, and P. J. Sanders, “A study of grid reinforced asphalt to combat reflection cracking,” in Proceedings ofthe Association of Asphalt Paving Technologists, 2001, vol. 70, pp. 543–571. [11] F. Zhou and T. Scullion, “Overlay tester: A rapid performance related crack resistance test,” Texas
Transportation Institute, Report No. FHWA/TX-05/0-4467-2, 2004.
[12] A. Khodaii, S. Fallah, and F. M. Nejad, “Effects of geosynthetics on reduction of reflection cracking in asphalt overlays,” Geotextiles and Geomembranes, vol. 27, pp. 1-8, 2009.
[13] R. Roque, W. G. Buttlar, B. E. Ruth, M. Tia, S. W. Dickison, and B. Reid, “Evaluation of SHRP indirect tension tester to mitigate cracking in asphalt pavements and overlays,” Florida Department of Transportation, Tallahassee, Final Rep., Aug. 1997.
[14] P. Bolzan and G. Huber, “Direct tension experiments,” National Research Council, Washington, DC, Strategic Highway Research Program-A-64 1, 1993.