City, University of London Institutional Repository
Citation
:
Tanda, G. (1996). Application of optical methods to the study of convective heat transfer in rib-roughened channels. (Unpublished Doctoral thesis, The City University of London)This is the accepted version of the paper.
This version of the publication may differ from the final published
version.
Permanent repository link:
http://openaccess.city.ac.uk/19300/Link to published version
:
Copyright and reuse:
City Research Online aims to make research
outputs of City, University of London available to a wider audience.
Copyright and Moral Rights remain with the author(s) and/or copyright
holders. URLs from City Research Online may be freely distributed and
linked to.
City Research Online: http://openaccess.city.ac.uk/ [email protected]
I.O O'I
'°
-..J\.0
(J)
I.O I.O
'-
---4\
/ //
-
--
--
-
---
----
... --/3
... __.,.
... /
'
-
4
_.,.
-
---
-
--/ /
--
----FIGURE 3.29 Contours of lines at equal Nu number, Re=20000.
AIR
FLO\./
~
- - -
·--
--
-
--1, (Nu=) 79; 2,99; 3,113; 4,123; 5,136; 6,147; 7,160; 8,175; 9,185; 10,209.
'-4)
r t
'-
--/--
-
---
-
-
-
- - - 3 ~
--- -- -4
AIR RO\./
~
-
-
-
----
--
-
,_.
0 0
..._
---
-AIR FLOW
.,-
~
---
.,.. - - - - 4 _____ _-
- -
---
--- - 7
~~
( [ _______ ~ 8'
.-/
5 ~
r.:7
~ - - - - ~ r
c:=::::
3- ,... 2
-,
_,I .,,t -4 --..IAI
,,.
__,,...---FIGURE 3.31 Contours of lines at equal Nu number, Re=6000.
1, (Nu=) 40; 2,44; 3,49; 4,56; 5,62; 6,74; 7,91; 8,100 .
AIR FLOW
,.,--
~
--
·
-
--
-
--
-
--
..,._
--- 2 ,.,--
---
-
_.,-
----
-
__,.,.,3
\
/
'4
---/
3) (
,,,,.-2
'- "-4 . -3
' r--...
\
,,,,....-1-
I
C
I--:'_//_ ----
2
-
-- -- 3
-I - - - -
,,--1-JB7(==--2_--
--
-.. )L
FIGURE 3.32 Contours of lines at equal Nu number, Re=3500.
1, (Nu=) 38; 2,49; 3,57; 4,63; 5,71; 6,79.
C
5',
-.
'\hi
g1 1f 1ed:
c1 1b
1aI I I I I I I 1 ait
, Y+
II
W
:
~
r----1
+-flowh+J
rr:JE7..._ _
_.__~1~I OI._ _ _ . _ I _ __.IC1,__ _ _ _
___..I B l._ _ _ _ _~IAL
4 4
Y/e
y/e
'
3 3
,,
. ''
-~,
'-'
2 2
'
'a\ ' ' - - - J b
--,
e--1
---
---
/ 1/
0 0
100 150
Nu
200 100 150Nu
2004 4
y/
e
y/e
3 3 ...
"
-...
' ,
\
....'
...
2 2 a-1_ ....
I
1
---
-
-
1--0 0
1.0 1.4 1.8
N
2.2 1.0 1.4 1.8 2.2N
2.6hi
1t 1ed:
c1 1b
1aI I I I I I I air
Xj
ll]El._ _ __._: _ ____,~~
1
- ~ - ~ ~ - - ' - - - ~ ~ L . . - - - ~ 1 0
~
4 4
Y/e
y/e
\\
3 3 \
·,
).
2 2
'\,
a\,,
e . , __ ,b
--1 / 1
h>./ /, d
0 0
50
Nu
100 50Nu
1004 4
y/e
y/e
'
~ \
3 3
"-' ~
\
" -
.
1'.'
2 2
a>-. ,
.'
'\
\',
... __ -(be
-1 1
0 0
1.0
N
2.0 1.0N
2.0FIGURE 3.34 Nu and N profiles along y-coordinate at several axial x-locations, Re=6000.
-(a)
(b) (c) (d)
(e)
(f)
(g) (h)
(i)
(j)
+-flow
FIGURE 3.35 (a-i) LC true-colour images for nine experiments at fixed Re and different water temperature; (j) false-colour image indicating the iso-Nusselt lines. Re=20000.
(a) (b)
(c) (d)
(e)
(f)
(g)
(h)
(i)
( j)
~
flow
FIGURE 3.36 (a-i) LC true-colour images for nine experiments at fixed Re and different water temperature; (j) false-colour image indicating the
150
Hu
100
50
100
Hu
50
El.__ _ _ _
~rn.__ ___ ~m~--~m.__ ___
~w~----\
Re:10'
.
----\---~----~---Tl.__ _ _ _
~IDl'---'m'---~m.__ ___
~[Al~-AIR
\
FLOJ
-
-
-FIGURE 3.37 Local Nu number distributions along the test plate (continuous line: ribbed config. R2, dashed line: flat plate) for Re=20000 (top) and Re=lOOOO (bottom).
data from
literature
f
-flow
2 1_<---_n
'i./€
3
O9.2
LC - - -
-(present
---
......
'
:·,
'
. ----=:,....---~
'
'
: ..,
r
--
--~,--~.
---
...
\ ' t ... '--"'" \ · ...
}.__/'·
....
-··
·
-~-
':
··'\,
...
~-
~
-
0d··--~
r
r
•
I.
rI
.
(
~
'\
:
,'.~
i!
L.__ _ __L_ _ _ _ ...,L_ _ _ _ _,__ _ _ · · - ~ -- - - : ' _
0
0
9.2
Y./e
FIGURE 3.38 Normalised Nusselt number distributions. Comparison among present results and data from the literature, ribbed configuration R2
-~
t
lo,12 -I
7.__ _ _
<_n
9.2.
x/e
3 O-240
Nu
160
liquid crystals
/ (present results)
'
'j--',,
interferometry ',
'
(Lockett, Collir:is, 1990) ' , ,
8 7
6
51-/e
4'
'
3 2
80
0
FIGURE 3. 39 Nusselt number distributions. Comparison between present
results and data from Lockett and Collins,1990. Re~ 20000, ribbed config.R2
+ - flow
P / e = 5 , Re = 1 O 6
(a)
P / e
=
1 2 , Re=
1 • 5 · 1 O 6 _ flow200
(b)
~/,l
~~
~ 1 1 / J ~ ~ ~ ~ 1 : 0
P/e = 7. 2, Re = 2 · 1 0 4
le)
~
\_J
1/'A
I~,___
_ __,~
flow
FIGURE 3.40 Local heat transfer coefficient distributions. (a-b) data
4. EXPERIMENTS BY THE SCHLIEREN METHOD IN RIB-ROUGHENED CHANNELS
The schlieren method has been employed here to investigate free
convection heat transfer in vertical rib-roughened channels. As in the
forced convection experiments, additional tests have also been performed
for the corresponding smooth channel, in order to compare the heat transfer
behaviour with and without the ribs.
4.1 The apparatus
The experimental apparatus includes: (a) the test section, (b) the
instrumentation for measuring temperature, electrical power and pressure,
(c) the optical system, (d) the image processing system.
The test section was entirely designed by the author of this project,
as well as the procedure for obtaining heat transfer coefficients and
temperature distributions from schlieren images (Tanda 1992a, 1992b, 1993a,
1993b, Tanda 1995). Whereas in previous schlieren experiments conducted by
the author the index-of-refraction gradients were recorded only along one
direction, here the apparatus was modified in order to detect n gradients
along two directions, owing to the characteristic shape of the ribbed
walls. In addition, an image processing system including "self-made"
dedicated software has been employed to reconstruct the thermal field from
schlieren images.
4.1.1. The test section
The test section is schematically shown in Fig. 4. 1. Two aluminium
ribbed walls, with three plane electrical resistances sandwiched between
them, are faced by two insulated walls to form two symmetrical vertical
channels. Each ribbed wall was fabricated from a solid block of aluminium
and therefore the ribs were integral to the baseplate, without thermal
contact resistance between them. The two insulated walls were made of
perspex (thickness 4 mm) with an insulation layer on the rear and a plastic
reflective sheet on the face opposite to aluminium walls, to reduce radiant
heat transfer from the heated walls.
Owing to the symmetry of the geometrical configuration, the heat power
dissipated by the Joule effect into the aluminium plates was expected to be
transferred equally to the air flowing in the two channels. The main
reasons for choosing a symmetrical configuration are (a) to evaluate the
total power dissipated into the fluid by electric measurement with great
accuracy and (b) to provide an effective check of schlieren local heat
transfer measurement, where the integral of local heat transfer must be
equal to the overall power dissipated.
An additional plate assembly was arranged by using two flat aluminium
sheets (without ribs). Three plane resistors were fitted inside them, as in
the previous case. Experiments in the presence of the plane heated walls
(in lieu of the ribbed heated walls) were carried out for the following
reasons:
(i) free convection inside a channel with one heated wall and one adiabatic
wall has been extensively studied in the past and a considerable quantity
of experimental or numerical results are available from the literature for
a comparison with the schlieren experiments;
(ii) the tests on smooth channels enable a comparison to be made between
ribbed and unribbed channels.
Unlike the forced convection experiments, no wind tunnel was required
to convey the air flow to the test section, as the buoyancy forces are
responsible for driving the fluid within the channels. However, the
channels were confined on four sides by glass walls having open grids at
the bottom (see Fig.4.2). Runs conducted without the side walls revealed
negligible effects on heat transfer performance, but their presence was
deemed necessary to minimise extraneous air-current effects that might
disturb the optical measurements.
4.1.2 The instrumentation
The experiments were carried out in a large isolated room with all
instrumentation (scanning thermometer, barometer, voltmeters, and ammeters)
as well as the power supply system set far away from the test section.
Both the aluminium plate assembly and its surroundings, comprising the
adiabatic plates and ambient air, were instrumented with fine-gauge,
chromel-alumel thermocouples, calibrated to ±0.1 K. Up to 30 thermocouples
were embedded in the wall of each plate at different locations through
0.5-mm-dia holes drilled into the rear surfaces of the two coupled
aluminium plates, as shown in Figs.4.3 and 4.4. Care was taken to drill the
holes as close to the exposed surfaces as possible. The adiabatic walls
were instrumented by three thermocouples, placed at different elevations
between the plastic cover and the perspex through small holes drilled in
shielded thermocouples situated just below the channels (Fig. 4. 3). All
thermocouple signals were read by a Keithley multi-channel digital
thermometer, with automatic compensation to yield temperatures in °C
directly.
The power input was dissipated into the aluminium plates by delivering
to the resistors known amounts of electrical currents from three separate
DC power supplies, accurately controlled by independent voltage and current
measurements. The power supplied to the plate assembly was transferred to
the surroundings mainly by natural convection. Since the thermal resistance
of the plate material was very small, owing to the high thermal
conductivity of aluminium, the heated plate assembly was expected to be
virtually isothermal. Owing to the low thermal resistance of the material,
the three independent heaters required the same electrical current to
provide surface-temperature uniformity. This was checked by the
thermocouples embedded in the wall. The maximum variations in temperature
over the heated plate assembly turned out to be about 2 percent of the mean
plate-to-ambient temperature difference. Hence, the plate (whether ribbed
or flat) assembly was assumed to attain a uniform temperature, the value of
which depended on the characteristics of the buoyancy-induced flow and on
the amount of heating power transferred to the surroundings.
As previously noted, all of the heating power supplied to the
aluminium plate assembly was dissipated at its exposed surfaces mainly by
natural convection. The radiant contribution was expected to be small owing
to the low emittance of aluminium and the high reflectance of the opposite
walls. In fact, the radiation heat transfer was estimated to be less than
10-15 percent of the total power input by using the net-radiation method
for enclosures of diffuse-gray surfaces. It has been subtracted from the total heat transfer (given by the overall electrical power supplied to the
heaters), thereby yielding the overall natural convection heat transfer
rate.
4.1.3 The optical system
A schlieren optical system was employed to reconstruct the thermal
field and to perform measurements of local heat transfer coefficients. The
schlieren system is schematically shown in Fig. 4. 5 (a). A non-coherent
light beam from a vertical slit source, collimated by the concave mirror M
1
(38 cm. diameter) passes through the test section. A second concave mirror M (38 cm. diameter) is then used to form a real image of the slit source
2
in the focal plane and a real image of the test section onto a screen or
camera. Owing to the inhomogeneities of the fluid refractive index around
the plates, the light rays undergo angular deflections. Regions of the
optical field that have the same light deflection can be identified by
shifting an opaque vertical filament in the focal plane of mirror M, as 2 shown in Fig.4.5 (b). When a disturbed light ray is stopped by the focal
filament, the image of the corresponding region of fluid will appear dark
on the screen, while the remaining field will be bright. The deviation of a
disturbed ray in the focal plane of mirror M can be recorded by measuring
2
the distance between the middle of the undisturbed image of the slit source
and the centreline of the filament, i.e. the distance between the filament
positions 1 and 2 displayed in Fig.4.5 (b). If the thermal field is assumed
to be two-dimensional (i.e. temperature is independent of z-coordinate) the
shift d of each light ray (due to the deflection in the y-z plane) can be
y
related to the local temperature gradient by the relationship:
d y
2
= Q• ( 8T/8y )IT (4. 1)
where T=T(x,y) is the absolute temperature, y is the direction in which the
light deflection is recorded and Q is a constant depending on the fluid, the pressure, the plate length and geometric parameters of the optical
2
components. In the present experiment, Q was equal to -0. 0456 m K. The
temperature reconstruction procedure is based on a set of photographs (for
each experimental run) obtained with the focal filament placed at different
distances d from the undisturbed slit-source image. A typical example of a
y
photograph taken by the schlieren apparatus is reported in Fig. 4. 6. By
identifying for each photograph the coordinates of the centreline of the
filament shadow, it is possible to obtain the profile of lines of constant
light-deviation values d and thus, taking into account Eq. (4.1),
y
reconstruct the temperature distribution in the entire optical field. The
knowledge of lines at equal d in the optical field is sufficient to
y
reconstruct the distribution of the function T(x,y). Despite this, it could
be useful, especially for evaluating the heat transfer coefficients around
the ribs, to record the pattern of lines at equal d, i.e. the locus of
X
points giving rise to the same light deflection along the x-direction, in
the plane x-z. This was made possible by mounting the slit source as well
as the focal filament onto supports able to rotate by an angle of up to 90
gradients along x to be derived according to the relationship:
X
2
= Q• (BT/Bx)IT (4.2)
An alternative series of schlieren images have been recorded by using
the colour-image system. This method implies the use of a coloured filter
(thin transparent coloured strips) placed in the focal plane of the
schlieren head (mirror M) in lieu of the focal filament. No displacement
2
of the filter is required. The strips have to be used with a slit source,
which must be in the vertical position if horizontal temperature gradients
are to be detected. Temperature inhomogeneities in the test section cause
the deflected rays to pass through different coloured strips of the filter. Therefore, the image of all the points which deflect the light beam through
the same angle has the same colour. This method has the advantage of
enabling a whole-field image of the phenomenon to be obtained without the
need of superimposing a number of images, as occurs with the focal filament
method. Unfortunately, the measurement range is limited by the small number
of coloured strips that can be mounted on the same filter (usually less
than 10, for the present experiment). Therefore, the images obtained by the
colour method have been presented only for qualitative purposes, for
instance for the comparison between the smooth channel case and the rough
channel case. The filter used for the colour schlieren images is sketched
in Fig.4.7. Under working conditions, the image of the slit source has
been collimated on the central strip (light blue) in order to assign this
conventional colour to the regions of the test section characterised by
negligible light deviation. This condition means the regions are at the
same temperature as the ambient air. Adjacent colours, from the centre to
the end side of the filter, correspond to progressively increasing light
angular deflections, that is, thermal gradients in the test section. The
colour pattern is symmetrical owing to the symmetry of the test sections
employed.
The working principles of the colour method are concisely demonstrated
in Fig. 4. 8. Five light rays pass through the test section at different
y-coordinates 0-1-2-3-4 (Fig. 4.8 a); owing to the temperature gradients in
the test region they are deflected by different amounts (Fig. 4.8 b) and
impinge against the coloured filter (held at the focus of mirror M ) at
2
different positions 0-1-2-3-4 (Fig.4.8 c). Therefore, the image of the test
section (projected onto the camera) is artificially coloured (Fig.4.8 d).
The light deviation associated with each colour is proportional to the
distance between the centreline of the coloured strip and the centreline of
the central (reference) strip, measured on the filter.
4.1.4 The data processing system
The local heat transfer coefficient can be directly obtained from
schlieren images without having to reconstruct the whole thermal field.
Indeed, if the focal filament is moved until its shadow intersects the
surface profile (in the image projected on the camera), the displacement of
the filament corresponds to the deviation~ of the light ray passing in
w
the vicinity of the surface at the desired location. The relation between
light deviation~ and the local heat transfer coefficient is derived in
w
Appendix A2. While performing the local measurement of~ at the surface,
w
the slit-source and focal filament must be aligned to the surface profile.
This alignment must be in the vertical or the horizontal direction when
heat transfer coefficients along either vertical or horizontal surfaces
have to be measured.
The local heat transfer coefficient then may be estimated by direct
measurement and without the need to process the image. This facility makes
the method very powerful. On the other hand, since the function T(x,y) can
not be explicitly obtained from Eq. 4. 1, the temperature reconstruction
requires the processing of a series of images recorded, for a given
experiment,with the focal filament in different positions. From the
superposition of these images, the pattern of lines at equal light
deviation is obtained and then, using Eqs. (4.1) and (4.2), the thermal
field is reconstructed. The required steps for data processing, as well as
the mathematical treatment of optical data, are explained in Appendix A2.
4.2 The geometry
As stated in Paragraph 4.1.1, two different test sections were
considered. Firstly, free convection from smooth vertical channels having
one wall heated (at uniform surface temperature) and the opposite wall
thermally insulated has been considered. This configuration is depicted in
Fig. 4. 9: the input power dissipated into the heaters is symmetrically
transferred to the upward moving fluid. The dimensions of the heated plate
assembly were: overall thickness t=12 mm, height H=17.5 cm, and length L=30
order to favour a two-dimensional thermal field in the channels.
The main body of experiments involved the use of rib-roughened
vertical channels having the rough wall heated (at uniform surface
temperature) and the opposite (smooth) wall thermally insulated (Fig.4.10).
Again, the symmetry of the configuration led to an equal subdivision of the
power input to the adjacent channels. The rough plate assembly has the
following dimensions: overall thickness t=12 mm, height H=l 7. 5 cm, and
length L=30 cm. The wall sides exposed to the ambient air were roughened by
square ribs having the height e equal to 4. 85 mm and a pitch-to-height
ratio P/e=7.2. This geometry was as in forced convection experiments, and
resulted in each wall side containing 5 ribs identically sized and spaced.
For both smooth and rough wall configurations, different values of the channel spacing S were chosen in the course of the experiments. Conversely,
the wall-to-fluid temperature difference was kept constant and equal to
about 45 K, in order to perform all the experiments at the same Rayleigh
number (based on the overall height Hof the channel).
4.3 Operating procedure
Experimental runs were performed according to the following procedure:
i) arrangement of the channel aspect ratio, by setting the value of the
interplate spacing S equal on both sides. For this purpose, calibrated
spacers were used;
ii) heating of the aluminium plates by given amounts of electrical power
into the heaters in order to attain, for steady state conditions, a
temperature surface uniformity;
iii) in the steady state, measurements of wall and ambient air temperatures
and reconstruction of the thermal field from a set of schlieren photographs
(from 10 to 20 for each run);
iv) optical measurement of the light deflections near the vertical and
horizontal walls in order to obtain the local heat transfer coefficients at
several locations.
4.4 Results and discussion
Each experiment was performed by adjusting the input power in order to
attain a prescribed temperature difference between the heated walls and the
ambient air. Therefore, a significant input parameter is expressed by the
Rayleigh number, based on the wall-to-fluid temperature difference and
introduced in Appendix A2. Since the geometric .dimensions of the channels
were not fixed, additional input parameters are given by the aspect ratio
(spacing-to-height ratio) of the channel and by the rib-height to
channel-spacing ratio. The rib pitch-to-height ratio was held fixed and
equal to 7.2. The measured quantities are expressed in terms of a
convenient dimensionless temperature and of the Nusselt number, as
explained in Appendix A2. The dimensionless temperature is particularly
suitable to present the temperature profiles of the fluid in the channel
while the Nusselt number, obtained on a local basis from schlieren
visualisations and on an overall basis from the energy balance, is related
to the efficiency of heat transfer from the wall to the fluid.
Temperature and heat transfer results will be presented in the
following sequence:
a) smooth channel configuration;
b) rib-roughened channel configuration.
For both cases comparisons of experimental results with data reported
in the literature will be also presented and discussed.
4.4.1 The smooth channel
A first set of experiments was conducted for vertical channels formed
by flat plates (Fig.4.9). The aspect ratio S/H was varied over the range
0. 05-0. 4. In all cases the wall-to-fluid temperature difference was held
7
constant and equal to 45 K, giving a Rayleigh number Ra equal to 1.8·10.
Preliminary tests showed that the degree of uniformity in surface
temperature attained by the heated plate assembly, recorded by 13
thermocouples deployed in different positions, was satisfactory. In fact,
for the ambient air temperature of 20 °C, the surface temperature in the
measured location deviated by ±1 K at most from the mean value (65°C). That
is, a maximum surface temperature nonuniformity, relative to the mean
wall-to-fluid temperature difference, of ± 2% was recorded. Several
repeated tests showed a repeatability in local heat transfer coefficients
within ±3.5 % and in overall heat transfer coefficients within ±1% (heat
balance) and ±2.5% (schlieren visualisation).
Schlieren images obtained by the colour method are presented in Figs.
filter mounted vertically, in order to visualise, with different colours,
regions of fluid in the channel characterised by non-negligible temperature
gradients in the horizontal direction. Five values of the aspect ratio have
been considered, namely S/H=0.4 (Fig. 4.11 a), 0.3 (Fig.4.11 b), 0.2
(Fig.4.12 a), 0.1 (Fig.4.12 b), and 0.05 (Fig.4.12 c). Images were recorded
under steady state conditions, for the Rayleigh number Ra=l.8·107. For
these conditions, no disturbances in the colour contours were noticed. This
means that the flow was laminar in all cases. As is apparent from the
figures, the colour pattern is symmetrical, owing to the symmetry of the
geometry (two adjacent channels heated on one side and adiabatic on the
opposite side) and of the filter (illustrated in Fig.4.7). When the aspect
ratio is high (S/H=0.4, Fig.4.lla), a large part of the fluid flowing in
the channels appears light blue, which is the colour associated with zero
or negligible thermal gradients. This situation is typical of the single,
vertical, heated plate, since the opposite adiabatic plate does not seem to
affect the thermal field. The progression in colours from outside the
thermal boundary layer to the heated wall indicates strong temperature
gradients at the leading edge of the heated plate, where the heat transfer
is more effective. Despite the low thermal emittance of the heated walls,
a small heat exchange by radiation between opposite walls occurs. This
radiant heat flow is responsible for a slight increase, relative to
ambient, of surface temperature on the unheated side of the channels. This
fact is confirmed by the thin "yellow" portion of fluid close to the
unheated walls opposite to the heated plate assembly as well as by local
surface temperature measurements.
As the aspect ratio is reduced, the unheated wall gradually begins to
influence the heat transfer mechanism from the heated plate to the fluid.
At the minimum interplate distance (S/H=0.05, Fig.4.12 c), the thickness of
the boundary layer, growing from the leading to the trailing edge of the
heated plate, rapidly reaches the opposite plate, whose surface temperature
dramatically increases. Despite the thermal insulation, a small amount of
heat is transferred across the unheated plates and is convected to the
ambient air at the opposite face.
Figure 4. 13 shows images recorded with the colour filter mounted
horizontally. For such conditions, the colours refer to the regions of
fluid in the channel with non-negligible temperature gradients in the
vertical direction. Schlieren images are displayed only for two S/H values:
0.3 (Fig.4.13 a) and 0.05 (Fig.4.13 b). As expected, non-zero vertical
gradients in temperature occur only in the vicinity of the leading and
trailing edges of the heated plate. They are due to the presence of the
horizontal boundaries of the heated plate and to conductive effects in the
fluid close to the inlet of the channel. The "yellow" region appears to be
wider in the narrower channel.
The reconstruction of the fluid temperature profiles required, for
each test, a set of schlieren photographs obtained by the focal filament
method. For instance, images obtained for S/H=0.3 and Ra=l.8·107 are
reported in Fig.4.14, for various positions of the focal filament,
displaced vertically and progressively moved from ~ =O mm (reference
y
position) to~ =4.9 mm. From the schlieren images, the centrelines of the
y
filament shadows (lines at equal deviation of light) were extracted. The
contours of lines deflecting the light by the same amount are reported in
Figs.4.15 and 4.16 for Ra=l.8·107. The aspect ratio values are S/H=0.4
(Fig. 4.15 a), 0.3 (Fig. 4.15 b), 0.2 (Fig. 4.16 a), 0.1 (Fig. 4.16 b), and
0. 05 (Fig. 4.16 c). Owing to the symmetric configuration of the test
section, results are reported only for one of the two identical adjacent
channels. The processing of the iso-deflection lines enabled the fluid
temperature distribution to be obtained for each experiment. The profiles
of the dimensionless temperature 8 as a function of the normalised
coordinates y/S and x/H are reported in Fig.4.17, for the whole range of
S/H values explored. When the S/H value is high (0.4), the temperature of
the fluid approaches the external air temperature at relatively small
distances from the heated wall. At the lowest S/H value (0.05), large
increases in fluid temperature are shown. The heating condition imposed at
the right surface clearly affects the temperature values at the opposite
left surface. Here 8 exceeds 0.4 close to the exit of the channel.
In Fig. 4. 18 temperature data are recast according to a different
format of presentation: 8 is expressed as a function of a dimensionless
1/4 3 2
variable 11=(y/x) (Ra ) , where Ra =[3gx (T -T . )Pr/v is the Rayleigh
x x w air
number based on the local elevation x. The continuous line represents the
theoretical solution obtained by Ostrach (1953) for free convection from a
vertical, single, isothermal plate. It appears from the figure that the
majority of experimental temperature data for S/H between 0.1 and 0.4 are
in good agreement with Ostrach's results: this demonstrates the negligible
of the aspect ratio. It should be noted that points obtained close to the
leading edge (symbols with the downward leg) do not agree too well with the
theory. In fact, the boundary layer assumption made in the theoretical
development implies that the distance along the plate is large when
compared with the boundary layer thickness. This assumption is obviously
invalid near the leading edge. For the lowest aspect ratio (S/H = 0.05),
the departure of experimental data from the single plate solution is
evident: here, the thermal interaction between the facing plates is marked.
For the lowest aspect ratios, experimental temperature results can be
compared with those predicted by numerical simulations obtained for natural
convection in asymmetrical heated channels. A numerical study of this
problem has been conducted by the present author some years ago (Tanda,
1987 and 1988). The two-dimensional field equations for laminar,
incompressible, boundary layer flow were discretised by finite-difference
equations and solved by the "marching procedure" method. Such a procedure
requires that the pressure, the temperature and the velocity fields be
given as input data at the channel inlet section. Since the inlet velocity
is unknown in a free convection problem, it is treated as a computational
parameter. That is, a value of the inlet velocity is given and the
computation, beginning at the inlet section, proceeds upward until the
pressure becomes equal to the ambient pressure. At the corresponding
elevation the computation is terminated and the channel exit section is
found a posteriori. Figure 4.19 presents the comparison of experimental
results with those predicted numerically for S/H=0.1 (a) and S/H=0.05 (b).
The corresponding modified Rayleigh numbers are 1800 and 160, respectively.
It should be noted that for larger S/H values and a wall-to-fluid
temperature difference of 45 K, the modified Rayleigh number exceeds the
critical value (about 2000) for which flow reversals, situated adjacent to
the unheated wall in the upper part of the channel, occur (Sparrow et al.,
1984). For these conditions, the parabolic numerical scheme adopted is not
compatible with the presence of recirculating flow and therefore numerical
results were not obtained. For S/H=0.1 the comparison is in reasonable
agreement far from the leading edge. In fact, the numerical solution
neglects the streamwise second derivatives and tends to overpredict the
temperature gradients at the wall close to the inlet section of the
channel. For S/H=0.05 the disagreement persists over the bottom half of the
channel. In fact, the region affected by non-zero vertical temperature
gradients develops along a relatively large portion of the channel, as
appears from Fig. 4. 13 (b). Moreover, the experimentally reconstructed
temperatures become increasingly higher than the predicted results as the
unheated (passive) wall is approached. This phenomenon, also observed by
other experimentalists (Webb and Hill, 1989) in similar conditions, could
be the result of minor radiation heat transfer to the passive wall from the
heated wall. The variation of thermophysical properties (not included in
the predictions) could also introduce additional discrepancies between
measured and computed data.
Local heat transfer results are reported in Figs.4.20 and 4.21. In
particular, Fig. 4.20 shows the local heat transfer coefficients, evaluated
by the schlieren focal filament method, plotted against the local elevation
x, for all the aspect ratio values, while in Fig.4.21 local heat transfer
characteristics are presented in dimensionless form, through the local
Nusselt number Nu and the local Rayleigh number Ra. For each S/H value,
X X
the local heat transfer coefficient has been estimated by an average
between values recorded, at the same elevation, at the left and right sides
of the heated plate assembly. As is evident from inspection of the
figures, there are only small differences between the heat transfer
coefficients obtained for S/H between 0. 1 and 0. 4. Entrance effects are
responsible for the larger heat transfer coefficients at the leading edge
as S/H is progressively reduced. For the lowest aspect ratio investigated
(S/H=0.05), the heat transfer coefficient distribution starts from a very
high value, due to the acceleration of inlet flow provoked by the reduced
passage area, and then sharply decreases as the axial coordinate is
increased.
Figures 4. 22 and 4. 23 refer to the overall heat transfer
characteristics. As explained in Appendix A2, the overall heat transfer
coefficient of the heated plate can be obtained in two different ways:
(a) by evaluating, from the energy balance, the overall convective heat
transfer from the wall to the fluid (h );
av
(b) by numerically integrating the local heat transfer coefficients given
by the schlieren experiments over the heat transfer area (h ).
0
Firstly, h and h are plotted as
av o a function of the aspect ratio S/H
(Fig.4.22). Data obtained by the two different procedures are in excellent
agreement (within ±4%). From both the energy balance and the optical
slightly affect the overall heat transfer coefficient. In the range of
S/H from 0. 4 to 0. 2, the heat transfer effectiveness is constant. For
S/H=0.1, the heat transfer coefficient has a maximum value. This is due to
the entrance effect (acceleration of flow at the inlet section) that
provokes an increase of heat transfer efficiency close to the leading edge.
Further reductions in S/H lead to larger enhancements at the leading edge,
but the boundary layer is likely to interact with the opposite plate; as a
result, the overall heat transfer coefficient decreases. The dimensionless
overall results are plotted in Fig.4.23, where the modified Nusselt numbers
(obtained both from the heat balance and the optical data) are reported
versus the modified Rayleigh number and compared with data from the
literature. Symbols refer to experiments while solid, dashed and dotted
1 ines represent the composite equation of Bar-Cohen and Rohsenow (1984) ,
the semiempirical relationship of Sparrow et al. (1985) and the numerical
results of Tanda (1987), respectively. The experimental results presented
here are successfully correlated by the Bar-Cohen and Rohsenow formula,
with deviations within ±4%.
4.4.2 The rib-roughened channel
The majority of experiments were conducted in the presence of the
ribbed channel configuration, depicted in Fig. 4.10. The input parameters
were again the Rayleigh number and the aspect ratio of the channel, ranging
from 0.05 to 0.4. A further geometrical parameter, the rib pitch-to-height
ratio Pie was held fixed (P/e=7.2). For the purpose of comparison with the
smooth channel case, the majority of tests were performed under a constant
wall-to-fluid temperature difference of 45
K.
This gave a Rayleigh number7
equal to 1.8·10. Additional runs were conducted at wall-to-fluid
temperature differences in the range 10-45
K.
Owing to the particular geometry adopted, the degree of uniformity in
surface temperature was checked by a large number of thermocouples,
deployed along the symmetry line of the heated plate as well as laterally.
Again, the surface temperature readings were uniform within ±2% of the mean
wall-to-fluid temperature difference. The repeatability in overall heat
transfer coefficients was within ±1% for the heat balance evaluation and
within ±2.5% for the integration of the local optical measurements.
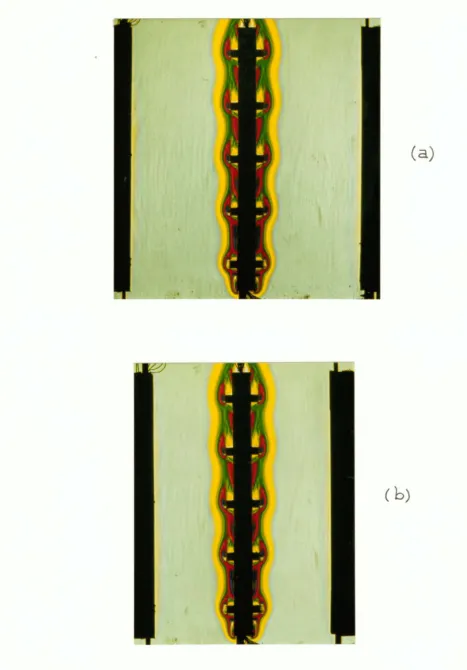
Schlieren images obtained by the colour method are presented in Figs.
4.24-4.26, with the colour filter displaced either in the vertical or in
the horizontal position. The perfect steadiness of colour pattern
-demonstrated that the flow regime was laminar. First, attention is focused
on light deflections occurring along they-direction. Results are presented
for S/H=0.4 (Fig.4.24 a), 0.3 (Fig.4.24 b), 0.2 (Fig.4.25 a), 0.1 (Fig.4.25
b) and 0.05 (Fig.4.25 c).The Rayleigh number was 1.8·107• Owing to the
presence of ribs, the contour of the coloured region is wavy, except for
the image recorded for S/H=0.05 (Fig.4.25 c), where the line of separation
between the coloured region and the undisturbed (light blue) region
vanishes. In particular, the contour of each coloured line in the inter-rib
region is arc-shaped, thus indicating a similitude between thermal fields
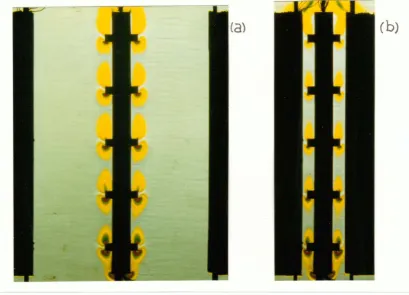
upstream and downstream of each rib. From inspection of Fig.4.26 it is
evident that significant temperature gradients in the vertical direction
occur not only close to the leading and trailing edge of the channels but
also around each rib. This is due to the presence of the horizontal rib
walls that induce upward and downward heat fluxes to the fluid.
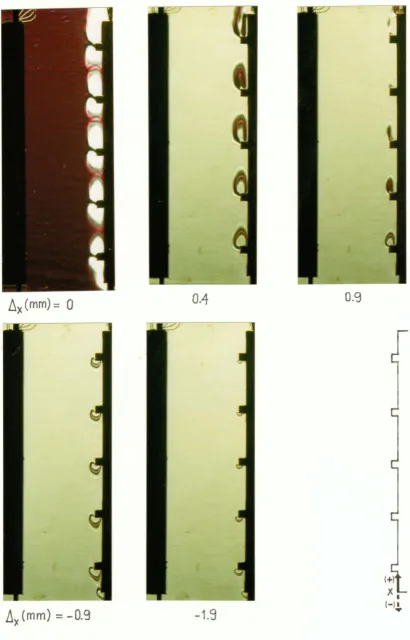
Typical schlieren images obtained by the focal filament method are
reported in Figs. 4.27 and 4.28 for S/H=0.3 (Ra=l.8·107). The focal
filament, when displaced vertically (Fig.4.27), was progressively shifted
from~ =O mm (reference position) to~ =3.4 mm. When the filament was set
y y
horizontally (Fig.4.28), it was moved from~ =-1.9 mm to~ =0.9 mm, passing
X X
through the reference position~ =O. The contours of the filament shadows
X
are clearly much more complex than those for the smooth channel case. In
addition, owing to the complexity of the geometry, both vertical and
horizontal components of light deflection are required to evaluate in
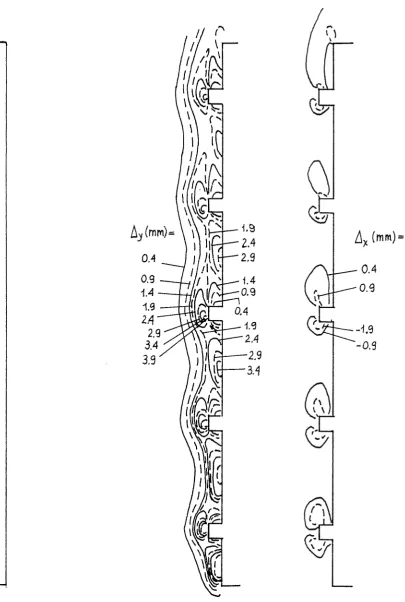
detail the heat transfer characteristics. Contours of lines deflecting the
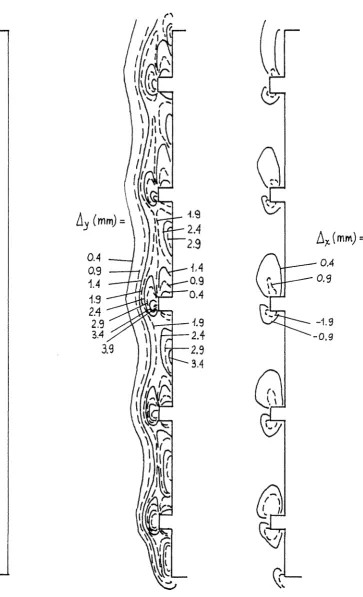
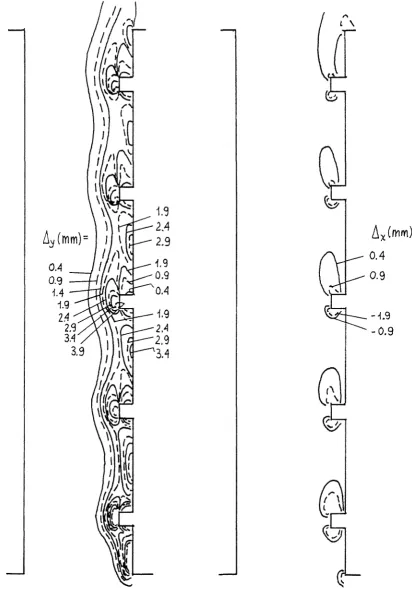
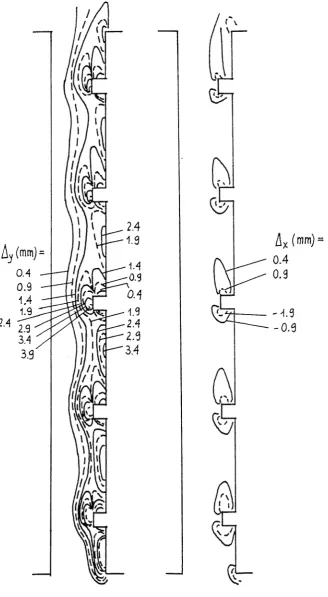
light by the same amount are plotted in Figs. 4.29-4.33 for Ra=l.8·107 and,
in sequence, for S/H=0.4, 0.3, 0.2, 0.1, and 0.05. For each experiment at a
given aspect ratio, both curves at equal~ and~ are reported. In order
y X
to facilitate the understanding of each graph, different colours have been
used to identify lines at equal deviation of light. The corresponding
thermal fields have been successively reconstructed.
Temperature results are presented in Fig. 4. 34 for S/H=O. 4 (a) and
0.05 (b). The isotherm contours were extracted for the first module (space
between the first and second rib) and for the last module (space between
the fourth and the fifth rib) of the channels. In general, the isotherm
plots clearly show the dead zones just upstream and downstream of each rib
as well as the wall regions of high heat transfer performance, on the rib
layer occurs. It can be seen that in the case of a large aspect ratio
(S/H=0.4, Fig. 4.34 a) the isotherms are packed close to the ribbed wall.
For instance, the lowest isotherm line plotted, corresponding to 0=0.1, is
at a distance from the ribbed wall which is between 10 and 15 percent of
the channel spacing S, when the first (bottom) module is considered. The
distance of the isotherm 0=0. 1 from the ribbed wall slightly increases
(between 17 and 22%) in the last (top) module, close to the channel exit.
This means that a considerable part of the fluid driven upwards through the
channel remains practically unheated. For the lowest aspect ratio
(S/H=0.05, Fig. 4.34 b) the air flowing into the channel is strongly
heated. Its dimensionless temperature 0 always exceeds 0. 3 in the first
module and reaches 0=0.6-0.65 at the adiabatic wall close to the exit of
the last module.
At tent ion is now turned to heat transfer coefficient distributions.
Figures 4.35-4-39 show, in sequence, the local heat transfer coefficients
along the wall profile for S/H=0.4, 0.3, 0.2, 0.1, and 0.05. As for the
smooth channel case, each local heat transfer coefficient was evaluated by
averaging the values recorded, at corresponding positions, for the two
adjacent symmetrical channels.
The local heat transfer data in all of the figures display a common
behaviour. In general, heat transfer coefficients start from high values at
the leading edge and then sharply decrease, reaching a very low value
(close to zero) upstream of the first rib owing to the reduction in flow
velocity due to the obstruction. At the forward facing wall of the first
rib an increasing h i s apparent from the base to the tip of the rib. On the
top of the first rib, the heat transfer coefficient is very high at the
leading edge, then drops off towards the middle of the top of the rib and
increases slightly as the downstream edge is approached. A strong decrease
in heat transfer occurs along the rear facing wall of the rib. In fact,
near the corner between this rib wall and the baseplate wall, the fluid is
stagnant and the surface is practically adiabatic. In the space between the
first and second ribs, the heat transfer coefficient has a progressive
increase, reaches a peak value approximately at the inter-rib midpoint and
then falls again to a very low value, at the corner between the base plate
and the forward facing wall of the second rib. The variation in heat
transfer coefficient between subsequent ribs is periodic in nature and the
periodicity is equal to the rib pitch. Obviously, comparisons of h values
at points separated by a distance equal to the rib pitch exhibit a
progressive reduction from the bottom to the top of the channel. This is
due to the developing thermal field and to the definition of heat transfer
coefficient here assumed, h being based on the temperature difference
between the heated wall and the inlet (not bulk) fluid. It is interesting
to note that the heat transfer distributions along the top of the ribs from
the second to the fifth do not exhibit the slight increase towards the
trailing edge recorded for the first rib, except for the S/H=O. 05 case,
where the shapes of the profiles are similar for all the ribs. The effect
of the aspect ratio on local heat transfer characteristics can be deduced
from Fig. 4.40, where h profiles for S/H= 0.4, 0.1, and 0.05 are directly
compared. As observed for the smooth channel, the lowest aspect ratio
(S/H=0.05) leads to heat transfer enhancement at the leading edge of the
plate (here including the first rib top). Then h decreases to levels
clearly lower than those recorded for the highest aspect ratio (S/H=0.4).
The locations of the maxima in the inter-rib regions do not seem to be
significantly affected by the aspect ratio of the channel. This indicates
that the stagnant zone upstream and downstream of the rib is scarcely
influenced by the channel aspect ratio, in the range of the S/H values
studied.
Figure 4.41 shows the heat transfer coefficients averaged per module.
The drawing close to the distributions of average heat transfer
coefficients clearly shows the extent of each wall module (I, II, I II and
IV). As expected, module-averaged heat transfer coefficients gradually
decay as the exit of the channel is approached. Only small differences
occur among data obtained for S/H values from 0.4 to 0.1. Conversely, data
recorded for S/H=0.05 are significantly lower, especially for the last wall
modules.
The heat transfer coefficients normalised by the corresponding
module-averaged values are presented in Fig. 4. 42. Only data recorded for
the two extreme aspect ratios (S/H=0.05 and 0.4) are plotted. It appears
from the figure that the profiles of normalised heat transfer coefficients
repeat themselves almost identically after the second or third module. The
positive role, from the heat transfer point of view, played by the rib top
wall is greater for the smaller aspect ratio, especially in the first
modules, owing to the acceleration induced in the relatively cool air flow.
pronounced when the aspect ratio is larger.
Overall heat transfer coefficients are shown in Fig.4.43. The overall
values h
av and h obtained by two different procedures are presented. Heat 0
balance and optical results show the same trends and differ from each other
by within ±6 percent. The larger differences occur at the lowest S/H, where
radiation induces effective errors (affecting h ) and uncertainties in
av
optical data (affecting h) are higher. It is apparent from the figure that
0
there is an optimum aspect ratio which maximises heat transfer (S/H about
0. 1) . For larger aspect ratios ( up to O. 4) , the over al 1 heat transfer
coefficient slightly decreases (to about 5%) while passing from S/H=O.l to
0.05 the extent of the reduction is higher (about 25%).
Overall heat transfer results for the rib-roughened channel are
summarised in Fig. 4. 44 and compared with those for the smooth channel.
The presentation of data is performed on the basis of the modified Nusselt
number against the modified Rayleigh number. The rough channel results
plotted on the graph were obtained for S/H ranging from 0.05 to 0.4 and for
wall-to-fluid differences from 10 to 45
K.
The majority of data are well correlated by the relationshipNu = 0. 41 ·Ra0·25 (4.3)
m m
It should be noted that for the lowest S/H values (or for the highest e/S
values) the rough channel data do not fall on the same line. It means that
the modified Rayleigh number does not properly express uniquely the effect
of (T -T ) and geometric parameters, as occurs for the smooth channel
w air
case. This suggests that Ra (based on H), S/H, and e/S (P/e being fixed)
are likely to act as independent parameters. Therefore, the relationship
(4.3) is valid in the following range of parameters:
Pie
Ra
m
= 7.2;
2 5
- 2·10 -5·10; S/H 2:: 0.075
e/S::; 0.37
(T -T )~ 10-45 K.
w air
In the whole ranges of parameters, rough channels results are always below
the line fitting the smooth channel results.
Of particular interest is the comparison depicted in Fig. 4. 45. Here
the ratio between Nu numbers pertaining to the rough and smooth channel
Nu /Nu is plotted as a function of the aspect ratio, the Rayleigh
av,r av,s
number being fixed (Ra=l.8·107). In addition, the ratio CIC (between the
r s
-thermal conductances of the rough and smooth channel) is reported. The
thermal conductance expresses the product of the overall heat transfer
coefficient and the heat transfer area. Since the heights of rough and
smooth channels are equal, adding the ribs leads to an increase in surface
area that should be taken into account. As is evident from inspection of
the figure, the comparison in terms of conductances is not so negative as
that in terms of Nusselt numbers. Nevertheless, the increase in heat
transfer surface area due to the ribs does not compensate for the decrease
in heat transfer coefficient.
Finally, comparisons of the heat transfer results with those published
in the literature have been performed. Firstly, local heat transfer
coefficients are compared with those obtained by Bhavnani and Bergles
(1990) using a Mach-Zehnder interferometer (Fig.4.46). The test section
used by Bhavnani and Bergles was slightly different from that employed in
this study. In fact the pitch-to-height ratio Pie was 8 (instead of 7.2),
the ribbed wall was not faced by an adiabatic parallel wall and the ribs
were press-fitted onto the baseplate and not integral with it. Moreover,
the Rayleigh number corresponding to the heat transfer coefficient
distribution was not given in the reference; only the range of the heated
wall temperature (48-75 °C) in the course of experiments was indicated.
Despite the differences in the test conditions, there is good agreement
between present data (with S/H=O. 4) and those previously published. The
shapes of heat transfer distributions are similar, this taking into account
that only one value per rib (on the top wall) was recorded by Bhavnani and
Bergles. The same Authors developed a relationship giving the heat flux Q
as a function of the wall-to-fluid temperature difference 6T and the height
Hof the heated plate. For P/e=8, 6 ribs, H=0.1778 m, they found Q = 0.826
H 6T. On the basis of the description of the experimental runs provided by
the Authors, the relationship should apply for 6T about from 23 to 50 K.
For the 6T considered in this project (45 K), one obtains Q/(HL)= 292. 7
W/m2, where Lis the test section length in the direction z, aligned to the
direction of the light beam, and HxL is the heat transfer area projected on
the x-z plane. Experiments conducted for S/H=0.4 gave Q/(HL)= 258.6 W/m2,
where Q is the heat flux derived from the energy balance (Eq.A2.16 in
Appendix A2), H=0.175 m is the plate height and Lis the overall length of
the plate assembly in the z-direction (L=0.3 m x 2=0.6 m). The discrepancy
account the experimental uncertainties associated to the experimental
methods employed and the above-mentioned differences in the test
geometries. Reductions in heat transfer coefficients, relative to the
smooth plate, were around 23% (Bhavnani, Bergles) and 27% (Tanda, present
project), respectively.
A further comparison of heat transfer results has been performed with
measurements made by Acharya and Mehrotra (1993) for a channel formed by
two facing rib-roughened plates, heated at constant wall temperature. The
geometrical parameters were: P/e=4.8 and 9.6, H=0.1524 m, S/H=0.167,
6 6
Ra=3·10 -7.5·10. For both the pitch-to-height values, Acharya and Mehrotra
found, by the calorimetric technique, reductions in heat transfer
coefficients, with respect to the smooth channel case, of only 10-13%. It
is believed that heat transfer coefficients introduced by these Authors are
based on the baseplate surface area (HxW). In this case, the comparison has
to be performed with the conductance ratio C IC , which turned out to
av,r av,s
be about 7-8% in the present experiments, for S/H = 0.1-0.2. The
relationship between modified Nusselt and Rayleigh numbers found by Acharya
and Mehrotra has the same exponent (0.25) as the equation obtained here.
The coefficient (0.396) is only 3.5% lower than that found here (0.41), in
spite of the different channel configuration (two facing ribbed and heated
walls instead of one ribbed heated wall opposite to a smooth unheated
wall). The excellent agreement demonstrates that for the Acharya-Mehrotra
experiments (at S/H=0.167) the two boundary layers growing along the
opposite ribbed walls do not significantly interact. Therefore, for aspect
ratio larger than 0.167, the thermal behaviour of vertical channels with
one or two ribbed walls is likely to be the same.
FIGURE 4. 1
FIGURE 4. 2
air flow.
Schematic view of the test section.
/ /
~
f"7
exit air passage"-.JV
....
...
/ /
/
I
I
:
r--- ----
---:ilii u .t::r ~ I
'I o- I
'L _____ - - - '
- -
-
- - -
---/
...
s
H
glass
walls
open grids for inlet air passage
1P-e
....1..-2
s
FIGURE 4.3
measurements.
thermocou!;)Le
X thermocou!;)Le (in the material)
Positions of thermocouples for wall and air temperature
FIGURE 4.4 Photograph showing the detail of the housing of electrical heaters and thermocouples in the aluminium plates.
-(camera)
Light source
(a)
FIGURE 4. 5 (a) Schlieren apparatus mirrors, with focal lengths f1 and f2, distance between mirrors about 8 m); (b) at the focal plane of mirror M2: the position 1 to position 2.
/
/
/
/a
' y
Test section
(b)
Undisturbed ray
X
Disturbed ray'-/
\ Focal filament \
(top view): M1 and M2 are concave respectively (f1=f2=l. 9 m, 0=9°,
measurement of light deviation ~Y focal filament is shifted from
FIGURE 4. 7 Coloured-strip filter
( C)
(a)
( b) ( d)
FIGURE 4. 8 Colour schlieren method: (a) light beam entering the test section (a vertical heated wall), (b) angular deflections on the z-y plane,
(c) positions of 0-1-2-3-4 rays at the focal plane where the colour filter is held, (d) colour schlieren image.
-s
H
FIGURE 4. 9
s
H
/
FIGURE 4.10
+-l<
t
s
Sketch and photograph of the smooth channel configuration.
...-.
t
(a)
(b)
FIGURE 4.11 Colour schlieren images of the smooth channel assembly, filter
7
mounted vertically, Ra=l.8·10: (a) S/H=0.4, (b) S/H=0.3.
-Ca)
(b)
(C)FIGURE 4.12 Colour schlieren images of the smooth channel assembly, filter mounted vertically, Ra=l.8·107: (a) S/H=0.2, (b) S/H=0.l, (c) S/H=0.05.
(a)
(b)
FIGURE 4.13 Colour schlieren images of the smooth channel assembly, filter
7
fly
(mm)=
D
0.4
1.4
2.4
fiy(mm) =
2.9
3.4
3
.
9
4.9
FIGURE 4. 14 Schlieren images (focal filament method) of the smooth channel configuration, filter mounted vertically, Ra=l.8·107, S/H=0.3. ~ from O (top left) to 4.9 mm (bottom right).
y
-(a)
5/~=0.4
/J.y
(mm)0.4
1.4
2.4
2.9
3.4
3.'3
( b)
5/H
=
0.3
f1y(Y<lrn)
0.4
1.4
2.4
2.9
3.4
3.:J
4.9
X
FIGURE 4.15 Lines of constant light-deviation
ty
for the smooth channel<a)
S/W=0.2
/J.y
(mm)
0.4
1.4
2.4
2.9
3.4
3.9
4.<J
'j
IJ.y
(mm)
0.1S
0.4
i.4
2.4
2.9
3.9
4.9
X
S/~=0.1
2.~
X
'j
(C)
S/H=
0.05
Ly
(rnm)
0.4
1.4
2.4
2.g
0:15
3.4
3.S
4.3
2.4
X
FIGURE 4.16 Lines of constant light-deviation ~Y for the smooth channel
configuration, Ra=l.8·107. (a) S/H=0.2 , (b) S/H=0.1, (c) S/H=0.05.