Title: The quantitative assessment of inter-utterance stability: application to dysarthria
Authors: Fred Cummins1, Anja Lowit2, and Frits van Brenk2 1
University College Dublin
School of Computer Science & Informatics Computer Science Building
Belfield Dublin 4 Ireland
2
School of Psychological Sciences and Health Strathclyde University
40 George Street Glasgow G1 1QE UK
Corresponding Author: Anja Lowit, PhD
School of Psychological Sciences and Health Strathclyde University
40 George Street UK - Glasgow G1 1QE [email protected]
Abstract
Purpose: Following recent attempts to quantify articulatory impairment in speech, we evaluate the usefulness of a novel measure of motor stability to characterise dysarthria.
Method: We investigated 8 speakers with ataxic dysarthria (AD), 16 speakers with hypokinetic dysarthria (HD) as a result of Parkinson’s Disease and 24 unimpaired control participants. Each participant performed a series of sentence repetitions under habitual, fast and slow speaking rate conditions. We used an algorithm to measure utterance-to-utterance spectro-temporal variation (UUV; Cummins, 2009). Speech rate and intelligibility were also measured.
Results: UUV scores were significantly correlated with perceptually based intelligibility scores. There were significant differences in UUV between control speakers and the ataxic, but not the HD groups, presumably due to differences in intelligibility in the samples employed, and not to differences in pathology. Habitual speaking rate did not correlate with UUV scores. All speaker groups had greater UUV levels in the slow conditions compared to habitual and fast speaking rates.
Introduction
The last few decades have seen a surge in the development of more and more refined techniques and measurements to investigate movement disorders. Such methods are useful, not only to shed more light on the symptoms of these disorders and their causes, but they can also be of significant clinical value in that they can support differential diagnosis of different types of motor speech problems, function as outcomes measures for treatment approaches, and allow clinicians to detect sub-clinical problems, thus enabling them to time treatment more effectively.
These methods are based on a wide variety of methodological paradigms. Noteworthy developments are papers by Liss and co-workers, who have published a number of methodologies over recent years that are successful in discriminating different types of dysarthric speech from each other and healthy control speakers (Liss, LeGendre, & Lotto, 2010; Liss et al., 2009; Utianski, Liss, Lotto, & Lansford, 2012). A further technique worth scrutinising is the variability measurement pioneered by Smith and co-workers (Smith, Goffman, Zelaznik, Ying, & McGillem, 1995) and subsequently expanded on by a number of other research groups. These have been used less to discriminate between different types of dysarthria, but more to highlight differences in motor control across healthy and disordered speakers as well as different elicitation paradigms.
modulations (EMS) (Liss, et al., 2010) and long-term average spectra (LTAS) (Utianski, et al., 2012). In each case, they were able to demonstrate their measures’ ability to distinguish between healthy and impaired speakers, as well as between different types of dysarthric speakers with relatively good success. Their measures were thus able to reflect particular qualitative aspects of the speech signal that might be present in one but not another type of dysarthria. It became evident that some measures were more suitable to detect impairments in particular disorders, for example, some were distinguished better by rhythm measures if this was a particular feature of the disorder, whereas other dysarthria types were better discriminated with the amplitude measure. The authors thus advocate that the complete protocol of measures should be employed rather than just one measure in isolation. Such an application would be facilitated by the fact that they are all based on the same speech data, which makes the analysis more clinically viable by reducing assessment time. One of the drawbacks of Liss et al.’s (2009, 2010) and Utianski et al.’s (2012) methodology, however, is that their measures are time consuming to evaluate and require a good knowledge of acoustics (e.g. in order to identify consonant and vowel boundaries in the spectrographic signal for the rhythm measure) as well as data processing skills by the examiner, probably to a level that cannot be expected of the average clinician.
to consistently and accurately execute a specific pattern of speech motor movements during a sequence of identical speech productions is reflected in the degree of token-to-token variability in the resulting speech output. Any abnormalities in strength, speed, steadiness or accuracy of speech movements will likely be reflected in the amount of variability present in speech production tasks with reiterated utterances.
The above studies have established differences between disordered and unimpaired speakers, and provided a range of experimental setups that serve to bring to light such differences. They furthermore highlighted the value of the STI for increasing our understanding of motor control processes. However, similarly to Liss et al.’s (2009, 2010) and Utianski et al.’s (2012) methods, the STI is insufficiently developed to function as an effective research or clinical tool. One of the biggest drawbacks is the invasive and complex nature of the associated technology, which generally involves lip tracking. This requires specialist equipment and the procedures might not be easy to tolerate for participants with motor and sensory impairments. Participant numbers in previous studies have therefore been low, impacting on the statistical power and predictions made by these experiments. In order to address these problems, methods involving acoustic data collection and analysis have been successfully validated in replicating findings of the kinematic STI (Howell, Anderson, Bartrip, & Bailey, 2009). Acoustic recordings are a well established method of data collection in speech disorders and allow capturing of performance from a large number and wider variety of speakers. In addition, they allow greater freedom in experimental set-up, such as the choice of speech task and recording environments. A further methodological development has been to use a non-linear data processing approach (Functional Data Analysis (FDA), Lucero, 2005; Lucero & Koenig, 2000; Ramsay, Munhall, Gracco, & Ostry, 1996). This approach differs from the STI in that it produces separate information on spatial and temporal variability. Studies by Anderson, Lowit, and Howell (2008) and van Brenk and Lowit (2012) applied FDA to acoustic data in the form of formant, intensity and pitch tracks and demonstrated that the technique has good potential of distinguishing between different types of dysarthria.
signal for any aberrant data points, particularly for the formant and pitch analyses, thus precluding it from being a readily useable clinical tool in its current form. For any acoustic or other instrumental measure to have any clinical value, it is thus necessary to develop an evaluation procedure that is quick and easy to use, yet at the same time provides valid data that reflect the severity and type of speech impairment experienced by an individual.
effectiveness of their interventions and researchers to evaluate different treatment methods against each other.
Methods
Participants
The speakers and tasks reported in this study form a subset of a larger study (see van Brenk & Lowit, 2012). All data collection and analysis procedures adhered to current ethical
correlation coefficient (ICC) was calculated (Sheard, Adams & Davis, 1991). The ICC was .868 (95% CI: .778 to .933) and thus showed good agreement between listeners. Results of all three assessments correlated strongly with each other. For ease of reference, only the data of the sentence intelligibility test, expressed as percentage of correctly transcribed words, are reported here (Table 1). The data show that there was a difference in intelligibility between the HD and AD speakers, with the AD speakers generally showing a lower intelligibility level (mean intelligibility HD: 84%, AD: 68%), although there was some overlap between the two groups.
Insert table 1 around here
Recording and Analysis Procedures
Participants were recorded in a quiet environment in their homes, at the university or at the local clinic they were attending. Audio recordings were taken using a wave recorder (Edirol R-09HR) connected to a head-mounted condenser microphone (AKG C-420). The data recorder supplied Phantom Power to the microphone. Data were sampled at 44.1 kHz at 16 bits. The head-mounted device allowed for a constant distance of approximately 4 cm between the speaker’s mouth and microphone during recording.
Experimental Tasks
variability, they repeated this task under six different conditions. For the purposes of the current analysis, three tasks commonly used in previous research on variability were chosen, i.e. habitual, fast and slow speaking rates. Coordinative stability is frequently rate-dependent, which motivates the examination of multiple speaking rates. It also allowed the comparison of the current results with those from other previously published measures such as STI and FDA, which detected higher levels of variability in altered rate conditions (e.g. Smith et al. 1995), in order to evaluate the validity of our results. Participants were allowed to self-select rate in the habitual condition and were instructed to speak half as fast or twice as fast as their usual rate for the slow and fast conditions respectively. The aim was to achieve 20 to 25 repetitions of the phrase, however, not all speakers could achieve this target.
Measurement Parameters
First, an automated Praat script was used to divide the recording up into individual utterances. This script used a sliding window to look for pauses based on waveform intensity. To facilitate the analysis of a lot of data, the resulting segmentation into individual utterances was visually checked rapidly by the experimenter, omitting data where the algorithm either failed to place a boundary correctly, or placed inappropriate boundaries. For each sequence of utterances, then, utterance i was compared to utterance i+1, by aligning the two utterances and estimating the amount of warping that would be required to map one onto the other. For highly similar utterances, this is a low number, and for disparate utterances, it increases. For n utterances, this provides n-1 comparisons, and these estimates can then be used for intra- and inter-group comparisons.
Within-trial variability in the inter-utterance variability score was rather high for both disordered speakers and control participants. This presumably arose because of the difficulty in maintaining an invariant repetition style for a prolonged speaking time. We therefore removed from a trial all inter-utterance variability scores that were more than two times the interquartile range from the median. All subsequent analyses were performed on the trimmed data. Trimming removed between 2.0% and 7.0% of data points. Comparable amounts were removed for both control participants and those with dysarthria.
A further measure taken from the data for control purposes was rate. Because participants can respond to the experimental imperative to speak more or less rapidly in various ways, we initially evaluated both articulation and speech rate behaviour. Subsequent statistical comparisons with other speech parameters revealed the same results for both measures and we therefore restrict the discussion to articulation rate. As some of the disordered speakers had a tendency to omit individual phonemes from their production, we decided to use the reciprocal of articulation rate by measuring the average interval duration within a trial from the onset of voicing in “Tony” to the end of voicing in the word “in”. To validate the measure we calculated the actual articulation rate for the control speakers based on their interval durations, which provided a mean of 4 syllables per second, which is within the normal range for a reading task. For simplicity of language, we will use the term articulation rate in the following discussion.
Statistical Analysis
into one group. For across group comparisons, the division between AD and HD controls was maintained in order to ascertain a close match with the disordered groups in terms of age and gender. Bonferroni corrections were applied to all statistical analyses.
Results
Articulation Rate and UUV
We first examined articulation rate to see whether participants did in fact modulate rate as a function of experimental condition. Within each condition, we conducted paired t-tests for rate, with the conservative Bonferroni correction of p-values for repeated tests. The results are provided in Table 2, from which it can be seen that the control group and the HD group successfully modulated rate, while the ataxic group (AD) did not display substantial modulations.
Insert Table 2 about here.
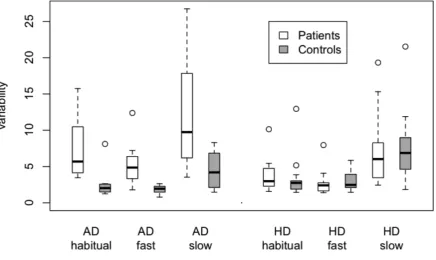
We then compared the utterance to utterance variability (UUV) exhibited by each patient group to their respective controls in each of the rate conditions, habitual, fast and slow. Figure 1 shows the distribution of the median UUV scores for both patient groups and their respective control participants. Bonferroni-protected paired t-tests are reported in Table 3. It is evident that UUV differentiates between the AD group and their controls, but not between the HD group and their respective controls, despite the fact that participant numbers are considerably smaller in the AD comparison.
Insert Figure 1 about here
Insert Table 3 about here
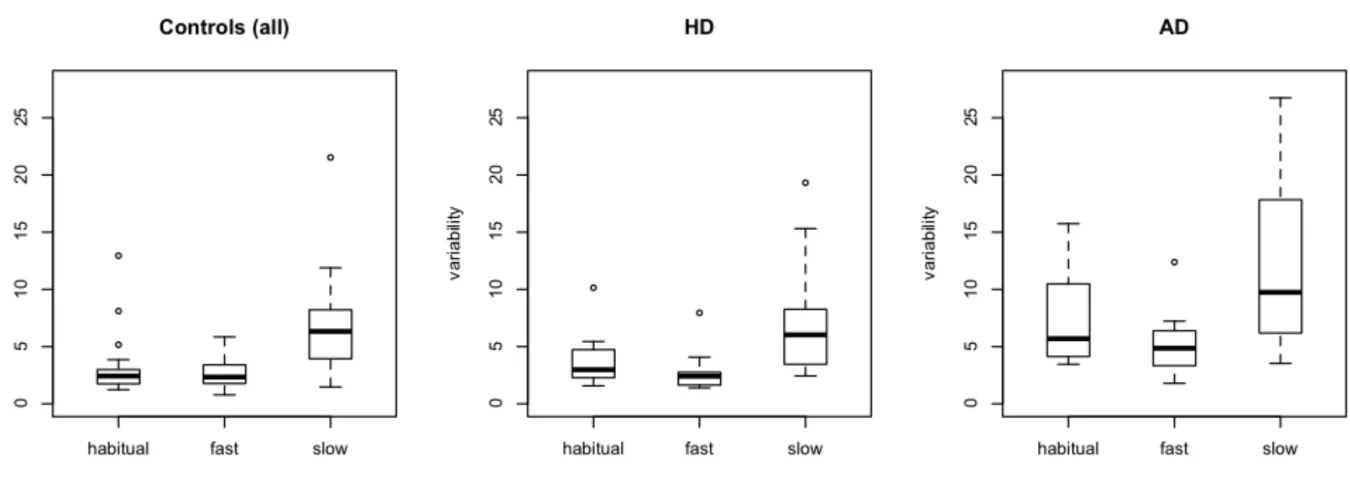
habitual, fast, and slow rate (the AD and HD control participants were considered as one group for this analysis). We applied the Greenhouse-Geisser correction for departure from sphericity. The medians are shown in box plots in Figure 2. There was a significant effect of condition for control participants (F(1.4, 32.6)=12.4, p < .001), for the speakers with Parkinson's Disease (F(1.0, 15.7)=8.1, p < .05), as well as for the AD group (F(1.3, 9.3)=5.2, p < .05). Tukey HSD post hoc tests revealed significant differences in UUV between slow and habitual rates for controls and HD participants, and between slow and fast conditions for all three groups, with slow rates having the highest UUV value in each case. These results suggest that although speakers’ performances were affected by the speaking task, the direction of between task differences was similar across all participant groups.
Insert figure 2 about here
Correlations between UUV, rate and intelligibility
In summary, the results showed that UUV changed across rate conditions in all three participant groups, but that the AD group were more affected in the UUV than the HD group compared to their respective control participants. There are a number of potential reasons for this difference in results between the HD and AD groups. One factor ncould have been rate, which was modulated differently in the two groups. The other could have been dysarthria severity, as the HD group had higher intelligibility levels than the AD group. Finally, the results could reflect inherent differences in the underlying pathology and how this affects the speaker’s ability to repeat the same utterance in a consistent manner.
correlations between UUV and rate (AD: r(6)=0.78, p<.05, HD: r(14)=0.74,p<.01). The fact that both HD and AD speakers were affected in similar ways suggests that rate differences between the two groups were not the cause of the varying results observed for the UUV. However, these results lead to some further interesting questions. First, the fact that UUV performance at habitual and fast rates was independent of actual articulation rate, but that there was some relationship at slow rates requires further investigation. Second, the similarity in results between HD and AD participants is interesting given the absence of any significant rate changes across the conditions displayed by the AD group. This suggests that although rate itself was not a factor, task demands might have been, i.e. AD speakers appeared to have greater difficulties slowing down, affecting their stability in motor control while executing this task.
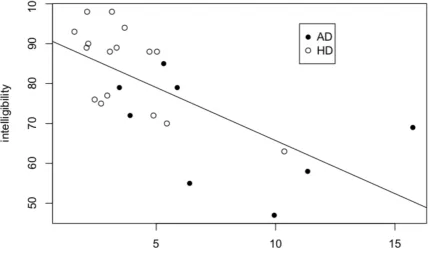
Sentence intelligibility (table 1) was negatively correlated with UUV for the HD group only in both habitual and fast rates, but not the slow rate (habitual: r(14)=-0.65, p<.01; fast: r(14)=-0.62, p<.05). Figure 3 plots UUV against intelligibility for both disordered groups in the habitual rate condition. A single regression line based on the combined data has been fitted (r(22)=-0.68, p<0.001). These data suggest at least a tendency for the relationship between intelligibility and UUV. It was particularly interesting to see changes in UUV even at the mild end of the severity range where speakers did not necessarily fall outside the normal range for intelligibility yet. This might suggest that the UUV is able to detect early, subclinical signs of speech disorders, however, this would require further investigation with larger participant numbers.
Insert figure 3 about here
This paper investigated whether the UUV has the potential to act as a valid and clinically viable tool to quantify the severity of dysarthric speech, and perhaps to differentiate among speech pathologies.
Validity
In terms of its validity, the across task comparisons for healthy as well as disordered speakers showed the same differences as have previously been reported for STI, i.e. higher variability for slow speech rates compared to habitual and fast rates (McHenry 2003, Smith et al. 1995). In addition, we also found that the disordered groups followed the same pattern of across task differences (cf. Smith & Kleinow, 2000; Kleinow & Smith 2000). The UUV thus appears to capture similar aspects of motor control as these other measures.
establish the minimum detectable change in a speaker’s intelligibility as represented by the UUV; however, these preliminary results are highly encouraging in this respect.
The current results thus suggest that the UUV has the same potential to reflect the severity of a person’s speech disorder and capture task dependent variations in motor control demands as other measures of variability. What sets is apart from them is that it has a practical advantage in terms of processing time and skills required by the examiner, which makes it a more viable option for clinical application.
Technical Implementation
As a note of caution, our experience with the application of this method suggests that it will be of most utility in cases in which UUV is mild to moderate, offering the possibility of sensitively indexing changes in articulatory stability over time. In repeated productions of the sort employed here, a single highly aberrant token will generate values that appear as outliers in the series. We found such outliers in both the control data and the patients, and to comparable extent in each group, suggesting that it is a reliable characteristic of such sequential productions. This suggests that a certain degree of utterance to utterance stability should be considered a prerequisite for the application of the method, and alternatives might have to be sought for more severe cases. However, the current participant sample did not include patients at the more severe end of the spectrum and further studies need to be conducted to assess the method’s suitability across the full range of client presentations.
Future Directions
In conclusion, we have introduced a new quantitative measure of utterance to utterance variability that can be employed in the quantitative assessment of dysarthria. Preliminary results show good comparability to existing validated measures, highlighting the potential to develop this measure into a clinically viable assessment tool and outcome measure in addition to its application to fundamental research on motor control in both healthy and disordered speakers. These findings now need to be confirmed by conducting further research with larger and more varied participant groups, further investigating the diagnostic value of the UUV, its sensitivity to change, as well as establishing a firm normative range for this measure.
Acknowledgments
We would like to express our thanks to all our participants who dedicated their time to this project. We would also like to acknowledge the support of the Scottish Funding Council for the PhD studentship which provided the speech data for the current investigation.
References
Anderson, A., Lowit, A., & Howell, P. (2008). Temporal and spatial variability in speakers with Parkinson's Disease and Friedreich's Ataxia. Journal of Medical Speech - Language Pathology, 16, 173-180.
Cummins, F. (1999). Some lengthening factors in English speech combine additively at most rates. The Journal of the Acoustical Society of America, 105, 476-480.
Darley, F. L., Aronson, A. E., & Brown, J. R. (1975). Motor Speech Disorders. Philadelphia: W. B. Saunders.
Dobinson, C. (2007). An investigation into the use of computers for conducting home practice of speech exercises for people with dysarthria. Unpublished PhD Thesis, Newcastle University, Newcastle upon Tyne.
Dromey, C., & Bates, E. (2005). Speech interactions with linguistic, cognitive, and
visuomotor tasks. Journal of Speech, Language and Hearing Research, 48, 295-305. Dromey, C., & Benson, A. (2003). Effects of concurrent motor, linguistic, or cognitive tasks
on speech motor performance. Journal of Speech, Language and Hearing Research, 46, 1234-1246.
Dromey, C., & Shim, E. (2008). The effects of divided attention on speech motor, verbal fluency, and manual task performance. Journal of Speech, Language and Hearing Research, 51, 1171-1182.
Howell, P., Anderson, A., Bartrip, J., & Bailey, E. (2009). Comparison of Acoustic and Kinematic Approaches to Measuring Utterance-Level Speech Variability. Journal of Speech, Language and Hearing Research, 52, 1088-1096.
Kleinow, J., & Smith, A. (2000). Influence of length and syntactic complexity on the speech motor stability of the fluent speech of adults who stutter. Journal of Speech,
Language, and Hearing Research, 43, 548-559.
Kleinow, J., Smith, A., & Ramig, L. O. (2001). Speech motor stability in IPD: effects of rate and loudness manipulations. Journal of Speech, Language and Hearing Research, 44, 1041-1051.
Liss, J. M., White, L., Mattys, S. L., Lansford, K., Lotto, A. J., Spitzer, S. M., et al. (2009). Quantifying speech rhythm abnormalities in the dysarthrias. Journal of Speech, Language and Hearing Research, 52, 1334-1352.
Low, E. L., Grabe, E., & Nolan, F. (2000). Quantitative characterizations of speech rhythm: “Syllable-timing” in SingaporeEnglish. Language and Speech, 43, 377-401.
Lucero, J. C. (2005). Comparison of Measures of Variability of Speech Movement Trajectories Using Synthetic Records. Journal of Speech, Language and Hearing Research, 48, 336-344.
Lucero, J. C., & Koenig, L. L. (2000). Time normalization of voice signals using functional data analysis. The Journal of the Acoustical Society of America, 108, 1408-1420. McHenry, M. A. (2003). The effect of pacing strategies on the variability of speech
movement sequences in dysarthria. Journal of Speech, Language and Hearing Research, 46, 702-710.
McHenry, M. A., & Parle, A. M. (2006). Construction of a Set of Unpredictable Sentences for Intelligibility Testing. Journal of Medical Speech - Language Pathology, 14, 269-272.
Mioshi, E., Dawson, K., Mitchell, J., Arnold, R., & Hodges, J. R. (2006). The Addenbrooke's Cognitive Examination Revised (ACE-R): A brief cognitive test battery for dementia screening. International Journal of Geriatric Psychiatry, 21, 1078-1085.
Ramig, L. O., Countryman, S., Thompson, L. L., & Horii, Y. (1995). Comparison of two forms of intensive speech treatment for Parkinson disease. Journal of Speech, Language and Hearing Research, 38, 1232-1251.
Senin, P. (2008). Dynamic time warping algorithm review. Information and Computer Science Dept., U. Hawaii at Manoa Honolulu, 1-23.
Sheard, C., Adams, R. D., and Davis, P. J. (1991). Reliability and Agreement of Ratings of Ataxic Dysarthric Speech Samples With Varying Intelligibility. Journal of Speech, Language and Hearing Research, 34, 285–293.
Smith, A., Goffman, L., Zelaznik, H. N., Ying, G., & McGillem, C. (1995). Spatiotemporal stability and the patterning of speech movement sequences. Experimental Brain Research, 104, 493-501.
Smith, A., & Kleinow, J. (2000). Kinematic correlates of speaking rate changes in stuttering and normally fluent adults. Journal of Speech, Language, and Hearing Research, 43,
521-526.
Utianski, R. L., Liss, J. M., Lotto, A. J., & Lansford, K. L. (2012). The use of longterm average spectra (LTAS) in discriminating dysarthria types. Paper presented at the Conference on Motor Speech, Santa Rosa, California.
van Brenk, F., & Lowit, A. (2012). The relationship between acoustic indices of variability of speech motor control in dysarthria and other measures of speech performance.
Journal of Medical Speech - Language Pathology, 20, 24-29.
Table 1: Participant information, stating gender, age, medical diagnosis, intelligibility level and medication (HD participants only).
gender age diagnosis intell medication
AD1 M 40 CA 79
AD2 F 38 FA 58
AD3 F 63 MS 85
AD4 M 58 SCA8 47
AD5 F 44 MS 72
AD6 M 70 MS 55
AD7 M 37 MS 69
AD8 M 46 MS 79
Mean (SD) 49.5 (12.5) 68 (13.4) AD controls 3 F, 5 M
Mean (SD) 49.8 (14.3)
HD01 M 40 IPD 98 A 1x16mg; K 1x10mg
HD02 F 55 IPD 93 A 4x6mg; E 6xXmg
HD03 M 48 IPD 89 A 1x4mg
HD04 M 56
IPD
90
A 6x2mg; B 4x25/100mg; D 4x12.5/50mg; F 4x200mg
HD05 F 76 IPD 89 D 4x25/100mg
HD07 M 76
IPD
63
B 1x150mg; E 2x25mg; G 3x25/100/200mg; H 1x40mg; L 1x25mg
HD09 M 54
IPD
94
C 8x50/12.5mg; G 8-10x50/200/200mg
HD10 M 64 IPD 88 A 3x7mg
HD11 M 75 IPD 72 C 3x50/12.5mg; D 6x25/100mg
HD12 M 73 IPD 76 B 1x50/200mg; D 6x25/100mg
HD13 M 78 IPD 70 B 3x25/100mg; C 2x100/25mg
HD14 F 75
IPD
88
A 3x8mg; B 1x50/200mg; E 3x62.5mg
HD15 M 78
IPD
88
C 2x100/25mg; D 3x25/100mg; I 3x0.7mg and 3x0.18mg
HD16 M 67
IPD
77
A 3x4mg; B 1x50/200mg; D 3x25/100mg
HD17 M 60
IPD
98
A 3x8mg; B 3x25/100mg; C 1x100/25mg; D 4x50/200mg; J 1x100mg; K 1x1mg
HD20 F 65 IPD 75 D 4x25/100mg
Mean (SD) 65 (11.8) 84 (10.5)
HD controls 5 F, 11 M
Abbreviations: AD – ataxic dysarthria, HD – hypokinetic dysarthria, CA – cerebellar ataxia, FA – Friedreich’s ataxia, SCA – spinocerebellar ataxia, MS – Multiple Sclerosis, IPD – idiopathic Parkinson’s Disease
Table 2: Bonferroni-protected t-tests of the differences observed in a measure of articulation rate.
Ataxic Dysarthria Hypokinetic Dysarthria Control Group
t p t p t p
Habitual vs. Fast Habitual vs. Slow Fast vs. Slow
t(7) = 2.3 n.s. t(7) = -1.7 n.s. t(7) = -2.1 n.s.
t(15) = 5.2 *** t(15) = -3.3 * t(15) = -4.8 ***
t(23) = 8.6 *** t(23) = -4.4 *** t(23) = -5.5 ***
NB: Due to the Bonferroni correction, only significance levels rather than exact p values are reported: *** = p<.001, ** = p<.01, * = 0<.05
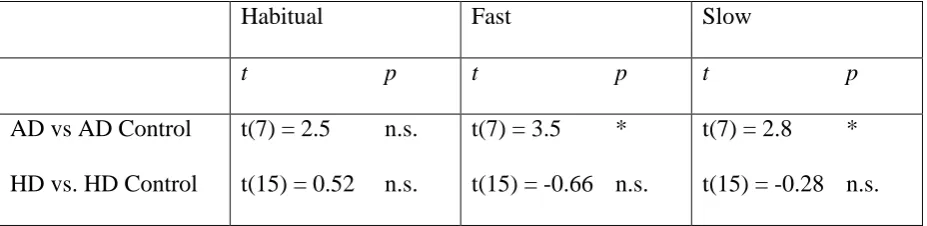
Table 3: Bonferroni-protected t-tests of UUV differences between participant groups at each rate.
Habitual Fast Slow
t p t p t p
AD vs AD Control HD vs. HD Control
t(7) = 2.5 n.s. t(15) = 0.52 n.s.
t(7) = 3.5 * t(15) = -0.66 n.s.
t(7) = 2.8 * t(15) = -0.28 n.s.
[image:25.595.67.531.446.559.2]