Target Detection and Recognition in SAR
Imagery Based on KFDA
Fei Gao
1, Jingyuan Mei
1,*, Jinping Sun
1, Jun Wang
1, Erfu Yang
2, Amir Hussain
31. School of Electronic and Information Engineering, Beihang University, Beijing 100191, China
2. Space Mechatronic Systems Technology Laboratory (SMeSTech) , Department of Design, Manufacture and
Engineering Management, University of Strathclyde, Glasgow G1 1XJ, UK
3. Cognitive Signal-Image and Control Processing Research (COSIPRA) Laboratory, School of Natural Sciences,
University of Stirling, Stirling FK9 4LA, UK
Abstract---Current research on target detection and recognition from synthetic aperture radar (SAR) images is usually carried
out separately. It is difficult to verify the ability of a target recognition algorithm for adapting to changes in the environment. To realize the whole process of SAR automatic
target recognition (ATR), especially for the detection and recognition of vehicles, an algorithm based on kernel fisher discriminant analysis (KFDA) is proposed in this paper.
First, in order to make a better description of the difference between background and target, KFDA is extended to the detection part. Image samples are obtained with a dual-window
approach and features of the inner and outer window samples are extracted using KFDA. The difference between the features of inner and outer window samples is compared with a
threshold to determine whether a vehicle exists. Second, for the target area, we propose an improved KFDA-IMED (Image Euclidean Distance) combined with a support vector
machine (SVM) to recognize the vehicles. Experimental results validate the performance
of our method. On the detection task, our
proposed method obtains not only a high detection rate but also a low false alarm rate without using any prior information. For the
recognition task, our method overcomes the SAR image aspect angle sensitivity, reduces the requirements for image preprocessing and improves the recognition rate.
Keywords: synthetic aperture radar; target detection; kernel fisher discriminant analysis; target recognition; image Euclidean distance; support vector machine
1.
Introduction
Synthetic aperture radar (SAR) extends the radar signal to two dimensions and greatly enriches the information acquired. It has become a landmark in the history of
development of radar technology.
With the increase of radar coverage area and continuous development in SAR imaging technology, the amount of SAR images has far
multi-polarization and multi-band, which
makes the information in SAR images more abundant but also demands higher requirements for target detection and recognition. Thus SAR ATR (automatic target
recognition) has become one of the hottest topics in the field of military defense over the past 20 years. In particular, vehicle (such as armored vehicle, tank, car, etc.) detection and
recognition are two important branches of SAR ATR. Researchers have thus proposed a variety of effective algorithms for these two emerging areas.
There are two categories of algorithms for vehicle detection in SAR images. The first is based on the contrast of pixels such as constant false alarm rate (CFAR) which is the
most classic and the most widely used algorithm. Novak et al. [1] derived a highly influential two-parameter CFAR detector with an assumption that the amplitude distribution
of the clutter is Gaussian, which opened a new chapter for target detection in SAR images. The development of many derivative algorithms such as OS-CFAR, VI-CFAR and
EF-CFAR has since followed. However, in the current situation, CFAR also faces enormous challenges. The main problem is that CFAR always yields a high false alarm rate under a
complex environment and weak-target condition as a result of ignoring the target‟s own features. The detection result also strongly depends on the selected distribution
model while there are considerable difficulties in building a universal distribution model. The
second category is based on a number of other
features of SAR images. Researchers in [2, 3] introduced the concept of knowledge and proposed a detection method based on prior knowledge and context information
respectively. These algorithms can fully use the prior information although much of it is often hard to obtain for strange geographical environments. Researchers in [4] developed a
multi-resolution algorithm for detecting man-made objects in SAR images. Authors in [5] used shadow information as a prescreening feature to improve detection performance.
One of the disadvantages for works reported in [4, 5] is that they apply complex advanced features such as multi-resolution and shadow. The access to these advanced features is not
easy and also a large amount of calculation is needed. Recently, a novel vehicle detection algorithm based on the visual attention mechanism [6] has become a major research
focus and is attracting growing attention of researchers.
There are also two categories of vehicle recognition algorithms in SAR images. The
first is model-based algorithm. In the literature [7-9] B. Bhanu et al. described their contribution to model building. They predicted a series of associated candidate targets through
the mathematical models and made a judgment by matching. The disadvantage of such algorithms is that building an SAR image model a high level of theoretical basis and
researchers [10] proposed a typical method
using original SAR images or sub-images as templates. However, this method is extremely sensitive to changes in depression angle and aspect angle so that it requires a large number
of templates. In recent years with the rapid development of feature extraction algorithms and classification algorithms, many feature-based classification algorithms for
SAR images are proposed. For feature extraction algorithms, works reported in [11, 12] characterized the features of scattering centers and used Prony model and Attributed
model respectively. The work of [13] demonstrated the feasibility of recognizing vehicle targets in SAR images using the peak feature. Work in [14] presented twenty
features (namely the standard deviation feature, fractal dimension feature etc.) as an evolutionary feature synthesis. The selection of these features is a difficult task. If we select
only one feature, this reflects the unilateral information of the targets, which may cause large deviation with a small number of training samples. If some of the features are
combined as feature synthesis, different synthesis lead to different recognition results since each feature may not be valid in a certain condition. Complexity can be
increased by using more features, yet it does not necessarily mean a better result. However, this difficult task gives rise to various linear or nonlinear transformation algorithms, which
are another important branch of feature extraction algorithms. These transformation
algorithms try to extract global features from
the entire image, which can remove redundant information and achieve dimensionality reduction. Linear principle component analysis (PCA) is applied in [15] to extract
features. The disadvantage of PCA is that it only considers second-order correlation between the samples and ignores the higher order statistics. In other works [16], classic
nonlinear kernel principal component analysis (KPCA) is used but simulation results show that the ability of KPCA to extract discriminative features is not effective. In
recent years, the idea of manifold ways of perception [17] has also been introduced to the field of SAR image feature extraction and become a popular research focus. For
classification algorithms following the feature extraction stage, researchers in [18, 19] used support vector machine (SVM) for SAR vehicle recognition and set off a new wave of
research. Adaboost is also used in [20], which has also been widely promoted. Currently SVM and Adaboost have demonstrated a lot better performance compared other
algorithms.
A vehicle is often presented as a substantially rectangular bright spot in SAR images. With the improvement of camouflage
technology, strong scatters of the vehicle are reduced so that target pixels and background pixels have less difference. When the vehicle is planning to escape detection and remains
decreasing and interference pixels increasing.
Some important features like scattering centers, object outline and shadow information are destroyed, so that traditional detection algorithms based on contrast such as
CFAR and others based on feature synthesis do not deliver the required performance.
In this paper, we attempt to use the global features difference between the vehicle and
surrounding environment to improve the detection performance of hidden targets. As kernel methods have been successfully applied to classification, we hope kernel methods can
be introduced into detection in SAR images, which is essentially a classification problem between two classes. KFDA is a well-known discriminative feature extraction criterion of
pattern class. It looks for a projection direction in a high-dimensional space, which can make the samples of different classes separated as far as possible with samples in the same class
gathered as close as possible. Thus, after acquiring the target samples and clutter samples with a dual-window approach, the use of KFDA to calculate the difference between
the two classes to achieve target detection may exhibit certain advantages. Simulation results show that application of the KFDA to SAR vehicle detection demonstrates performance. It
considers target features so that it can reduce false alarms which are highly bright and similar to the targets in traditional target detection algorithms [1]. Furthermore, without
the use of prior information, as in literature [2, 3], our KFDA method also avoids the
difficulty of selecting and extracting advanced
features [4, 5] and obtains a high detection rate and low false alarm rate. For SAR target recognition, the differences between each class of vehicle are subtle and highly localized
in few pixels. And for the case of real-world conditions, vehicles include variations in aspect angle, target configurations and obscuration due to occlusion and layover.
These difficulties place great burden on algorithms using one feature or a feature synthesis. In this paper, we attempt to exploit the efficiency of KFDA for extracting global
nonlinear features of SAR vehicle in order to improve the recognition rate. In order to clearly reflect the spatial relationship and the deformation degree between two images,
IMED is embedded in KFDA as an improved KFDA-IMED. Simulation results demonstrate that our KFDA-IMED method produces good recognition results for both the exposed targets
and hidden targets and avoids the difficulties of selecting features as in literature [11-14] without pre-processing and image segmentation.
This paper proposes an organically integrated vehicle detection and recognition algorithm for SAR images based on KFDA. If training samples are not available, detection
can still be achieved. Or if training samples are available, it can also enable vehicle recognition and validate the detection results in auxiliary. Furthermore, clutter samples can
reduce the number of false alarms generated in
the detection part.
This paper is structured as follows. Section 2 presents KFDA (KFDA-IMED). The proposed SAR vehicle detection and
recognition algorithm based on KFDA is described in Section 3. In Section 4, the experimental results of SAR vehicle detection and recognition are presented. We also analyze
the adaptability of the recognition algorithm to the diversity of the environment clutter and the influence of size of target image chip on the recognition rate. Section 5 presents some
concluding remarks.
2.
KFDA
and
Improved
KFDA-IMED
Assuming two different classes of n dimensional input samples can be projected to
a higher dimensional feature space
F
by anonlinear mapping
:
x
R
n
( )
x
F
, better linear separability of the samples can beobtained in the higher dimensional feature space. Following this their features can be extracted through the well-known Fisher‟s LDA (FLDA) [21].
Let
X
denote an input sample setcomprising
N
samples;X
i denote asubset of
X
comprisingN
i samples; and(
)
c c
n
denote the number of classes, thuswe have,
X
ci1X
i ,1 c i i
N
N
. Theinput samples
x
ij
X
i andx
j
X
can be mapped respectively in the higherdimensional feature space
F
as
( )
x
ij
ijand
(
x
j)
j.
The within-class scatter matrix of samples in the spaceF
is defined by: 1 11
(
)(
)
i N ci i T
w j i j i
i j
S
m
m
N
(1)where 1
1
(
)
i N ii i j
j i
m m
N
is the mean ofeach class of samples in the space
F
andw
S
characterizes the degree of aggregationof internal samples in each class. While the between-class scatter matrix of samples in the
space
F
is defined by:0 0 1
1
(
)(
)
c Tb i i i
i
S
N m
m
m
m
N
(2)where 0 0
1 1
1
1
(
)
N c
j i i
j i
m
m
N m
N
N
is the mean of all the samples in the space
F
and
S
b characterizes the degree of dispersion among the different classes.In the space
F
, FLDA looks for the projection directionw
to make the samples of different classes separated as far as possible, whilst and the samples in the same class are gathered as close as possible. This goal can bewritten as:
max
( )
Tb T
w w
w S w
J
w
w S w
(3) is termed the so-called Rayleigh quotient
[22].
The derivation above is the Fisher‟s criterion in the high-dimensional feature space. In order to derive KFDA, based on reproducing kernel theory,
w
can be expanded as:1
N j j j
w
(4)where
j is the coefficient. With (4), (3) can be changed tomax ( )
T b T a wK
J
K
(5)where
[
1,
2,
N]
T is the KFDA vector in the spaceF
;1
1
(
)
c
T
w i i
i
K
K I
K
N
i
1
N
, whereI
isan
N
i
N
i identity matrix, i1
N
is ani
i
N
N
matrix with each entry equal toi
N
1
,
K
i
[
k
(
x
j,
x
ij)]
is anN
N
imatrix with the introduced kernel function
)
,
(
k
[23];0 0 1
1
(
)(
)
c Tb i i i
i
K
N G
G
G
G
N
, where1 1 1
1
1
( ,
),
,
(
,
)
i i T N N i ii j N j
j j
i i
G
k x x
k x x
N
N
, 0 1 1 11
1
( ,
),
,
(
,
)
T N Nj N j
j j
G
k x x
k x x
N
N
. IfLagrange multipliers are introduced, the calculation of
can be solved simply by finding thec
1
most significanteigenvectors of
K
w1K
b in the following form: 1 w bK K
(6)For every input sample
x
, the features extracted by KFDA is actually the projectionof
( )
x
in the optimal directionw
. Thus, each dimensional element of the features is1
( )
(
, )
N i
i i j j
j
z
w
x
k x x
(7)where
ij is thej
th
element of thei
th
significant eigenvector of
K
w1K
b . The feature, which is extracted by KFDA,1 2 1
[ ,
,
,
c]
Tz
z z
z
is anc
1
-dimensional vector. Compared with the
whole image, KFDA reduces the dimensions significantly. The derivation in this section shows that the nonlinear feature extraction criterion KFDA actually calculates the Fisher
discriminant in the high-dimensional feature space using the kernel method.
When the radial basis function (RBF)
2
2
( , )
exp(
)
2
x
y
k x y
is selected as thekernel function
k x y
( , )
, asx
andy
aretwo images not common vectors in target
the spatial relationships among the pixels so it
is extremely sensitive even to small deformations. To tackle this disadvantage, we embed IMED in KFDA [24]. IMED can reflect the correlation among the image
samples better since it is invariant to the linear transformation of the images, and depends on the extent of the deformation.
Let
P
1
(
P P
11,
12,
,
P
1n)
and1 2
2
(
2,
2,
,
2)
n
P
P P
P
denote twoH
byL
images, where
H L
n
. The element( ,
1, 2,
, )
ijg i j
n
of the image metricmatrix
G
n n reflects the relationship ofposition between pixel
P
i and pixelP
j. Assuming the location ofP
i is( , )
h l
andthe location of
P
j is( ', ')
h l
,g
ij can be written as:2
1
exp{
/ 2}
2
i j ij
g
P
P
(8)where
P
i
P
j
(
k
k
')
2
(
l
l
')
2 .Thus, IMED between
P
1 andP
2 is:2
, 1
1 2 1 2
1 2 1 2
1
exp{
/ 2}
2
(
)(
)
(
)
(
)
n i j i ji j j i
T
IMED
P
P
P
P
P
P
P
P
G P
P
(9)Then the calculation of RBF with IMED is:
1 2
1 2 1 2
2
2
( ,
)
1
exp[
(
)
(
)]
2
1
exp(
)
2
T
k P P
P
P
G P
P
IMED
(10)For large images, the evaluation of
G
is expensive. The standardizing transform (ST) [24] or Kronecker product [25] can be introduced to simplify the calculations.
In the above derivation, the process of
calculating Rayleigh quotient and extracting the features were based on the assumption that
the within-class scatter matrix
K
w is a nonsingular matrix. However, according toFisher‟s criterion,
K
w is a nonsingular matrix only if the number of training samples is greater than the dimension of sample space.Otherwise
K
w is a singular matrix and thus the inverse does not exist. To avoid suchill-conditioned settings,
K
w can be repalcedby
K
w
K
w
I
.
HereI
is an identity matrix of the same order ofK
w, and the constant
which acts as a disturbance, is small and greater than zero. The properties ofw w
K
K
I
will be dominated by
if
is too large, which means the degree ofaggregation of the internal samples in each class is restricted. This will make the feature eigenvector
disturbed, and the features of each class relatively dispersed, and therecognition rate gets reduced.
is often setto be
10
3.
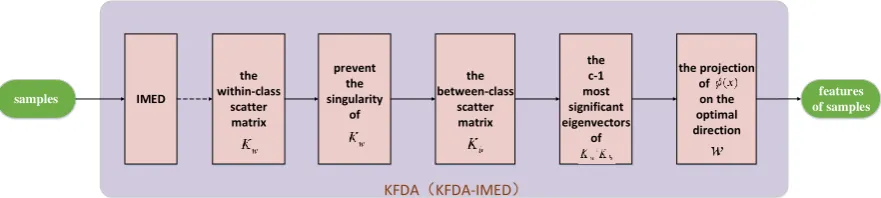
IMED of samplesfeatures
KFDA(KFDA-IMED) the
within-class scatter matrix
prevent the singularity
of
the between-class
scatter matrix
the projection of
on the optimal direction the
c-1 most significant eigenvectors
[image:8.595.93.534.96.195.2]of samples
Fig. 1 Flow-chart of KFDA and improved KFDA-IMED
3.
Algorithm Description
3.1
Vehicle Detection
The SAR vehicle detection algorithm proposed in this paper introduces KFDA to
extract the discriminative features of the vehicle and its surrounding environment and calculates the difference between features to determine its existence. An edge preserving
smoothing operation and grey scale quantization [2] are performed on the original SAR image in order to reduce the impact of speckle noise while preserving the boundary
edges of a vehicle.
In general, a target has stronger scattering properties than its surrounding area while the target pixels are only a tiny part of the whole
SAR image. Therefore we can choose an appropriate global threshold to achieve image binarization and determine possible target pixels so we do not need to carry out traversal
search for the overall image. When the vehicle stays adjacent to trees for hiding, another
advantage for the global threshold operation is that it can separate the pixels of trees and the pixels of vehicles. For the case of trees, there are many gaps between leaves, and part of the
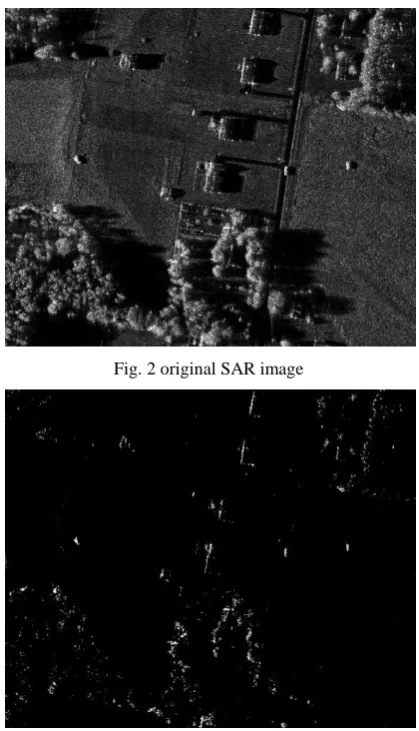
electromagnetic waves will be reflected directly by trees while some will be reflected by the ground. From Fig. 2 we can see that trees show a mixture of bright spots and dark
spots. Fig. 3 shows the results of performing the edge preserving smoothing operation, grey scale quantization and the global threshold operation. It is obvious that the trees are
separated into discrete points by the global threshold so that it is conducive to detect vehicles around the trees. However in Fig. 3, some bright spots can still be found, which are
similar to the vehicles and produced by trees. False alarms may be caused by these bright spots. In subsequent processing, we will try to eliminate these kinds of bright spots through
Fig. 2 original SAR image
Fig. 3 SAR image after the global threshold operation
After the global threshold operation, two obvious problems still confront us. First, there are still a great number of discrete non-target
points in the image. Second, some dark points of the vehicles are excluded. Morphological filtering can be used to eliminate those discrete and small points and make the target
region more homogeneous, whilst preserving its edge information [26].
All the left bright spots in the binary image can belong to the vehicles, which need
to be examined one by one. Before this, we perform image segmentation with connected component analysis, wherein each bright spot is assigned an index number and the
coordinate of each bright spot pixel is recorded. This way, traversing all the pixels in the subsequent detection process is not needed.
Until now, the number of bright spots in the binary image may still be large. While some obvious non-target spots can be simply excluded on the basis of their size or shape.
For example, a long and thin bright spot can be ignored directly because its shape does not match the shape of a vehicle.
Next, the KFDA is operated with the
shape of vehicles. The shape of the protecting
window and the outer-window is the same as the inner-window. The protecting window is slightly larger than the inner-window whilst still smaller than the outer-window. Finally,
the number of pixels in the outer-window is the same as in the inner-window. The
dual-window approach used in this paper is
shown in Fig. 4. The center of the dual-window can be located in each bright spot‟s geometric center, which is calculated with the coordinates of pixels of each bright
spot in the original SAR image, using the index number.
protecting window
[image:10.595.96.494.218.439.2]inner-window
outer-window
Fig. 4 The form of dual-window
In detection, we make the current
inner-window move to different directions in the protecting window to get a series of inner-window samples, which are termed the inner-window sample set. Meanwhile, the
current outer-window is moved to the same directions as the inner-window to get a series of outer-window samples termed the outer-window sample set. Since the
outer-window has a certain width, some part of the target pixels may also be covered. Therefore, we set the number of leaked pixels to be D, which means that the D brightest
pixels in each outer-window sample and the D darkest pixels in each inner-window sample will be eliminated. The value of D can be determined based on the width of the
outer-window.
The complex diversity of the SAR image
makes it necessary to normalize the amplitude of each inner-window sample and each outer-window sample. The normalization formula is given by:
2
Normalized
x
x
x
(11)where
x
is the vector representation of eachsample; and
x
Normalized the vectorrepresentation of the normalized
x
.Let
X
1 denote the normalizedinner-window sample set and
X
2 thenormalized outer-window sample set. The
and the feature of current outer-window
sample
z
o are extracted with KFDA throughequations (1-7). Both
z
i andz
o are onedimensional. The detection is achieved by
comparing the difference between
z
i ando
z
with a threshold as follows:1
0
H i o
H
z
z
T
(12)where
H
1 implies that the currentinner-window sample is a vehicle;
H
0implies the current inner-window sample is
clutter; and
T
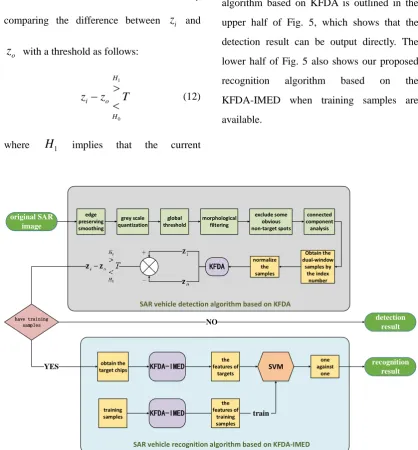
is the threshold.The above SAR vehicle detection algorithm based on KFDA is outlined in the upper half of Fig. 5, which shows that the detection result can be output directly. The
lower half of Fig. 5 also shows our proposed recognition algorithm based on the KFDA-IMED when training samples are available.
original SAR image
detection result
have training samples
recognition result
edge preserving smoothing
global threshold
morphological filtering
connected component analysis exclude some
obvious non-target spots grey scale
quantization
SAR vehicle detection algorithm based on KFDA
Obtain the dual-window
samples by the index
number
KFDA
SAR vehicle recognition algorithm based on KFDA-IMED YES target chipsobtain the KFDA-IMED SVM
training
samples KFDA-IMED
the features of
targets NO
train
one against
one normalize
the samples
the features of
training samples
+
-Fig. 5 Flow-chart of SAR vehicle detection and recognition algorithm based on KFDA
3.2
Vehicle Recognition
After the detection stage, the types of
1
H
image samples can be recognized if wehave the same types of vehicles in our training
sample database. In this case, firstly, the
H
1image chips are collected from the original
SAR image. Second, the amplitude of each
[image:11.595.86.505.169.620.2]should be normalized with (11). Third, the
features of training samples and
H
1 imagechips are extracted with the KFDA-IMED
through (1-10). The features of each training
sample or each
H
1 image chip can berepresented as a
c
1
dimensional vector. In this paper, the well-known SVM is chosen for features classification. The reasons are two-fold: firstly, SVM is based on thestructural risk minimization basis so ensures theoretical generalization; secondly, the SVM has advantages in solving small sample size
and nonlinear problems and is relatively insensitive to the representation of features. SVM is trained with the features of training
samples. The recognition of
H
1 image chipsis executed according to the “one-against-one” multiclass strategy.
In the following step, we address a problem when false alarms in the detection may be incorrectly recognized as one type of vehicle. For this case, some environmental
samples can be collected before recognition in certain areas which are around yet do not
cover the
H
1 image chips. We hope thisapproach can make the false alarms recognizable as environment samples and thus be removed. However, this operation also
raises another problem. If the undetected targets are collected as environment samples, the credibility of the recognition results is seriously affected. Hence, it is necessary to set
the threshold
T
lower to guarantee theabsence or the presence of only few
undetected targets before the environment samples collection step.
In much of the literature [15, 16, 26, 27], researchers have performed some
pre-processing operations for enhancing recognition, such as log transformation, Fourier transform, image segmentation, power-law transformation, image filtering and
so on, and consequently obtained a high recognition rate. In this paper, however, after
obtaining
H
1 image chips from the originalSAR image, only the simple normalization operation is applied. The main reasons can be summarized as follows: first, we believe the
KFDA-IMED demonstrates a consistently high efficiency in terms of feature extraction and can reduce the requirements for image preprocessing; second, these complex
pre-processing operations do not lead to a definitively higher recognition rate for our KFDA-IMED. Specifically, our experience has shown that not every pre-processing
operation has a positive effect on the recognition rate for different feature extractions. For the case of our proposed KFDA-IMED method, the recognition rate
was not found to be improved by any of the other pre-processing operations reported in the literature.
4.
Experiments
In this experiment, spotlight SAR images
of ground vehicles in the moving and stationary target acquisition and recognition (MSTAR) database [28] is used. The database provides many different types of vehicle
samples which can be used for quantitatively analyzing the training process and recognition results of the algorithm proposed in this paper. The original size of SAR vehicle sample is
128
128 pixels. The resolution is0.3
m
0.3
m
. The azimuth coverage of eachtype of the vehicle is
0 ~ 360
and theinterval is approximately
1
. We choose three distinct types of these in the database, namely: three BMP2 s (sn-c21, sn-9563, sn-9566), oneBTR70 (sn-c71) and three T72 s (sn-132, sn-812, sn-s7). The different serials in the same type are mainly because of the configuration variants [29], which are termed
as variant targets.
The training set includes three training sample sets (BMP2sn-c21, BTR70sn-c71 and
T72sn-132) at
17
depression angle. The number of samples in each training set is 232.The testing set includes all 7 serials at
15
depression angle. BMP2sn-c21, BTR70sn-c71
and T72sn-132 are the same serial targets while BMP2sn-9563, BMP2sn-9566, T72sn-812 and T72sn-s7 are the variant targets. The number of samples in each testing
set is 191.
Five recognition algorithms are compared in this experiment: SVM,
KPCA+SVM, KPCA+FLDA+SVM,
KFDA+SVM, KFDA-IMED+SVM. The kernel functions in KPCA and KFDA are selected as the easier-to-control polynomial
function
k x y
( , ) (
x y
1)
l, where
l
5
.
The kernel function in KFDA-IMED is selected as the improved RBF2
(
)
(
)
( , )
exp(
)
2
Tx
y G x
y
k x y
, where
is the mean of IMED of all the trainingsamples. The constant
is10
4 . The kernel function in SVM is selected as the RBF2
( , )
exp( 0.6 ||
|| )
k x y
x y
. The [image:13.595.142.489.631.766.2]obtained recognition rates are listed in Table 1.
Table 1. Recognition rates of five different algorithms
algorithm same serial targets variant targets
SVM 98.08% 88.09%
KPCA+SVM 99.30% 85.86%
KPCA+FLDA+SVM 99.47% 89.92%
KFDA+SVM 99.47% 90.45%
KFDA-IMED+SVM 99.65% 91.49%
produces good results, which demonstrates
that the SVM can effectively overcome the SAR image aspect angle sensitivity problem and is suitable for SAR image processing. However, the number of normalized sample
dimensions is 16384 (128
128), which contains a lot of redundant information and leads to computational complexity problems. If the KPCA is used to extract features, thenumber of dimensions can be effectively reduced from 16384 to 696. The KPCA approach facilitates calculations and its recognition rate of identical serial targets
increases, while the rate of variant targets falls. This demonstrates that the KPCA is not efficient in extracting discriminative features of variant targets. For the case of
KPCA+FLDA+SVM, the recognition rates of same serial targets and variant targets are both better than the KPCA+SVM and SVM methods. Meanwhile, the number of sample
dimensions is compressed into two, which
demonstrates that the introduction of the FLDA can improve the ability to extract discriminative features. For KFDA+SVM, both rates are higher than 90%. Introducing
IMED on this basis, the recognition results are further improved, which proves the effectiveness of considering the spatial relationships among pixels. The KFDA-IMED
features of BMP2sn-9563 and the training set are shown in Fig. 6. The features of three training sample sets (BMP2sn-c21, BTR70sn-c71 and T72sn-132) are separated
well and the features of BMP2sn-9563 are also gathered well around BMP2sn-c21. Fig. 6 demonstrates that the features can be extracted by KFDA-IMED robustly. In addition, the
[image:14.595.200.393.510.665.2]kernel parameters for KFDA-IMED can be calculated with the samples, which demonstrates its superior adaptability.
Fig. 6 The KFDA-IMED features of BMP2sn-9563 and the training set
The vehicles may appear in a range of
vehicles in different sizes are recognized with
the KFDA-IMED+SVM approach.
The recognition results are listed in Table
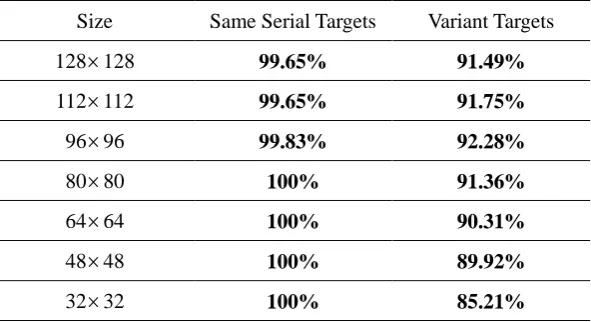
[image:15.595.151.447.150.311.2]2.
Table 2. Recognition results of vehicles in different size
Size Same Serial Targets Variant Targets
128
128 99.65% 91.49%112
112 99.65% 91.75%96
96 99.83% 92.28%80
80 100% 91.36%64
64 100% 90.31%48
48 100% 89.92%32
32 100% 85.21%It can be seen from Table 2 that, for same serial targets, reducing the size of the image
chip can lead to a gradual increase in the recognition rate. For the case of variant targets, reducing the size of the image chip can make the recognition rate gradually increase at first
before starting to fall. The turning point or threshold appears to be the image chip size 96
96. For a more detailed analysis of the experimental data, we show T72sn-812 inthree different sizes (128
128, 96
96, 32
32) in Fig. 7. We can see that the pixels of both the target and the shadow are completely preserved if the image size is larger than 96
96. When the image size is smaller than 96
96, the shadow information is lost. When the image size is reduced to 32
32, a small part of the target pixels are lost as well. Fig. 7combined with Table 2, shows that for the same serial targets, when the vehicles
themselves have no difference, only relying on the target pixels leads to good recognition
results. If most of the target pixels are contained in the image chip, the size change has little effect on the recognition rate but too many background clutter pixels are likely to
cause interference. When the target pixels and shadow pixels are all contained in the image chip, reducing the background clutter pixels will improve the recognition rate for the
variant targets. When the shadow information is lost gradually, the recognition rate begins to decrease. Our experimental results demonstrate that important discriminative
information is contained in shadow pixels, which can help recognize variant targets. Further, in order to avoid excessive interference, the irrelevant background clutter
Fig. 7 T72sn-812 image chip in three different sizes
4.2
Vehicle Detection and Recognition
Experiment
In this experiment, nine vehicle chips (at
15
depression angle) are inserted into a1478
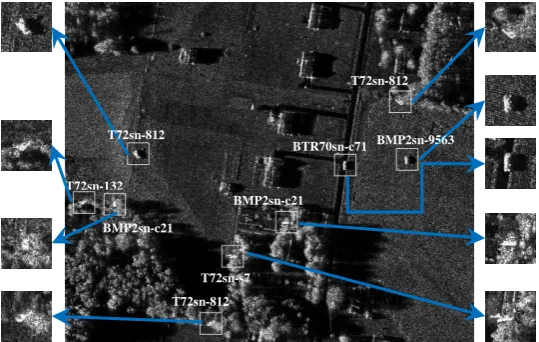
1784 full clutter MSTAR SAR image [5]. Fig. 8 shows the image with nine vehicles.White frames are used to indicate the locations of vehicles and serial numbers of the nine vehicles, one of which is seen on the road, two
on grass and the other six in groves.
Fig. 8 The MSTAR SAR image with nine vehicles
Our proposed KFDA algorithm is
compared with the classic CFAR algorithm for vehicle detection. In our method, the selection of the shape and size of the sliding window is mainly based on the general shape and size of
vehicles. According to the analysis of Fig. 7, the size of inner-window is set at 48
48. In order to make the number of pixels in the outer-window same as the inner-window, weset the size of the protecting window at 55
55 and the size of the outer-window at 73
73. Asfor the kernel function, we choose the easier-to-control polynomial function
( , ) (
1)
lk x y
x y
, wherel
5
. Theconstant
is10
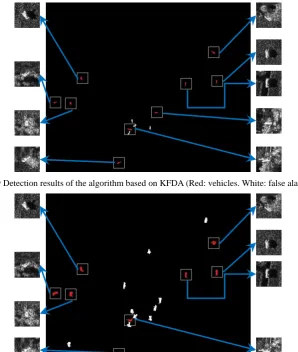
4. The detection result is shown in Fig. 9. The nine vehicles are all detected (shown in red) and the number of false alarms is 4 (shown in white). For CFAR,(a) 128 128
(b) 96 96
(c) 32 32
T72sn-132
T72sn-812 BMP2sn-c21
T72sn-s7 BMP2sn-c21
BTR70sn-c71 T72sn-812
[image:16.595.163.433.380.551.2]the detection result is shown in Fig. 10. Eight
vehicles are detected (shown in red) and the number of false alarms is 10 (shown in white). Since CFAR mainly considers the contrast feature and ignores geometric information and
features of vehicles, it is possible to generate many false alarms in a complicated environment. It is also hard to detect shaded vehicles because of the weak contrast.
However, our KFDA algorithm considers the
geometric information, features of vehicles as well as the difference between features of vehicles and their surrounding environment and does not need to face the challenges of
[image:17.595.149.448.265.618.2]selection and extraction of the features. It has a better description and understanding of the vehicles and can produce a higher detection rate and lower false alarm rate.
[image:17.595.163.433.268.435.2]Fig. 9 Detection results of the algorithm based on KFDA (Red: vehicles. White: false alarms.)
Fig. 10 Detection results of CFAR (Red: vehicles. White: false alarms.)
After detection, the geometric center of
each target is locked again to collect the 48
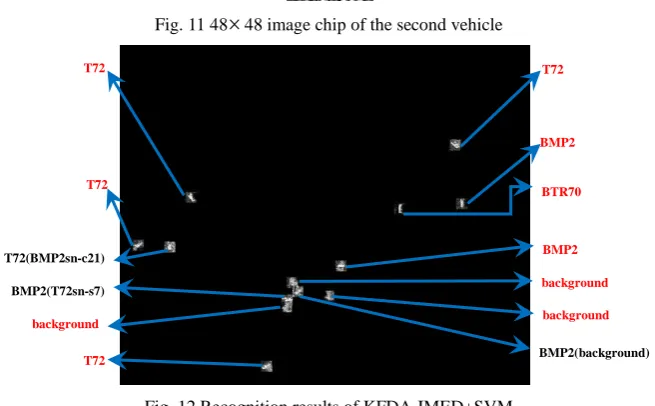
48 image chips. The image chip of the second vehicle is shown in Fig. 11. It is obvious that a lot of pixels of trees are mixed in the imagechip. It may lead to a substantial interference with the recognition. According to the analysis
results are shown in Fig. 12 for the detected
targets. „Red‟ represents correct recognition results and „black‟ represents wrong results. Their correct serial numbers are indicated in parentheses. 7 vehicles are correctly
recognized and the recognition rate is 77.78%. For the 4 false alarms, recognition results from left to right are: BTR70, BMP2, BMP2 and BTR70. As mentioned about, some
environment samples in certain areas can be
collected, which are around yet do not cover
the
H
1 image chips. The 4 false alarms noware recognized as background, background,
BMP2 and background respectively. Meanwhile, the recognition results of the 9 vehicles remain unchanged. This process illustrates that the recognition algorithm can
[image:18.595.133.461.331.534.2]help eliminate 3 false alarms.
Fig. 11 48
48 image chip of the second vehicleFig. 12 Recognition results of KFDA-IMED+SVM
(„red‟ represents the correct recognition results and „black‟ represents the wrong recognition results whose correct
serial numbers are indicated in parentheses.)
There are two main reasons why the recognition rate in this experiment is lower
than that in experiment 4.1. First, part of the target pixels and shadow information are lost as reducing the size of image chips, which may result in a lower recognition rate. Second,
because most vehicles are in the groves, they are partially shaded by trees. This dramatically
changes and masks the pixels of vehicles and their shadows, which increases the difficulties of accurate recognition. For the 3 clearly
exposed targets, the recognition results are all seen to be correct. These experimental results conform to our theoretical analysis.
5.
Conclusions
Target detection and recognition are key
T72
T72(BMP2sn-c21)
T72 BMP2(T72sn-s7)
BMP2 BTR70
T72 T72
BMP2
background
background
background
issues in SAR image applications. By
analyzing the mathematical principles of KFDA and relevant features of vehicles, we proposed a vehicle detection method based on KFDA and a vehicle recognition method
based on the improved KFDA-IMED. Experimental results with the MSTAR database demonstrate: First, our detection method does not need any prior information
and avoids the difficulty of selecting features and extracting advanced features, which proves the advantages of introducing KFDA into detection. Second, our method performs
better than the traditional CFAR algorithm when vehicles are shaded in a complicated environment. Third, KFDA-IMED+SVM is an ideal SAR image feature extraction and
recognition algorithm. Although the vehicles include variations in aspect angle, target configurations and obscuration and the clutter interference is excessive, KFDA-IMED+SVM
does not need image preprocessing and image segmentation and can lead to a higher recognition rate than conventional methods. Fourth, the detection and recognition are
achieved by the same criterion. In addition, collecting background clutter samples in the recognition part can help reduce the false alarms in the detection part. In this paper, a
detailed discussion is also presented on the influence of size of image chip on the recognition rate. In general, the simplicity, innovation and the significant effect of our
vehicle detection and recognition algorithm based on KFDA meets the requirements of
SAR ATR. It is concluded to be a highly
efficient vehicle detection and recognition algorithm for SAR images.
Acknowledgments
This research is supported by the National Natural Science Foundation of China,
No. 61071139, No. 61471019 and No. 61171122, the Aeronautical Science Foundation of China, No. 20142051022, the Foundation of ATR Key Lab, the Fundamental
Research Funds for the Central Universities, “New Star in Blue Sky” Program Foundation
of Beihang University, the Royal Society of Edinburgh (RSE), and The National Natural
Science Foundation of China (NNSFC) under the RSE-NNSFC joint project (2012-2014) [grant number 61211130210] with Beihang University. This research is also funded, in
part, by the RSE-NNSFC joint project (2012-2014) [grant number 61211130309] with Anhui University, China; and the “Sino-UK Higher Education Research Partnership for PhD Studies” joint-project
(2013-2015) funded by the British Council China and The China Scholarship Council (CSC).
References
1. Novak, L.M., M.C. Burl, and W.W.
Irving. Optimal polarimetric processing
for enhanced target detection. IEEE
Trans. on Aerospace and Electronic
Systems, 1993, 29(1): 234-244.
2. Wang, D. Knowledge based object
International Conference on ICASSP
'87, in Acoustics, Speech, and Signal
Processing, 1987.
3. Blacknell, D.. Contextual information
in SAR target detection. IEE Proc. of
Radar, Sonar and Navigation, 2001,
148(1): 41-47.
4. Irving, W.W., L.M. Novak, and A.S.
Willsky. A multiresolution approach to
discrimination in SAR imagery. IEEE
Trans. on Aerospace and Electronic
Systems, 1997, 33(4): 1157-1169.
5. Lombardo, P., M. Sciotti, and L.M.
Kaplan. SAR prescreening using both
target and shadow information. Proc. of
the IEEE Radar Conference, 2001.
6. Liu, S. and Z. Cao. SAR image target
detection in complex environments
based on improved visual attention
algorithm. EURASIP Journal on
Wireless Communications and
Networking, 2014(1): 1-8.
7. Bhanu, B.. Automatic Target
Recognition: State of the Art Survey.
IEEE Trans. on Aerospace and
Electronic Systems, 1986, AES-22(4):
364-379.
8. Bhanu, B. and T.L. Jones. Image
understanding research for automatic
target recognition. IEEE Aerospace and
Electronic Systems Magazine, 1993,
8(10): 15-23.
9. Bhanu, B., et al.. Guest Editorial
Introduction To The Special Issue On
Automatic Target Detection And
Recognition. IEEE Trans. on Image
Processing, 1997, 6(1): 1-6.
10. Ross, T.D., et al. Standard SAR ATR
evaluation experiments using the
MSTAR public release data set.
International Society for Optics and
Photonics in Aerospace/Defense
Sensing and Controls, 1998.
11. Hurst, M. and R. Mittra. Scattering
center analysis via Prony's method.
IEEE Trans. on Antennas and
Propagation, 1987, 35(8): 986-988.
12. Potter, L.C. and R.L. Moses. Attributed
scattering centers for SAR ATR. IEEE
Trans. on Image Processing, 1997, 6(1):
79-91.
13. Ross, T.D., et al. SAR ATR: so what's
the problem? An MSTAR perspective,
1999.
14. Lin, Y. and B. Bhanu. Evolutionary
feature synthesis for object recognition.
IEEE Trans. on Systems, Man, and
Cybernetics, Part C: Applications and
Reviews, 2005, 35(2): 156-171.
15. XiaoGuang, L., H. Ping, and W.
Renbiao. Two-dimensional PCA for
SAR automatic target recognition. 1st
Asian and Pacific Conference in
Synthetic Aperture Radar, 2007.
16. Han, P., et al.. SAR automatic target
recognition based on KPCA criterion.
Journal of electronics and information
technology, 2003, 25(10): 1297-1301.
17. Seung, H.S. and D.D. Lee. The
manifold ways of perception. Science,
2000, 290(5500): 2268-2269.
18. Bryant, M.L. and F.D. Garber. SVM
classifier applied to the MSTAR public
data set. International Society for
Optics and Photonics in AeroSense'99,
1999.
19. Qun, Z. and J.C. Principe. Support
vector machines for SAR automatic
target recognition. IEEE Trans. on
Aerospace and Electronic Systems,
2001, 37(2): 643-654.
20. Sun, Y., et al. Synthetic aperture radar
automatic target recognition using
adaptive boosting. International Society
for Optics and Photonics in Defense
and Security, 2005.
21. Dacheng, T., et al.. Geometric Mean for
Pattern Analysis and Machine
Intelligence, 2009, 31(2): 260-274.
22. Camps-Valls, G. and L. Bruzzone.
Kernel methods for remote sensing data
analysis. Wiley Online Library, 2009:
Vol. 26.
23. Vapnik, V.. The nature of statistical
learning theory. New York: Springer,
2000.
24. Liwei, W., Z. Yan, and F. Jufu. On the
Euclidean distance of images. IEEE
Trans. on Pattern Analysis and
Machine Intelligence, 2005, 27(8):
1334-1339.
25. Brewer, J.. Kronecker products and
matrix calculus in system theory. IEEE
Trans. on Circuits and Systems, 1978,
25(9): 772-781.
26. Liping Hu. Investigation on Target
Recognition from SAR Images. XiAn,
China: Xidian University, 2009.
27. Amoon, M. and G.A. Rezai-rad.
Automatic target recognition of
synthetic aperture radar (SAR) images
based on optimal selection of Zernike
moments features. IET Computer Vision,
2014, 8(2): 77-85.
28. Srinivas, U., V. Monga, and R.G. Raj.
SAR Automatic Target Recognition
Using Discriminative Graphical Models.
IEEE Trans. on Aerospace and
Electronic Systems, 2014, 50(1):
591-606.
29. Douville, P.L.. Measured and predicted
synthetic aperture radar target
comparison. IEEE Trans. on Aerospace
and Electronic Systems, 2002, 38(1):
25-37.
Biographies
Fei Gao was born in 1975. He received his Ph.D. degree in signals and information
processing from Beihang University in 2005. He is currently an associate professor in School of Electronic and Information Engineering, Beihang University. His research interests include radar signal processing, image processing, moving target detection, etc. (E-mail: [email protected])
Jingyuan Mei was born in 1990. He received his B.E. degree in Information Engineering School from Communication University of China. He is currently a master in School of Electronics and Information Engineering, Beihang University. His research interests include radar signal processing, image processing, target detection, target recognition, online learning, etc.
(E-mail: [email protected])
Jinping Sun was born in 1975. He received his Ph.D. degree in signals and information processing from Beihang University in 2001. He is currently a professor of School of Electronic and Information Engineering of Beihang University. His research interests include high resolution and advance mode SAR signal processing, image understanding and pattern recognize.
(E-mail: sunjinping@ buaa. edu. cn)
DSP/FPGA real-time architecture, target recognition and tracking, etc.
(E-mail:wangj203@ buaa. edu. cn)
Erfu Yang received the B.E., M.E., and Ph.D. degrees from Beihang University in 1994, 1996, and 1999, respectively. He is currently a lecturer post in University of Strathclyde. His research interests include signal processing and cognitive signal-image.
(E-mail:[email protected])
Amir Hussain obtained his B.Eng. (with 1st Class Honors) and Ph.D., both in electronic and electrical engineering from the University of Strathclyde in Glasgow, Scotland, in 1992 and 1996, respectively. He is currently a Professor in School of Natural Sciences, University of Stirling and founding Director of the Cognitive Signal-Image and Control Processing Research (COSIPRA) Laboratory. His research interests are mainly interdisciplinary, and include machine learning and cognitive computing for modeling and control of complex systems.
(E-mail:[email protected])
第一作者姓名:高飞
主要研究方向:雷达信号处理、图像处理、目标检 测系统、目标跟踪与识别
职称:副教授 学历:博士
手机:13681444428 固话:01082317240 E-mail:[email protected]
地址:北航 203 教研室 邮编:100191
第二作者姓名:梅净缘
主要研究方向:雷达信号处理、图像处理、目标检 测与识别、在线学习
职称:无 学历:硕士 手机:13581861319 固话:01082317240
E-mail:[email protected]
地址:北航 203 教研室 邮编:100191
第三作者姓名:孙进平
主要研究方向:信号处理、图像感知、模式识别
职称:教授 学历:博士
手机:13501097201 固话:01082317240
E-mail:[email protected]
地址:北航 203 教研室 邮编:100191
第四作者姓名:王俊
主要研究方向:信号处理、 DSP/FPGA实时
职称:教授 学历:博士
手机:13541831972 固话:01082319474 E-mail:[email protected]
地址:北航 203 教研室 邮编:100191
第五作者姓名:杨尔辅
主要研究方向:信号处理、图像认知 职称: 学历:博士
手机: 固话:+44 (0) 141 548 2919/4294
E-mail:[email protected]
地址:斯克莱德大学 邮编:Glasgow G1 1XJ, UK
第六作者姓名:Amir Hussain
主要研究方向:信号处理、图像认知 职称:教授 学历:博士
手机: 固话:+441786467421 E-mail:[email protected]