METHODS AND PRINCIPLES OF ANALYSIS
FOR TRACE ORGANICS IN WATER
BY
MICHAEL G. JOHNSON, B.App.Sc.
Being a Reading Thesis submitted as partial fulfilment of the requirements
for the degree of MASTER OF SCIENCE UNIVERSITY OF TASMANIA
CONTENTS
Page
INTRODUCTION 1
CONCENTRATION TECHNIQUES
. 1) Liquid-Liquid Extraction .2) Adsorption on Solids
.3)
Headspce.4) Distillation Chapt ,ar
1
2
9
19
.26
.5)
Membrane Separations.6) Other
TechniquesSEPARATION TECHNIQUES 27 .1) Gas Chromatography 27 . 2) High Performance •Liquid
Chromatography 31
4
IDENTIFICATION TECHNIQUES34
.1)
Mass Spectrometry34
.2) Infrared Spectroscopy38
5
CONCLUSIONS 14.21 INTRODUCTION
The development of methods of analysis for trace organics in water was severely hampered until the introduction, in 1950, by Braus, Middleton and Walton l of 'a large scale sampling system which allowed
systematic separation and identification of organic water pollutants. The sampling and concentration techniques available prior to this development re-stricted the analyst to the use of crude collective parameters, such as biological oxygen demand and total organic carbon or a few methods for specific organic substances such as oil, grease, phenol and
furfural, for the measurement of organic water pollut-ants. 2
The methods and instruments available for organic analysis became useful in the analysis of
organic water pollutants with the introduction of this method. The development in the methods of analysis for trace organics since that time has been closely linked to the development of improved concentration techniques and the rapid development of gas chromatography as a separation technique.
The rapid development in this area is shown by the fact that prior to 1970 only about 100 different organic compounds had been identified in water.
2. 2 CONCENTRATION TECHNIQUES
The trace organic compounds present in a
water sample must, in almost every case, be concentrated before analysis. There are several reasons for sample preconcentration. In addition to the low concentration of the compounds present it is also necessary to use instrumental methods of analysis in which only very
small volumes, usually in the low microlitre (uL) range, can be used. Many different processes have been used for this purpose of which liquid extraction, liquid-solid adsorption, gas phase stripping and distillation are the most important. To date no method has been
developed that is suitable for the full range of organic contaminants found in water samples. A combination of concentration methods needs to be applied when samples that contain a wide range of substances are to be
analysed.
2.1 LIQUID-LIQUID EXTRACTION
Introduction
The simplest and, until recently, most
3.
from water.
Principle of the method
Theory:- Solvent extraction is based on the selective distribution of a solute or solutes in two essentially immiscible solbents. The distribution of a component A between the immiscible phases can be considered in terms of the distribution law. At
equlibriUm the ratio of the concentrations of the
solute in the two phases is given by the distribution constant K.
K total concentration of A in organic phase total concentration of A in aqueous phase The distribution of a compound between the two phases is determined by the various attraction and repulsion forces between the solvent and solute. The extraction
efficiency depends not only on the distribution constant but also on the volumes of the phases and the number of extractions carried out. It is usual to use a series of extractions. since one extraction with a given volume of solvent is less efficient than two extractions using half the solvent volume each time. However, when the distribution constant is large, multiple extractions are usually not required.
Batch Extraction:- Simple one step liquid-liquid extraction using various solvents such as
5-
methylcyclohexane 3 and benzene/hexane 10 have been
- described for the concentration of organic solutes from water. A given volume of sample solution is allowed to remain in contact with a given volume of the solvent until eoulibrium is obtained. The two layers are then separated.
The method has been applied for extreme trace levels 13 ' 14 when specific detection, eg. electron capture
for halogenated hydrocarbons, is available. The
sensitivity becomes much poorer when the sample is to be analysed for a wide range of organic compounds due to the fact that the extract must be concentrated by a
factor of up to 50,000 before analysis k . The extract consists not only of the substances extracted from the water but also of the abundant impurities contained in the concentrated solvent. The accumulation of solvent impurities as well as severe losses of the more volatile extracted substances during concentration often render the procedure impractical.
Grob et. al. 4 and Murray15 among others have described methods that to some extent overcome this problem. These methods are based on shaking a large amount (1L) of water with a,small amount (200AL) of
solvent and subsequent high resolution gas chromatographic analysis of the extract without need of further
concentration. Using these methods solvent bjr-
5.
level has been obtained. The use of such small quantities of solvent however, limits the analyst to the use of
solvents that have low solubilities in water. The solubilities in water of carbon tetrachloride, carbon
disulphide, methylene chloride and diethyl ether for instance prohibits these solvents from use in these methods.4
Continuous Liouid-Liquid Extraction:- Werner et.al . 16 first used continuous liquid-liquid extractors for
concentrating and isolating trace amounts of organic substances from water. Continuous liquid extraction overcomes two of the limiting factors in solvent extract-ion. The saturation capacity of the solvent is eliminated by continuously providing fresh solvent and the volume of water available for extraction is not limited as in batch extraction.
In continuous extraction unlike batch extraction the mixing separation and solvent recovery operations are performed in a flowing system. There are three different
flow types: countercurrent, crosscurrent and concurrent operations.
Countercurrent Extraction:- The term counter-current is used to refer to two streams flowing in
opposite directions with both phases continually renewed. The types of apparatus used are often based on
mixer-settler 17 or column1 -618 operation with large contact surface areas between the two phases. A typical
A - sample inlet B - sample outlet C - solvent chamber D - reflux condensor E - porous frit.
A
Feed ••■•■.10,
Figure 2. 'Schematic .diagram of
cross-current .extraction. The vertica :arrows indicate - introduction • of fresh solvent.' •
etc. in Figure 1 19 .
_
Figure -1. Cou
nt
ercurrent Extractor 'design for solvent lighterthan water
A concentration factor of up to 10 5 has been obtained with this apparatus.
7.
Anhoff and Josefsson21,22 described a continuous liquid-liquid extractor based on this principle.. The ex-traotion efficiency ranged between 83-96% for a variety - of organic compounds at the 0.1-1.0ng/L level. The
apparatus is normally used with a solvent lighter than water but with slight modification it is possible
to use a solvent heavier than water.
Concurrent Extraction in a Narrow Tube:- The efficiency of extraction depends on the contact surface• area of the two phases, contact time and rate of
transport. A very simple method involves the use of a narrow tube in a helical coil. The two phases are pumped through the tube together. Depending on the
tube diameter and the surface tensions of the liquids with respect to one another and with respect to the wall of the tube droplets will be formed. The friction between the drops and the wall creates a turbulent flow and therefore mixing. This kind of extractor can be used with either lighter or heavier than water solvents. The phases are separated in a wider column that acts as a settler. This arrangement can be used for both counter-current and crosscounter-current extractions. Wu and Suffet 23 described the use of a 10 metre Teflon helical mixing coil for continuous liquid-liquid extraction of
pesticides from water at the microgram Oug)-nanogram (ng)/L levels. The recoveries of these compounds was greater
• -Concentration of Extracts
It has been shown that the concentration step following liquid-liquid extraction and other techniques such as adsorption onto Solids with licuid desorption (see Section 2.2) is a critical step where
h-27
serious solute losses can occur 2 ' . Junk et al24 recommend a distillation technique to concentrate the Sample after finding that 10-80% of solutes were lost when using free evaporation aided by nitrogen. They used the apparatus ,shown in Figure
3 24 •
Figure
3.
Scale drawing of concentration apparatus (A) Snyder distillation column; (B) bakelite heat shield covered with Al foil; (C) 50m1 vessel; (D) solvent; (E) graduated and calibrated taper; (F) hotplate. Junk et a124 have also investigated the shape of the •'vessel in which the concentration step is carriedout. • Several shapes that were studied are shown 24
9.
Figure 4. Scale drawing of the concentration vessels. (A) is recommended, (B) is unsatisfactory, (C) is questionable. When vessels (B) and. (C) were used, solute losses from
10-60% noted, whereas losses from vessels of shape (A) were less than 6%.
2.2 ADSORPTION ON SOLIDS Introduction
Extraction of organic substances from water by adsorption has gained in importance in recent years and appears to be replacing liquid extraction for
routine analysis. Activated carbon 1728-3° has been used , widely for several decades and this method has been elaborated in detail and standP.rdised 31 . Recently better results have been obtained by replacing activated
- carbon with organic resins such as Amberlite MO-23237
10. Principle of Method
Extraction:- Extraction of trace amounts of organic compounds from water with a solid sOrbent is a method in which adsorption on a solid substance is used in order to isolate compounds dissolved in water. Like liquid extraction,. that is based on the partition of the dissolved Compounds between the solvent and the water, sorbent extraction is based on the distribution of the dissolved compounds between the solid sorbent and water. Provided that the sorbent is selected correctly the partition coefficient is shifted more towards the sorbent than in liquid extraction. The principle of the method is therefore analogous to that of liquid extraction, the differences lying in the extraction materials used and in the resulting effect, the enrichment factor.
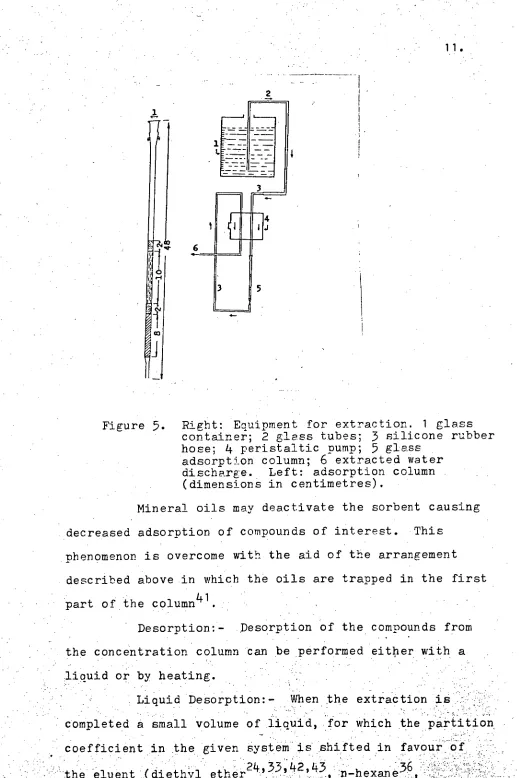
In the extraction procedure the water . sample, typically 1-100 Litres, is passed, usually with the aid of a pump, through a column packed with the solid
sorbent. The adsorbed compounds are then desorbed and analysed chromatographically. A typical concentration column41 as shown in Figure
5,
from bottom to top,1 1.
If
•••••• 6
4
[image:13.565.10.529.16.794.2]=-=
Figure
5.
Right: Equipment for extraction. 1 glass container; 2 glass tubes;3
silicone rubber hose;4
peristaltic pump;5
glass .adsorption column;
6
extracted water discharge.. Left: adsorption column (dimensions in 'centimetres).Mineral oils may deactivate the sorbent causing decreased adsorption of compounds of interest. This
phenomenon is overcome with the aid of the arrangement described above in which the oils are trapped in the first part of the column41
Desorption:- Desorption of the compounds from the concentration column can be performed either with a liquid or by heating.
Liquid Desorption:- When the extraction is - completed a small volume of liquid, for which the partition coefficient in the given system is shifted in
12. isopropanol 38, methyl isobutyl ketone 44, pyridine!4-5 , acetone 35 chloroform30) is passed through the column. As the liquid passes through the column, the adsorbed compounds are desorbed from the column and dissolved in the eluent. The volume of eluent required for total desorption is usually tehs of millilitres 24. As gas or liquid chromatography is used for subsequent analysis only about 0.01 - 0.1% of the total eluent volume
(0.1-1A1) can be used for the determination itself. The extract must therefore be concentrated and there is a risk of losses particularly of compounds with lower boiling points if the concentration is performed by
evaporation of theeluent24 . (See section - Concentration of Extracts).
The difficulties with the concentration of the extract are eliminated by using a mini sampler method with as little as 50-100AL46 of the eluent being sufficient for desorption.
The presence of the eluent liquid in the
solution used for gas chromatographic analysis is another problem encountered when using liquid desorption. A peak due to the eluent is present in the chromatogram and as the eluent is in excess this peak may overlap some peaks of compounds extracted from the water. In some instances the peak of the eluent can be eliminated by using an
abstraction precolumn 45.
47-50
13.
incorporates a concentration column before the analytical column of the liquid chromatograph has been described. During the extraction phase water passes through the concentration column while the analytical column is disconnected. When the extract- ion is completed the concentration column is connected to the analytical column. The adsorbed compounds are desorbed by the carrier liquid and eluted directly onto the chroMatographic column.
Thermal Desorption:- Thermal desorption involves the placement of the concentration column before the analytical column of a gas chromatograph. The precolumn is heated and the adsorbed compounds are consequently desorbed and transported by the carrier gas onto the chromatographic column 51 ' 52 . It is important that the desorption temperature and time, which differ for various adsorbents 53 , are sufficient to ensure that all of the compounds concentrated on the column are totally desorbed. . To eliminate the peak broadening that occurs with this method the first
portion of the chromatographic column can be cobled 48 ' 54 ' 55 and only after complete desorption is it heated to the
14.
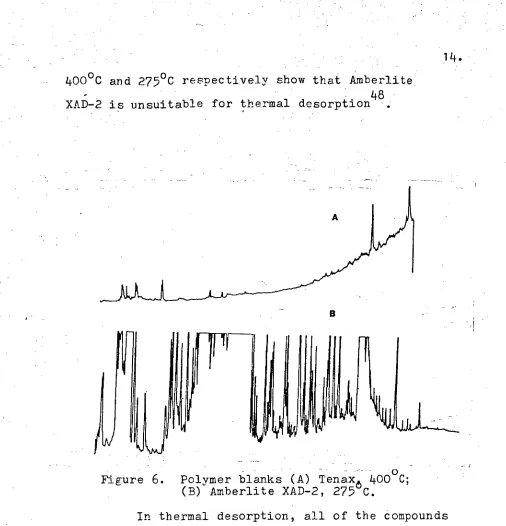
[image:16.562.17.523.8.534.2]400°C and 2750C respectively show that Amberlite 48 XAD-2 is unsuitable for thermal desorption .
Figure 6. Polymer blanks (A) Tenax o 4 0 C; (B) Amberlite XAD-2, 275 C.
In thermal desorption, all of the compounds adsorbed from the water sample are transferred on to the gas chromatographic column. This is in contrast to the liquid desorption procedure where a small pro-portion of the compounds are transferred to the gas chromatographic column. Therefore by using thermal desorption a gain in sensitivity of 2-3 orders of
• UTS8.1 •
GTiq Jo ;no IloeGT 04 saTqTandwT eJOW IAOTTP, L1OTDA eM0e,10
sdoTaAap uTsaa pep
galo.
umouLs uaaqseq
gI •gno 2uT1LipuTsea quGAaad 04 Touell4Gui aapun paao4s sT uTsea
ueaTo aq1 •dnueeTo at1- 4 Jo SS9U8AT4OGJJG GT; aloalqo og
L'udea2ogewoatIo s -e2 rc:q pasi:Taua sT aqenia aGtiqa
TAc
-
qqaTp ati4 pue sa4nuTw Ol Jo; JaLiqG T2N4GTID‘ Jo qw0E 1,14Tm pageaci TTTnba .sc
uTsaa agq uoTgoeaqxa pucoes atiq aa4Jv'TT-10,4ew pasTaawAcTod uou se uons saTqTandwT GAOTLGJ• og
'aaqqa TI:uqaTp
ugTIA
uoTqoaaqxa qa -Euxos anou9
pamo-
uoj
ToTleTigew sanou9
1110.1j pagoeaqxa qa -luxossT uTsaa GTiq qoTTA uT
95
gT pue uedegs 1:1qpacodoadws
.auo Og JeTTwis aanpaooad dnueaTo e Gsn (pg. faTquasse
qT punoj aAell suTsaa aqTiaaque peen qeiqq. sa- caom
•
?c
suTsaa eq -el-A'ape -LIgaw,cTod azTod ere 9 pue LGvx
seGaam4.reTOdUOU are pus sacawiciodoo GuazuactiuTATppuaa/Zqs,c'Tod
,a.re suTsaa pus
Gvx
au .9 pus L 4 i7 g-eGvx
aTcleiTeAe0,1e SreTaGq:2111 ..1110,E • •...iGq..em uT spunodui00 ofae3ao
Jo sq.uGgaospe se uo -Tquaqqa Jo T13ap ;tei.? paG00.1
aKeil suTsaa a 4TT-TectwV :suTsed G4Tiaactwv
pasn squagaospv Jo saoa,
•sdags uoTqaaquaouooaad
even as n-alkanes arising from the breakdown of the resin
when stored under methanol.
The various XAD resins have been used t 10 20 30 30
[image:18.562.17.534.53.813.2]Time. mins -11.
Figure
7.
Gas chromatographic scan of the eluent from an XAD-2 blank, after dry storage and dry packing.10 10 30 443 Time. mins —)-
Figure 8.
- -
Gas chromatographic scan of the same XAD-2 blank used in Fi gure
3,
but with methanol storage and slurry packing. All other conditions and chromatographic paramcters were the same as in Figure3.
James et al. 58 however, have found it essential to also wash the XAD resin with diethyl ether immediately before used to enable lower detection limits to be
17.
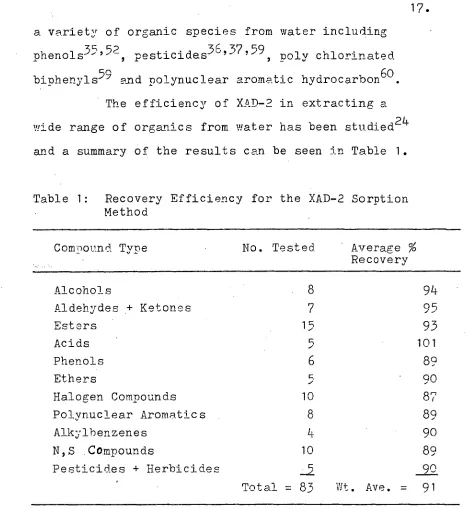
[image:19.562.42.508.37.561.2]a variety of organic species from water including phenols 35 ' 52 , pesticides3637,59 , poly chlorinated bipheny1s 59 and polynuclear aromatic hydrocarbon 6° . The efficiency of XAD-2 in extracting a wide range of organics from water has been studied 24 and a summary of the results can be seen in Table 1.
Table 1: Recovery Efficiency for the XAD-2 Sorption Method
Compound Type No. Tested Average % Recovery
Alcohols 8 94
Aldehydes .+ Ketones 7 95
Esters ' 15 93
Acids 5 101
Phenols 6 89
Ethers 5 90
Halogen Compounds 10 87
Polynuclear Aromatics 8 89
Alkylbenzenes 4 go
N,S .Compounds 10 89
Pesticides + Herbicides ..5 90
Total = 83 Wt. Ave. = 91
Thirteen different chemical classes were tested with four to fourteen chemicals per class. The weighted average of the recoveries was 91% for the 83 compounds tested.
62
Other studies 61, have shown that resin
18.
and XAD-8, are most efficient when isolating complex mixtures of compounds.
Tenax: Tenax is a Porous polymer based on 26-diphenyl-p-phenylene oxide. Before use Tenax•must be conditioned by heating in a stream of inert gas to 350oC for 30 minuteS48, or for 3 hours with subseouent heating at 200oC overnight62.
Leoni and Cc-workers40,41 have studied Tenax for the extraction of PAH and pesticides from surface and drinking waters. A diagram of the device used is shown in Figure 5. After the passage of 20L of water (at a flow of 3L/hr.) the column is disconnected and air was blown through for a few seconds in order to eliminate as much water as possible. Pesticides were eluted with three 10mL volumes of diethyl ether. The recovery of pesticides was found to be 1-_,out 90%1 0 . The recovery of Polynuclear Aromatic Hydrocarbons was in the range 85-98%. The main disadvantage of Tenax is that it is very expensive in comparison to XAD resins. This appears to have influenced workers to seleCt XAD resins instead of Tenax.
Activated 'Carbon: Activated Carbon has been • 1 0
19. are adsorbed and recovered more effectively than more polar materials. Before use the carbon must be
cleaned. Soxhlet extraction with chloroform for up to 11 hours61 has been found necessary to obtain acceptable blanks.
One major drawback with the use of activated carbon is the fact that some molecules are irreversibly
2 61
adsorbed' ' ' '. It has been shown that carbon
adsorption also promotes chemical alteration of some of the organic compounds66. Because of these major draw-backs, and the development of other solid adsorbents, the use of activated carbon has declined in recent years. Activated carbon is however still preferred over the more recently developed adsorbents for some applications
including pesticide analysis63
Polyurethane Foam: Polyurethane foam has been used for the concentration of chlorinated insecticides, polychlorinated biphenyls67'68 and polynuclear aromatic hydrocarbons60,69. The adsorption capacity of poly-urethane 'foam for these compounds was found to be
greater than the adsorption capacity of the other solid adsorbents available. The trapped material is usually eluted with methanol acetone or benzene 69
2-3 HEADSPACE
20. aqueous sample in a closed container. It has been
known for many years that when volatile organic
materials in water are allowed to come to equilibrium with the vapor headspace, the concentration in the headspace is proportional to the concentration in the water70.
Volatile trace organics can be determined in the 2-100Aig/L concentration range using this static
samplinE procedure8 The most common way to conduct such an analysis is to partially fill a small vial fitted with a septum cap with the water sample to be analysed. This vial is then placed in a thermostated bath and allowed to come to equilibrium. A sample of the headspace (1-2 mL) is then removed, with a syringe via the septum, for analysis.
Most of the compounds which are amenable to concentration and sampling in this manner are also amenable to gas chromatography. Quantification is obtained by comparing the response of the sample with the response curve prepared by analyzing known
concentrations of the compounds of interest added to water.
Temperature, salt concentration, and pH, can all have important effects on isolating volatile trace materials from aqueous samples71 .
21. in water 8 ' 72-74 . One of the major advantages Of
headspace analysis is that no solvent extraction is involved So that these low molecular weight, volatile compounds are not masked by the solvent peak when analysed by gas chromatography. Detection limits are restricted by the equilibrium concentration of the organics in the vapour phase as well as the limited amount of headspace gas which can be conveniently sampled and analysed. An improved technique using dynamic instead of static sampling has been developed.
Purge and tran technioue: Volatile substances present in aqueous samples canbe stripped from the water by a stream of inert gas75-77. Originally 75
the purged organic compounds were trapped cryogenically. The trapped compounds were then transferred to the
analytical system (usually gas chromatography) by rapid heating of the freezing trap. A vast improvement of the recovery was achieved by Grob 29 using an adsorbent trap. The organic compounds were recovered by washing the
Optional Exit foam in. o.d. trap
14 mm o.d.
Inlet 1/4 o.d.
Sample inlet 6-mm-o.d. rubber septum
10 mm o.d
Inlet in. o.d.
10-mm Glass frit medium porosity
10 cm
1
4 mm
o.
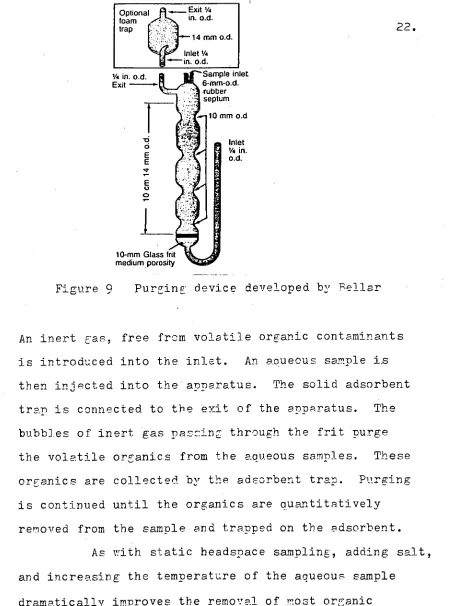
[image:24.568.61.513.38.644.2]22.
Figure 9 Purging device developed by Rellar
An inert gas, free from volatile organic contaminants is introduced into the inlet. An aqueous sample
then injected into the apparatus. The solid adsorbent trap is connected to the exit of the apparatus. The bubbles of inert gas passing through the frit purge the volatile organics from the aqueous samples. These organics are collected by the adsorbent trap. Purging is continued until the organics are quantitatively removed from the sample and trapped on the adsorbent.
As with static headspace sampling, adding salt, and increasing the temperature of the aqueous sample
dramatically improves the removal of most organic compounds 71 .
23.
vinyl chloride79 and other volatile organics with boiling points less than 140 ° 0 84 at the Lug/L level.
2.4 DISTILLATION
Steam distillation can be used as an effective concentration technique for low molecular weight
volatile trace organic water pollutants. The technique is quite straightforward.
The sample is placed in a distillation flask and the sample is heated64 . After distillation the distillate is analysed by a suitable method. Pest results have been obtained for those materials which form azeotropes with water that boil at temperatures below 99 o
c
64
.
A small all glass distillation-concentration system for organics in water which can obtain 300
fold concentration with recoveries of BO% has been
described85 . Linear recovery of acrolein, acrylonitrile, alcohols and ketones was reported over the concentration range of 10,-10Ong/L.
A technique combining distillation and static headspace sampling has been describedE3 . Detection limits for methanol, ethanol, acetone, 2-propanol and methyl ethyl ketone were in the range of 4-8nE/L.
Cooling water out 1
Cooling jacket
Distillate extraction
solvent
Solvent withdrawal tube
Cooling water in
Extracted distillate sample distilling flask
24.
Figure 10 Exhaustive steam distillation and solvent extraction apparatus.
The water sample is placed in a distillation flask fitted to the bottom of the column. The solution is boiled and the steam distillate Passes through the inner tube and condenses on the walls of the cooling
jacket. The condensate runs down the walls and passes through a layer of low density solvent which extracts the trace organics. The extracted condensate passes through the overflow tube in the centre of the column and returns to the distillation flask. Samples are removed through the solvent withdrawal tube. The
25. 2.5 MEMBPAE S7PAPATTONS
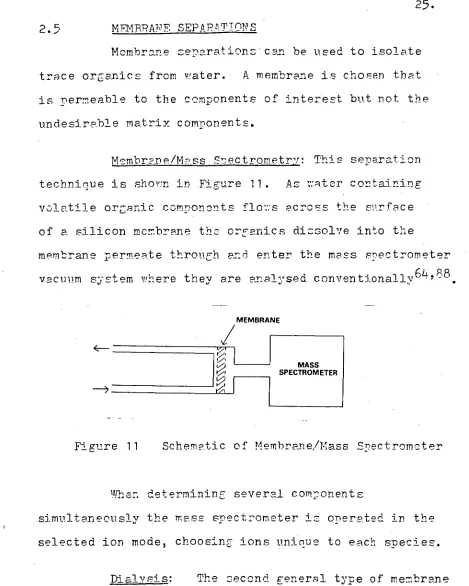
Membrane separations can be used to isolate trace organics from water. A membrane is chosen that is permeable to the components of interest but not the undesirable matrix .components.
McmbrFre/Mss q -nectrometry: This separation
technique is shown in Figure 11. As water containing
volatile organic corrion-nts flows acro ss the surface
of a silicon membrane ths organics dissolve into the
membrane permeate through and enter the mass spectrometer vacuum system where they are analysed conventionally 6488
MEMBRANE
Ir;;: !"
1-71
[image:27.562.47.516.62.648.2]MASS SPECTROMETER
Figure 11 Schematic of Membrane/Mass Spectrometer
When determining several components
simultaneously the mass spectrometer is operated in the selected ion mode, choosing ions unique to each steciec. .
26.
of water88. Therefore after dialysis the solute is • not only isolated into a more convenient matrix but
also concentrated to facilitate analysis.
In some cases dialysis can offer features not obtainable with liquid-liquid extraction. Dialysis can be used with a water miscible solvent; membrane
selectivity can prevent removal of otherwise extractable components and solutions that form emulsions can be
extracted easily.
2.6 OTHER TECHNIQUES
Other techniques that have been used for concentrating trace organics in water include the
following.
Freeze concentration which has been used
to concentrate m-cresol 20 fold with an 80% recovery 89-92. In this technique a portion of the water is frozen which concentrates the dissolved substances in the unfrozen portion.
Lyophilization or freeze drying which has
2
7.
SEPARATION TECHNIQUES
The sometimes large number of organic compounds that are extracted from water samples need to be
separated before qualitative or auantitative analysis. The two major separation techniques used are gas
chromatography and high performance liquid chromatography.
3.1 GAS CHROMATOGRAPHY
Introduction
Gas Chromatography (G.C.) is the most widely used technique for the separation of mixtures of organic compounds that have been extracted from water. Ry
choosing the correct column and conditions a wide variety of compounds in a miXture can be separated.
Principle of the Method
Chromatography is a process in which . chemical species are distributed between a stationary phase and a mobile phase, and migrate in the direction of, flow with a certain velocity. The stationary phase in gas
chromatography is either a solid (Gas Solid Chromatograrhy) or . a thin layer of non volatile liquid held on a
solid support (Gas Liquid Chromatography). The mobile phase is an inert. gas. A sample containing the solutes is injected into the column where solutes are repeatedly adsorbed by the stationary phase and then desorbed by
28. and therefore a band of each solute is formed.
Chromatographic Columns
Two basic types of columns are in general
use, namely packed and open tubular (capillary) columns. Packed columns are tubes made usually from glass
filled with either an adsorbent (GSC) or an inert
support coated with a non volatile liquid phase (GLC). They are normally 1-2 Metres long and 2-8mm in. diameter.
Open tubular columns have an unrestricted hole through which the gas can flow and the separating medium is coated on the wall of the tubing. The major drawback to wall coated open tubular columns (WCOT) is the small amount of liquid phase that the wall is capable of
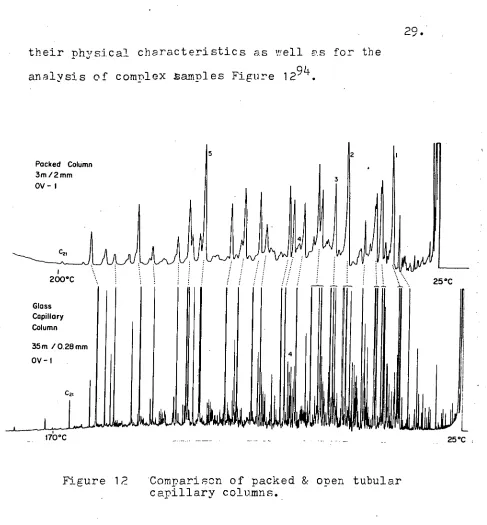
holding. This objection is overcome by increasing the surface area of the column by coating the wall with a finely divided support on which a much larger amount of liquid phase can be coated. This is the support coated open tubular column (SCOT). The main advantage of open tubular columns is that the low pressure drop of the carrier gas along the column allows longer lengths to be used. Open tubular columns range from 30-300 metres long and 0.1 to 0.6mm in diameter.
The separating ability per metre of an open tubular column does not differ greatly from. that of
200°C
170°C 25°C .
Packed Column 3m /2 mm OV — 1
Alt]
Glass Capillary Column
25°C
5
29.
[image:31.562.51.538.36.561.2]their physical characteristics as well as for the analysis of complex .samples Figure 1294.
Figure 12 'Comparison of packed & open tubular capillary columns.
Detectors
30.
of each detector overlap to a certain extent one of the detectors will usually have characteristics making it most suitable for a particular analysis.
The characteristics of the three most common detectors used in the analysis of trace organics in water are listed below.
Type of Detector Selectivity Detection Applications limit (g)
Flame Ionisation DeteCtor
all organic 1x10⁻⁹ organic acids95 compounds phenols9
except • polynuclear
-fOrthaldehyde aromatic hydro- and formic carbons39
acid samples contain-
ing a wide variety of
pollutants94,97298
Electron Capture Detector
-
compounds 1x10 organohalogen 12
having a compounds in
high wastewater99
affinity for polychlorinated electrons biphenyls in
(halogen drinking waterl°° containing chlorophenols in compounds) drinking water101
phenols after • conversion to their heptafluorobutyrl derivatives102 -
Thermionic compounds N: 1x 10 10 hydrazine Specific containing -11 residues in Detector nitrogen P:5x10 water103
or nitrogen contain-
31.
3-2 HIGH PERFORMATCE LIQUID CHROMATOGRAPHY
Introduction
The application of high performance liquid chromatography (hplc) to the analysis of trace amounts of organic compounds in water has gained importance in recent years. Typically 80-90% by weight of the organic comnonents of a water sample will not, even after
derivitization, pass through a gas chromatographic column. High performance liquid chromatography is presently the leading technique for separating these non volatile compounds.•
Princinle of the Method.
As in gas chromatography, high performance liquid chromatography is a process in which separation of chemical species is achieved by partitioning between mobile and stationary phases.
In hplc eluent from a solvent reservoir is filtered, pressurised and pumped through the
chromatographic column. A mixture of solutes injected at the top of the column is separated into components on travelling down the column and the individual solutes are monitored by the detector and recorded as peaks on a chart recorder.
32.
composition of eluent or they may be run in the gradient elution mode in which the mobile phase com-position varies throughout the run. Gradient elution is the analogue of temperature programming in gc.
The main mode of chromatography used is adsorption chromatography. In adsorption hplc the
separation is carried out with a liquid mobile phase and a solid stationary phase which reversibly adsorbs the solute molecules. The stationary phase may be polar (silica) with a relatively -non-polar mobile phase
(hexane) as has been used for the analysis of phthalate esters at the ng/L level non.,,polar with a polar mobile phase. The latter is known as reverse phase hplc. Reverse phase hplc has been used for the analysis of phenols 106,107, polynuclear aromatic
hydrocarbons50 Pesticides108 and tetrachloroethvlene109
Detectors
After leaving the column the individual solutes are monitored by the detector and recorded as peaks on a chart- recorder.
Ultraviolet detectors: UV detectors measure the change in UV absorption as a solute passes through a flow cell. On modern instruments the flow can be stopped and a scan of the UV sPectrum can be made for each solute. The sensitivity of the UV detector depends on the molar extraction coefficient of the solute.
33.
pesticide residues108 and tetrachloroethylenelQ9
have all been determined at the ng-Aig/L levels by
hplc using UV detection.
Fluorimetric Detectors: As the solute
passes through a flow cell it is excited by UV radiation
of a given wavelength. The fluorescence energy which
is emitted at a longer wavelength is then detected.
Fluorimetric detectors are generally more sensitive
than UV detectors. Polynuclear aromatic hydrocarbons
(PAR) have been determined using fluorimetric
detectors503 111,112 as low as the subpicogram per
litre level111 .
Refractive Index Detectors and Infra-red Detectors: These are available but have not been widely anplied to
the determination of trace oranics in water because of
their lower sensitivity.
Mass Spectrometry: Combined high performance liquid chromatography mass spectrometry has been used for
139 140
the determination of herbicides and nePticides but
34
L IDENTIFICATION TECHNIQUES
The major techniques that have been applied to the identification of organic water pollutants are mass spectrometry and infra red spectroscopy.
4.1 MASS SPECTROMETRY
Introduction
The first mass spectrometer was developed around 1912. However, it was not used for the ident-ification of water pollutants until much later113. The coupling of a gas chromatograph to a mass
spectrometer provided a technique of first separating and then identifying components in a mixture 114. One of the most significant advances in the identification of water pollutants came with the development and
application of computer assisted gas chromatography/ mass spectrometry which allows computer matching of
1 15 sample spectra with reference spectra in data banks -.
Components of Mass Spectrometers.
1 -100 1-90 •
10 100
10-80 arN
MS
GC
\N
MS OIRE CI COUPLINGSIC
F., Pi
SILICVE MLIBER MEMBRANE
the ion current detector.
InletSystem:- In tne an,alysis of water pollutants, the Mass spectrcmeter is almost invariably used coupled to a as chromatoErath. The normal inlet system of the mass spectrometer, which is capable of accepting solid, liquid or gaseous samples, is replaced by a gas. chrematorTraph-mass spectrometer (GC-HS)
interface. The purpose of the interface is to eliminate the carrier gas. Several interfaces have been described 11r. 'Jith the advent of vitreous silica capillary gas
chromatography columns with much lower carrier as flows and the.imrrovement of vacuum systems of mass•
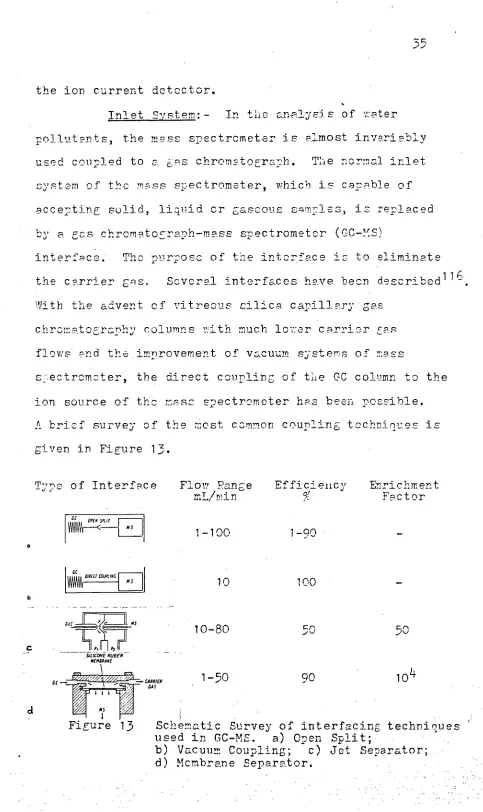
s -,ectromoter, the direct coupling of the GC column to the ion source of the mass spectrometer has been possible. A brief survey of the Most common coupling techniques is given in Figure 13.
Type of Interface Flow Pange Efficiency Enrichment m T/ m i n Factor
CARRIER 1-50 90 104
GAS
[image:37.562.38.521.20.832.2]MS
Figure 13 Schematic Survey of interfacing techniques used in GC-MS. a) Open Split; .
36
The enrichment factor is defined as the
relative increase in the concentration of the
compound in the carrier gas after passing the
inter-face. The efficiency is the percentage of the
compound in the GC effluent entering the mass
spectrometer.
More recently an interface has been developed
which allows a liquid chromatograph to be linked to a
mass spectrometer117. Although still in the
develop-mental stages this technique has been applied to
organic water pollutant ana1ysis118
Ion Sources:- The most common ion source is electron impact ionisation, where positive ions are
formed by bombarding the sample with electrons emitted
from a heated filament. Chemical ionisation, where a
re-actant gas is fed into the ionisation chamber during
electron bombardment produces a spectrum where, unlike
electron impact ionisation, the molecular ion is often
the most prominent. wield ionisation, where molecules
produce positive ions when subjected to intense electric
fields, produces a simoIer spectrum than electron imoact
but has the disadvantage of needing much more sample.
Each ionization process produces molecular ions and a
number of ionic fragments. The mass spectrum produced
is a record of the numbers of different kinds of ions
and is characteristic for every compound, including
37
spectrometry in the identification of organic Compounds. The positive ions formed in the ionization chamber are accelerated by an electrostatic field into the mass separator.
Mass Ser.arator:- The primary function of the mass analyser is to separate the positive ions from the ionization source according to the mass to charge ratios with either electrical or magnetic fields. The mass separator must be capable of focusing the ion beam to improve separation between adjacent positive m/e ions
for more accurate and precise mass measurements.
Although there are many tyres of mass analysers avail-able, the magnetic-deflection cycloidal focusing, double focusing, time of flight and quadrupole analyzers are the most commonly used.
Ion Current Detection:- After leaving the mass analyzer the separated ions strike a collector. For ion currents above 10-15 Amps an, insulate cur)
(Faraday Cage) is used for the collector. As each positive ion strikes the collector it picks up an
electron so that an electron current flows to the collector. For ion currents below 10 -15 Amps an electron multiplier is used.
Applications
38
identification of trace organics in water. The technique has been used widely during recent years. Examples of its application are, the identification
and determination of purgable organics in wastewaters 119 , chlorinated guaiacols 120 , phenolics, pesticides and.
•
polychlorinated biphenyls 121 , and chlorinated phenols 66. Specialized computer programs have been devel-oped to simplify the data processing and to extract obscured information from the data obtained in a GC/MS run. One such computer program has received various names in the literature, nimited Mass Search",
"Specific Ion Monitoring" or "Mass Chromatography". The technique is used to identify.the•locations of specific compounds or classes of compounds within a total ionization chromatogram (TIC). The computer program extracts the
ion current intensities from each spectrum in the TIC " at a specific mass which is characteristic of a compound
or class of compounds. This technique has been used for the determination of phthalate esters 122 , polyruclear
• aromatic hydrocarbons123 mononuclear aryl hydrocarbons124 chlorinated organics 125 and many other types of compounds in water extracts.
4.2
INFRARED SPECT'ROSCOPYIntroduction
Infrared spectroscopy has been used for many
DETECTOR
.Z2===
LABEAM- SPLITTER
(1-1) SOURCE
OF RADIATION
M 2
39
in water28 ' 126 . The past few ycprs have seen consid-
erable interest in the use of combined esas chromatofTraphy
and infrared. spectroscol)y (GC/IR) due to the advent of
Fourier Transform infrared - spectroscopy (FTIR).
Computer software has been developed which enables real
time infrarcd reconstructed chromatograms ard on lire . 12712
r- R
libary searching' ' This should Ereatly increase
the utilization of GC/FTIR for environmental watof analysis.
Instrumentation
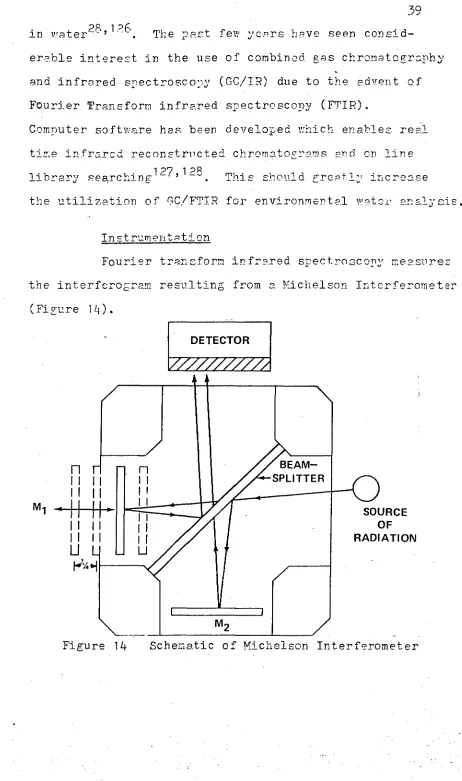
Fourier transform infrared spectroscopy measures
[image:41.568.50.512.51.832.2]the interferogram resulting from a Michelson Interferometer
(Figure 14).
40 An interferometer consists of a beam-splitter, a fixed mirror and a moving mirror. The beam of light is split
so that half of the light goes to each mirror. As the moving mirror (M 1 ) goes back and forth the two -split beams are recombined with one beam being out of phase with the other. A beam of light resulting from the constructive and destructive interference of the two split beams is produced and directed to the sample cell. The light transmitted through the sample strikes the detector.-
After the data are collected a computer executes a Faurier Transform of the data into•a single beam spect-rum which may then be ratioed against a background to produce a customary transmittance 'Vs wavenumber spectrum.
There are two major advantages of FTIR over dispersive instruments.
An FTTR instrument has a much higher signal to noise ratio than a dispersive instrument due • to the fact that all frequencies simultaneously reach the
1+1
kerilic2,tions
These advantages and the development cf . Pample cells (light pipes) and transfer lines to allow the on-the-fly analysis of components separated by capillary chromatography132,133 has allowed the technique to . be widely used for the analysis of trace organics in water. GC/FTIR has been used to identify up to
55
substances in the one sample 134 . GC/FTIR has been successfully used to identify components in paper mill wastewaters 133 ' 135 . The use of FTIR to identify peaks eluting from a HPLC has also been investigated 136 but there has been little application of this method to water analysis.GC/FTIR like GC/MS is used almost entirely for the identification of unknown compounds in complex
1+2
5
CONCLUSIONThe rate of development in the,area of analysis of trace organics in water is still limited by the available methods for separating th6 compounds from water and from each other. As yet there is no technique that is applicable to the full range of contaminants that are encountered.
XAD resin adsorption appears to be the best technique for separating organic contaminants from water but not all compounds encountered can be quantitatively desorbed from the resin.
Most of the work on separation techniques to date has dealt with the small percentage of compounds that are volatile and are capable of being sep arated by gas chromatography. New techniques will need to be developed for the remaining compounds. Much wider use of liquid chromatography/mass spectrometry could solve some of these problems.
The area of identification of organic pollutants should see wider use of gas chromatography/Fourier Transform' infrared spectrophotometry as these instruments become
more freely available. This technique will complement the information gained by the use of gas chroMatography/ mass spectrometry. There may also be contributions from little used techniques such as nuclear magnetic resonance.
43
6
REFERENCES1. Braus, H., Middleton, F.M. and Walton, G., Anal. Chem., 1951,
al,
1160.2. Keith, L.H., editor,"Identification and Analysis of Organic Pollutants in Water",Ann Arbor Science Publishers Inc., Ann Arbor,
Michigan (1976).
3. Henderson, J.E., Peyton, G.R. and Glaze, W.H., "Identification of Organic Pollutants in Water" (Ed. L.H. Keith) p. 105 - (Ann Arbor Science Publishers Inc., Ann Arbor,
Michigan (1976).
4. Grob, K., Grob, K. and Grob, G., J. Chromatogr.,
1975, 106, 299.
Richard, J.J. and Junk, G.A., J.Am. Water Works Assoc.,
1977, 69, 62.
Oliver, B.G. and Bothen K.D., - Anal. Chem.,
1980, 51, 2066.
7. Sorrell, R.K. and Reding, R., J. Chromatogr.,
1979, 185, 655.
8. Otson, R., Williams, D.T. and Bothwell, P.D., Environ. Sci. Technol.,1979, 11, 956.
41+
10. Burgasser, A.J. and Colarvotolo, J.F., Anal. Chem.,
1979, 21, 1588.
11. _Mieure, J.P. and Dietrich, M.W., J. Chromatog . r.,
1973, 11, 599.
12. Schmauch, L.J. and Grubb, H.M., Anal. Chem.,
1954, 26, 308.
13. Bellar, T.A. and Lichtenberg, J.J., J. Am. Water Works Assoc., 1
971+, 66, 739.
14. Zlatkis, A., Bertsch, W., Lichtenstein, H.A.,
Tishbe, A., Shunbc, F., Liebich, H.M., Ccscia, A.M. and Fleischer, N., Anal. Chem.,
1973,
L1, 763.
15. Murray, D.A., J. Chromatogr.,
1979,
185,
655.
16. Werner, A.E. and Waldichuk, M., Anal. Chem., 1962,
IL, 1674.
17. Kahn, L. and Wayman, C.H., Anal. Chem.,
1964,
1E, 1340.
18. Goldberg, M.G., DeLong, L. and Kahn, L., Environ. Sci. Techno1 7 „ 1971,
2, 161.
• 19. Goldberg, M.C. and DeLong, L., Anal. Chem.,
1973,,
8
9-
45
21. Ahnoff, M. and Josefsson, B., Anal. Chem.,
1974, Li, 658.
22. Ahnoff, M. and Josefsson, B., Anal. Chem., 1976, h8, 1268.
23. Wu, C. and Suffet, I.H., Anal. Chem.,
1977,
La, 231.
24. Junk, G.A., Richard, J.J., Griesser, M.D., Witiak, D., Witiak, J.L., Argvello, M.D., Vick, R., Svec, H.J., Fritz, J.S. and Calder, G.V., J. Chromatogr., 1974,
22,
745.
25. Strup, P.E., Wilkinson, J.E. and Jones, P.W., in Polynuclear Aromatic Hydrocarbons, Jones, P.W., Freudenthal R.I. Eds., Rowen Press, New York (1978).
26. Wood, N.F. and Snoeyink, J.L., J. Chromatogr.,
1977,
132,405.
27. Webb, R.G., Isolating Organic Water Pollutants: XAD resins Urethane Foams Solvent Extraction, PB-245 647, U.S. Environmental Protection Agency, Athens, Gorgia, (1975).
28. Rosen, A.A. and Middleton, F.M., Anal. Chem.,
1959,
1729.
Kleopfer, R.D. and Fairless, B.J., Environ. Sci. Technol., 1972,
6, 1036.
46
31. Standard Methods for the Examination of Water and Wastewater 15th Edition (1980),
Greenberg, A.E., Connors, J.J. and Jenkins, D., editors.
32. Dressler, M., J. Chromatogr.,
1979,
165,
176.
33. Burnham, A.K., Calder, G.V., Fritz, J.S., Junk, G.A., Svec, H.J. and Willis, R., Anal. Chem., 1972, LL, 139.
34. Aiken, Thurman, E.M., Malcolm, R.L. and Walton, H.F., Anal. Chem.,
1979, 51, 1799.
35. Chriswell, C.D., Chang, R.C. and Fritz, J.S., Anal. Chem.,
1975,
LZ, 1325.
. 36. McNeil, E.E. Otson, R., Miles, W.F. and
Rajabalee, F.J.M., J. Chromatogr.,
1977,
)32,
277.
37. Picer, N. and Picer, M., J. Chromatogr., 1980,
193,
357.
38. Kennedy, D.C., Environ. Sci. Technol.,
1973
2,
138.*cS 'TT "..logpmoJT40 f "W's
4 Tazsikl puP *d.sa '10Tuo3Pu3
"H'E 'dmnD "d 'sured0 "WS 'JeTsal-40 "LI'M .9+7 *6-17S 'TT '+72,6t "aqpw0.11.10 *11
'TionoaAPA pue .14 'Pupnod "N 'ToraJm •2,4-7
• 6ec
'22,61 "aZol_Imoa- 110 .p , .s.p pure 'Ppaqej, .9+7
*c?LL '7 '96t "waq3 iuV
"s*r
'214Tad puP •ocrl 'aa2uTosT5i "vo 'ITarasTatio•'+71-7t7
'77T '92,6t "Tos *.vo'ogpwoJtio 'I? "ma
pue •crp 'ueTsTw."I'w 'neaq-Ing "wd '4Tespo • +7 +7
'92,6t "WaIlD •Teuv -110JTAua •p •qui
"eri'd 'sutl-TJJTj0 Pim 'a 'IllanX "Ww caoTY;PI-zawoo •07 *o9S 'TT
'cLASL "Tos •1, 'VA
puP ,TIGa , .a.p 'uosaapued "Int 'azp -ED *615c
'9L6A ".1.-dogpm0„klio -r 'oTpTAoa
pue ,ard 'ociwoio0 "0 'Tqciepond "A 'Tuoaq • 1.+7
.61l ' 901 ' Z,61l "Jj 04-ew0.1110
48
49. Ishii, D., Hibi, K., Assai, K. and Naeaya, M.,J. ChromatoEr., 1978, 152, 341.
50. Ogan, K., Katz, E. and Slavin, W., J. Chromatogr.,
1978, 16, 517.
51. Peterson, H., Elceman, G.A., Field, L.R. and Sievers, R., Anal. Chem., 1978, 5o, 2152.
52. Voznakova, Z. and Popl, M., J. Chromatocx. Sci.,
.1979, E., 682.
53. Pellizzari, Carpenter, B.H., Bunch, J.E. and Sawicki, E., Environ. Sci. Technol.,
1975, 1, 556.
54. Bertsch, W., Anderson, E. and Holzer, G., J. Chromatogr.,
1975,
112, 701.55.
Ligon,
W.V. and Johnson, R.L., Anal. Chem., 1976, La, 481.56. Stepan, S.F. and Smith, J.F., Water . Res. II
(1977) 339.
57. Futoma, D.J., Smith, S.R., Smith, T.E. and
Tanaka, J., Polycyclic Aromatic Hydrocarbons in Water Systems, CRC Press, Florida (1980).
58. James, H.A., Steel, C.P. and Wilson, I., J. Chromator.,
1981, 208, 89.
49
60. Navartil, J.D., Sievers, P.E. and Walton, H.F., Anal. Chem., 1977,
L2 2
2260.61. Van Possum, P. and Webb,.R.G., J. Chromatogr., 1978, 150, 381.
62. Versino, B., Knoppel, H., DeGroot, M., Peil, A., Schavenburg, H., Vissers, H. and Geiss, F., J. Chromatogr.,
1976, 122,.373.
63. Bacaloni, A., Goretti, G., Lagana, A., Petronio, B.M. and Rotatori, M., Anal. Chem., 1980, 2a, 2033.
64. Mieure, J.P., Environ. Sci. Technol., 1980, IL, 930.
65. Eichelberger, J.W. and Lichtenberg, J.J., J. Am. Works Assoc., 1971, 63, 25.
66. McCreary, J.J., Snoeyink, V.L. and Larson, P.A., Environ. Sci. Technol., 1982, 16, 339.
67. Musty, P.R. and Nickless, G., J. Chromatogr., 1974, 100, 83.
68. Gresser, H.D., Chow, A., Davis, F.G., Uthe, J.F. and Reinke, J., Anal. Lett., 1971; 4, 883.
50
70. Kepner, P.E., Maarse, H. and Strating, • Anal. Chem., 1964,
77.
71. Friant, S.L. and Suffet, I.H., Anal. Chem., 1979, 21, 2167.
72. Kaiser, K.L. and Oliver, B.G., Anal. Chem., 1976, 48, 2207.
73. Piet, G.J., Slingerland, P., DeGrtnt, F.E., Van der Hetvel, M.R.M. and Zoeteman, B.C., Anal. Lett., 1978,
11, 437.
74. Dietz, E.Z. and Singley, K.F., Anal. Chem.,
1979, LL, 1809.
75. Swinnerton, J.W., Linnenbom, V.J. and Cheek, C.H., Anal. Chem., 1962, IL, 483.
76. Swinnerton, J.W., Linnenbom, V.J. and Cheek, C.H., Anal. Chem., 1962, IL, 1509.
77. Swinnerton, J.W. and Linnenbom, V.J., J. Gas. Chromatogr., 1967, 570.
78. Murray, D.A.J., Environ. Sci. Res., 1980, 16, 207.
79. Narang, R.S. and Bush, B., Anal. Chem., 1980,
.ta,
2076.5
181. Otson, R. and Williams, D.T., Anal. Chem., 1982, 942.
82. Bellar, T.A. and Lichtenberg, J.J., ASTM Spec. Publ. STP, 1979,
686,
108.83. Nicholson, A.A., Meresz, O. and Lemyk, B., Anal. Chem., 1977, 49, 814.
. 84. Novak, J., Zluticky, J., Kubelka, V. and Mostecky, J., J. Chromatogr., 1973, 2.6, 45.
8. Peters, T.L., Anal. Chem., 1980, 211.
86. Chain, E.S.K., Kuo, P.P.K., Cooper, W.J., Cowen, W.F. and Fuentes, P.C., Environ. Sci. Technol., \
1977, 11, 282.
87. Vieth, G.D. and Kiwus, L.M., Bull. Environ. Contain. Toxicol., 1977, 1.7_, 631.
88. Mieure, J.P., Mapes, G.W., Tucker, E.S. and
Dietrich, M.W., Indentification and Analysis of Organic Pollutants in Water, edited by-L.H. Keith, Ann Arbor Science Inc., Ann Arbor, Michigan (1976), 133.
89. Baker, P.A., Water Res., 1967, 1, 61.
90. Baker, P.A., Water Res., 1967, 1, 97.
52
92. Baker, R.A., Water Res., 1970, h,
559. -
93. Jolley, R.L., Lee, N.E., Pitt, W•W., Denton, M.S., Thompson, J.E., Hartmann, S.J. and Mashni, C.I., Progress in Wastewater Disinfection Technology, EPA-600/9-79-018 (1979), edited by A.D. Venasa 233 - 245.
94. Grob, K. and Grob, G., Identification and Analysis of Organic Pollutants in Water,
edited by L.H. Keith, Ann Arbor Science Inc., Ann Arbor, Michigan
(1976), 75.
95. Richard, J.J., Chriswell, C.D. and Fritz, J.S., J. Chromatogr., 1980, 1 9 9, 143.
96. • 'Dietz, F. and Traud, J., Vom Wasser, 1978, 5_1,
235.
97. Gschwend, P.M., Zafiriou, 0.C., Mantoura, R.F.C., Schwarzenbach, R.P. and Gagosian, R.B.,
Environ. Sci. Technol., 1982, 16, 31.
98. Mantoura, R.F.C., Gschwend, P.M., Zafiriou, 0.C. and Clarke, K.R., Environ. Sci. Technol.,
1982, 16, 38.
Van Rensburg, J.F.J., Van Huyssteen, J.J. and Hassett, A.J., Water Res., 1978, 12, 127.
53
101. Soerensen, 0., Vom Wasser, 1978, 259.
102. Lamparski, L.L. and Nestrick, T.J., J. Chromatogr., 1978,
156,
143.103. Selim, S. and Warner, C.R., J. Chromatogr., 1978, 166, 507.
104. The Analyser Hewlett Packard, 1982, 8,
5.
105. Schwartz, H.E. Anzion, C.J.M., Van Vliet, H.P.M., Copius Peerebooms, J.W. and Brinkman, U.A., Int. J. Environ. Anal. Chem., 1979, 6, 133.
106. Realini, P.A., J. Chromatogr. Sci., 1981, 11, 124.
107. Kung-Jou Chao, G. and Suatoni, J.C., J. Chromatogr. Sci., 1982, 20, 436,
•108. Narang, A.S. and Eadon, G., Int. J. Environ. Anal. Chem., 1982, 11, 167.
109. Kummert, R., Molnar-Kubica, E. and Giger, W., Anal. Chem., 1978,
22, 1637.
110. Gurley, T.W., J. ChromatoFr. Sci., 1980, 18, 39.
54
112. Cavelier, C., Analysis,
1980, 8, 46.
113. Melpolder, F.W., Warfield, C.W. and Headington, C.E., Anal. Chem.',
1953,
2.2,
1453.
114. Holmes, J.C. and Morrell, F.A., Apol. Spectrosc.,
1957, 11, 86.
115. Hites, R.A. and Biemann, K.•, Anal. Chem., 1968,
La, 1217.
116. ten Noever de Brauw, M.C., J. Chromatogr.,
1979,
165,
207.
117. Lovinc, R.E., Ellis, S.R., Tolbert, G.d. and
McKinney, C.R:, Anal. Chem.,
1973,
Lf.,
1553.
118. McAdams, M.J. and Vestal, M.L., J. C romatogr. Sci., 1980, 18, 110.
119. U.S.E.P.A. Report 600/2-80-017 (1980).
120. Knvutinen, J., J. Chromatogr., 1982, 2 48, 289.
121. Bishop, D.F., U.S.E.P.A. Report
600/52
-80
-196
(1980).
122. Buddle, W.L. and Eichelberger, J.W. in Identification and Analysis of Organic Pollutants in Water
edited by L.H. Keith, Ann Arbor Science Publishers Inc., Ann Arbor Michigan (1976)
55
123. Finnigan, R.E. and Knight, J.G. in Identification and Analysis of Organic Pollutants in Water edited by L.H. Keith, Ann Arbor Science
Publishers Inc., Ann Arbor, Michigan (1976), 185-204.
124. Coleman, W.E., Lingg, R.D., Melton, R.G. and
Klopfler, F.C. in Indentification and Analysis of Organic Pollutants in Water edited by
L.H. Keith, Ann Arbor Science Publishers Inc., Ann Arbor, Michigan (1976), 305-328.
125. • Geiger, W., Reinhard, M., Schaffner, C. and Furcher, F. in Identification and Analysis of Organic Pollutants in Water edited by L.H. Keith, Ann Arbor Science Publishers Inc . ., Ann Arbor Michigan (1976), 433-452.
126. Rosen, A.A., Midoleton, F.M., Ahal. Chem., 1955,
az,
790.127. 'de Haseth, J.A., Isenhour, T.L., AnaL Chem., 1977, licl, 1971.
128. Hanna, A., Marshall, J.C., Isenhour, T.L., J. Chromatogr. Sc., 1979, 12., 434.
129. Fellgett, P.B., J. Phys. Radium, 1958,
56
131. Jacquinot, P., Rep. Prog. Phys., 1960, al, 267.
132. Azarraga, L.V., McCall, A.C., USEPA-660/ 2-73-034, 1874.
133. Keith, L.H., USEPA-660/4-75-005, 1975.
134. Gurk=, D.F., Laska, P.R., J. Chromatogr. Sci., 1982, 20, 145.
135. Keith, L.H., Environ. Sci. Technol., 1976, 10, 555.
136. Griffiths, P.R., USEPA-• 660/4-79-064, 1980.
137. Shafer, Cooke, M., DeRoos, F., Jakobsen, R.J., Rosario, 0., Mulik, J.D., Appli. Spectrosc., 1931, 1/, 469.
138. Buettler, B., J. Agric. Food Chem., 1933, 11, 762.
139. Parker, C.E., Haney, C.A., Harvan, D.J., Hans, J.R., J. Chrom=tor., 1982, PL 2, 77.