The structural history of Tasmania
from the
Devonian to the Recent
Andrew Stacey B.Sc. (Hons)
Submitted in fulfilment of the requirements for the degree of Doctor of Philosophy
University of Tasmania
This thesis contains no material which has been accepted for a degree or diploma
by the University or any other institution, except by way of background
information and duly acknowledged in the thesis. To the best of my knowledge
and belief the thesis contains no material previously published or written by
another person except where due acknowledgement is made in the text of the
thesis.
Andrew Stacey
Date:
STATEMENT OF AUTHORITY OF ACCESS
This thesis may be made available for loan and limited copying in accordance with the Copyright Act 1968.
Andrew Stacey
Onshore Tasmania is a frontier exploration province, where exploration using modern
methods has not previously been attempted. Bitumen, oil and gas seeps have been widely
reported from onshore Tasmania over the last hundred years. Over 40 exploration wells have
been drilled, however none have been successful. Most wells were drilled in the vicinity of
alleged seeps with little or no knowledge of stratigraphy or structure. No exploration well has
been drilled on a target identified from a seismic reflection survey.
The primary aim of this research is to establish the geometry and age of structures affecting
the Permo-Triassic Tasmania Basin, and also the Tertiary basins and Palaeozoic fold-thrust
belt. The findings are used to define the distribution and style of potential hydrocarbon traps,
and to assess the potential influence the age of trap formation has on hydrocarbon
prospectivity.
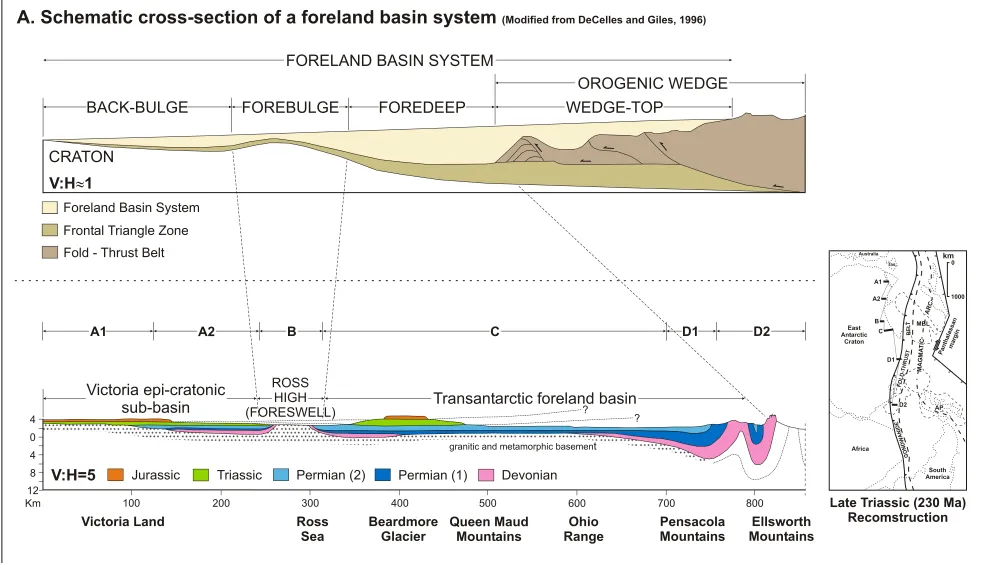
The Tasmania Basin developed in a back-bulge depozone inboard of the major foreland basin
formed behind the Andean-style eastern margin of Gondwana. The eroded remnant of the
Tasmania Basin covers an area greater then 30 000 km2 in central and eastern Tasmania. In
the Middle Jurassic, Tasmania was part of the Karoo/Ferrar/Tasmania large igneous field with
large volumes of dolerite intruded into the Parmeener Supergroup. From the middle
Cretaceous to Tertiary, Tasmania was subject to uplift, erosion and northeast directed
extension associated with the break up of Gondwana. Tertiary sediments were deposited in a
series of linked half-grabens including the northwest striking Longford Sub-basin.
The geology and structure of the pre-Late Carboniferous basement is known from outcrop
around the margins of the Tasmania Basin. To a large extent the basin lies along the boundary
between the Western Tasmania Terrane and the Eastern Tasmania Terrane. In north eastern
Tasmania the dominant folds were formed during north-eastward transport, while in western
Tasmania Devonian structures verge to the south-west. Current models suggest these terranes
were brought together during the Tabberabberan Orogeny along a major crustal dislocation,
resolution digital elevation model. The interpretation is supported by geological mapping, and
drill-hole, velocity and gravity data. Six hundred kilometres of regional seismic data (23 lines)
were acquired across the Central Highlands and Longford Sub-basin in 2001. The seismic
lines are widely spaced and mainly recorded along public roads. Crooked line geometry and
inverted near-surface velocity contrast caused by dolerite are major problems affecting the
quality of the migrated seismic sections. The seismic dataset forms the core of this analysis,
providing information about the geometry and age of folding and faulting.
Four periods of deformation have affected onshore Tasmania since the Devonian. In the
basement, a zone of north-east dipping thrusts lies beneath the Launceston Tertiary Basin.
These thrusts form the boundary between the Western and Eastern Tasmania Terranes.
Southwest of this boundary the basement becomes increasingly fold dominated with
kilometre scale folding identified on the westernmost seismic sections. The folds and thrusts
seen in the seismic sections are similar to structures mapped in nearby basement outcrop
which formed during the Middle Devonian Tabberabberan Orogeny.
The Tasmania Basin was faulted and weakly folded prior to and/or during the intrusion of
dolerite in the Middle Jurassic. Structures of this age are common in the Central Highlands
but difficult to recognise in the Longford Sub-basin/Northern Midlands regions. Gentle folds
and faults with both normal and reverse offset are recognised. Some faults have acted as
conduits for dolerite dykes and step ups in sills.
Following the intrusion of dolerite the Tasmania Basin was affected by uplift, erosion and
extensional faulting. Folds and faults formed in the Tasmania Basin at this time are more
common then earlier structures. While this phase of deformation affected the entire basin, the
density of faulting is far greater beneath the Launceston Tertiary Basin then in the Central
Highlands. The locus of extension lies above the Tamar Fracture System where reactivation
of basement thrusts resulted in the widespread development of half-grabens. The Central
Highlands region was little affected, acting as a competent block during this event.
The final event to affect Tasmania was mild northwest compression in the Mio-Pliocene. This
event is indicated by inversion structures affecting Tertiary sequences on the seismic sections
geomorphologic responses to environmental conditions and tectonic events from which active
geological processes and the nature of the underlying geology may be interpreted. The model
applied here is that the contemporary topography of Tasmania is dominated by Tertiary
tectonics modified by erosion. Based on this concept, the DEM was used to determine the
pattern of Tertiary faulting. The Tertiary Fault Pattern is relatively simple in the north with
extension concentrated on the Launceston Tertiary Basin where the strike of the basement
faults is near orthogonal to the extension direction. In southern Tasmania the basement
structure is more complex and the extensional geometry is dominated by strongly curved
faults and soft-linked grabens. The style of Tertiary faulting in Tasmania reflects the
basement structure.
Two petroleum systems have been proposed for onshore Tasmania, a Larapintine Petroleum
System in the Late Cambrian to Early Devonian Wurawina Supergroup and a Gondwana
Petroleum System in the Parmeener Supergroup (Tasmania Basin). Maturation of, and
migration from, the Larapintine Petroleum System probably occurred in the Early Devonian,
with a possible second phase of generation in the Middle Jurassic to Late Cretaceous when the
Gondwana Petroleum System is thought to have matured.
From analysis of the seismic sections, potential hydrocarbon traps were developed in the first
three phases of the structural history reported here. During the Tabberabberan Orogeny large
folds developed in western and south-western Tasmania, these form part of a possible
Larapintine play. Another Larapintine play involves sub-unconformity and palaeokarst traps
developed beneath the Tasmania Basin.
Plays in the Gondwana system involve a diversity of structural traps developed by both pre-
and post- dolerite tectonic events and stratigraphic traps resulting from pinch outs with
dolerite sheets. The best potential traps are formed by rollover anticlines and numerous tilted
fault blocks in the Longford Sub-basin. Large fault bounded blocks are the most common
style in the Northern Midlands. Gentle anticlines form the most probable trap structures in the
predicted timing of hydrocarbon generation, and their possible destruction by later tectonic
events. It is improbable that Middle Devonian anticlines were charged by hydrocarbons
generated in the Early Devonian. However, these structures were available to hydrocarbons
generated during the subsequent thermal event, as were palaeokarst and sub-unconformity
traps.
In the Tasmania Basin, traps developed before the intrusion of dolerite carry a high charge
potential. The risk of later leakage of these early structures is very high in the area of the
Launceston Tertiary Basin where the Cretaceous/Tertiary faulting is dominant. The
pre-dolerite structures may survive in the Central Highlands. Traps developed by Tertiary tectonic
events were formed after the Middle Jurassic to Late Cretaceous thermal maximum. The
existing thermal models do not suggest petroleum generation has occurred since these
structures were developed.
Analysis of the petroleum systems events for onshore Tasmania indicates the prospectivity for
the province is low. There is doubt regarding quality, distribution and generative potential of
source rocks in both petroleum systems. The Larapintine System depends on the existence of
a reservoir with secondary porosity or palaeokarst. No potential reservoir has been found. In
the Gondwana System while there has been local generation of hydrocarbons, no evidence of
migrated hydrocarbons has been found during drilling in the main basin. However our
knowledge of these systems is not mature. Future deep drilling through the Tasmania Basin
and into the basement will do much to improve our understanding. Several potential
hydrocarbon trap styles are present in onshore Tasmania. However, the timing of trap
formation in relation to later structural development and the predicted maturation and
This research was supported by an Australian Postgraduate Award (Industry), the University
of Tasmania and Great Southland Minerals Limited.
I would like to thank Malcolm Bendall and Dr. Clive Burrett of Great Southland Minerals
(GSLM) for their courage in conceiving the project and for their material and financial
support throughout. I wish them and the staff of GSLM every success with their future
exploration program.
My thanks to my supervisors Assoc. Prof. Ron Berry and Dr. Michael Roach. Ron, many
thanks for your ideas, support and patience in seeing this thesis through. It is undoubtedly
better for your input. Mike, thanks for your support, especially in computational matters and
with the velocity survey, which was ultimately so important to the seismic interpretation.
I must also thank Assoc. Prof. Leonid Danyushevsky and Dr. Trevor Falloon for plucking me
from obscurity and allowing me to become involved in some “big science”, and Dr’s Peter
McGoldrick and Garry Davidson for taking me again and again (and again) on the East Coast
Excursion, an experience both enjoyable and educational. To all the academic, general staff
and past and present students of the School of Earth Science and CODES, my thanks for your
input over the years, whether it be intellectual, practical, physical or administrative, you have
all in some way contributed to the success of this endeavour.
My co-conspirators on this project were Dr. Catherine Reid, Allan Chester and Jubo Lui, my
thanks to you all for your help and interest and opinions on my part of our research and for the
many discussions on Tasmania and its petroleum potential.
Many started a similar journey at the time I did, some have finished some are still labouring
on. To the “usual suspects” Kate Bull, Nicky Pollington, Lee Evans, Jubo Lui, Allan Chester,
Russell Fulton and Mawson Croaker, thanks folks for your friendship, support and advice
over the past five years. To those who made it to the light – congratulations, and to those still
going “hang in there, you’ll make it”!
Finally, my thanks to Bron, without whose love and undying support, I may not have made it!
ABSTRACT……….………...……… i
FRONTISPIECE………...……… v
ACKNOWLEDGEMENTS………..………. vi
TABLE OF CONTENTS……….. vii
LIST OF FIGURES………. xiv
LIST OF TABLES………... xxii
APPENDICIES……….. xxii
LIST OF MAPS AND SECTIONS………... xxiii
CHAPTER 1
INTRODUCTION
1.1: PREAMBLE……….……..……..……… 11.2: AIMS OF THIS STUDY………...………... 2
1.3: DATASETS, METHODS AND SOFTWARE TOOLS……….……… 2
1.4: LOCATIONS, MAPS AND SEISMIC SECTIONS……….…….……….. 3
1.5: EXPLORATION HISTORY………..………. 5
1.6: PREVIOUS WORK………...………….……….. 8
1.7: THESIS STRUCTURE………..………..……… 11
CHAPTER 2
REGIONAL GEOLOGY
2.1: INTRODUCTION………...………. 132.2: PROTEROZOIC………..………... 14
2.3: EARLY TO MIDDLE CAMBRIAN………. 15
2.4: LATE CAMBRIAN TO EARLY DEVONIAN……….………... 16
2.4.1: WURAWINA SUPERGROUP………..……….. 16
2.4.2: MATHINNA SUPERGROUP…..……… 16
2.5: MIDDLE DEVONIAN TO LATE CARBONIFEROUS………..……… 17
2.5.1: TABBERABBERAN OROGENY AND THE TAMAR FRACTURE SYSTEM…...…… 18
2.6: LATE CARBONIFEROUS TO LATE TRIASSIC………... 19
2.6.1: TASMANIA BASIN………...……… 19
Tectonic setting and basin style………..……… 20
Basal Tillite………..……….. 27
Diamictite………..……… 27
Lower Marine Sequence…...……….. 30
Pebbly siltstone (and Tasmanite Oil Shale)……..……….. 30
Fossiliferous siltstone………...……… 32
Lower Freshwater Sequence……..……….. 34
Freshwater and marginal marine siltstone and sandstone……...……….. 34
Upper Marine Sequence…………..………... 36
Calcareous fossiliferous siltstone and limestone…………..………... 36
Fossiliferous siltstone and sandstone…………..………... 38
Poorly fossiliferous mudstone and siltstone………..……… 40
Summary…..……….. 41
2.6.3: UPPER PARMEENER SUPERGROUP…………..………. 42
Unit 1………...………. 43
Carbonaceous rocks and coal measures………..………... 43
Unit 2………...………. 46
Quartz Sandstone………..………. 46
Unit 3………...………. 48
Quartz and lithic sandstone………...……….. 48
Unit 4………...………. 49
Volcanic lithic sandstone and coal measures…………..……….. 49
Summary……..……….. 51
2.7: LATE JURASSIC TO RECENT……….……… 52
2.7.1: OFFSHORE BASINS…………...……… 54
Bass Basin………..………... 54
Durroon Basin………..………. 55
Sorell Basin………...………. 56
2.7.2: ONSHORE BASINS……..……….. 57
Launceston Tertiary Basin……..……….. 57
Tamar Graben………..……… 58
Devonport – Port Sorell Sub-basin…………..………... 59
Longford Sub-basin………..………. 59
Macquarie Harbour Graben..………. 60
Derwent Graben………..………...……….………. 60
Coal River Graben………..………. 61
Other Tertiary Structures……..……….……… 61
Oyster Bay Graben………..……….. 61
Scottsdale Sub-basin………..……….. 61
2.8: IGNEOUS ROCKS………..……….. 62
2.8.1: JURASSIC DOLERITE………..………. 62
2.8.2: CRETACEOUS ALKALINE ROCKS…..……….. 64
THE PETROLEUM GEOLOGY OF ONSHORE TASMANIA
3.1: INTRODUCTION………...………. 66
3.2: TASMANIA BASIN - PARMEENER SUPERGROUP – GONDWANA PETROLEUM SYSTEM………..……….………. 67
3.2.1: SOURCE ROCKS………..……….. 69
Tasmanite Oil Shale………..……….. 69
Woody Island Siltstone and Quamby Mudstone………..……….….. 69
Macrae Mudstone………..………….. 70
Lower Freshwater Sequence: Mersey Group, Liffey Group, Faulkner Group…..…... 70
Unit 1: Cygnet Coal Measures………..……… 71
Thermal History and Maturity………..………. 72
3.2.2: RESERVOIR ROCKS………..……… 72
Lower Freshwater Sequence………..……….. 73
Other potential reservoir rocks in the Lower Parmeener Supergroup…..……… 73
Unit 2………..………. 73
3.2.3: SEALS AND TRAPS………..………. 74
Ferntree Formation and Correlates………..……….. 74
Jurassic Dolerite………..………… 74
Cascades and Poatina Groups………..……….. 74
Traps………..………. 75
3.3: WURAWINA SUPERGROUP – LARAPINTINE PETROLEUM SYSTEM……….……… 75
3.3.1: SOURCE ROCKS………..……….. 77
Gordon Group………..………. 77
3.3.2: RESERVOIR ROCKS………..……… 78
Gordon Group………..………. 78
Eldon/Tiger Range Groups………..……….. 78
3.3.3: SEALS AND TRAPS………..………. 78
Seals………..……….. 78
Traps………..………. 79
3.4: PROTEROZOIC HYDROCARBONS………...………... 79
CHAPTER 4
DIGITAL ELEVATION MODEL
4.1: INTRODUCTION……….………. 814.2: PREVIOUS WORK………...……….. 84
4.3: PENEPLAIN ANALYSIS……….……… 84
4.3.1: AIMS………. 84
4.3.2: METHODOLOGY………... 84
Lineament Analysis………... 85
Topographic Breaks……….. 85
Tertiary Fault Pattern……….……… 87
4.3.3: OBSERVATIONS……….……….. 90
Central Northern Domain………. 90
North-Eastern Domain……….. 93
Central Domain………... 95
South-Eastern Domain……….………. 95
Southern Domain………... 96
4.3.4: DISCUSSION……….. 97
4.4: CONCLUSIONS……….……….. 105
CHAPTER 5
SEISMIC DATA AND INTERPRETATION METHODOLOGY
5.1: INTRODUCTION………...……….. 1065.2: PREVIOUS WORK………..……….. 106
5.3: 2001 TASMANIA BASIN SEISMIC SURVEY (TB01)……...………... 107
5.3.1: INTRODUCTION……… 107
5.3.2: ACQUISITION………. 108
5.3.3: PROCESSING……… 108
5.4: STRATIGRAPHIC CONTROL AND CORRELATION…………...……….. 113
5.4.1: STRATIGRAPHIC CONTROL………. 113
Introduction………. 113
Well Control………. 115
Hunterston 1 DDH………. 115
RG-145 Tunbridge Tier……… 117
GV1 Golden Valley……… 117
Other Wells………. 117
RG-146 Ross……… 117
The Quoin – Ross………. 118
Annandale 1………... 118
Woodbury 11……….. 119
MPT 1- Dungrove……….. 119
5.4.2: SEISMIC- LITHO-STRATIGRAPHIC CORRELATION………... 119
Velocity Survey………... 119
Introduction……… 119
Equipment……….. 120
Procedure………... 121
Data Acquisition………. 121
Interpretation……….. 123
Results………. 124
5.4.3: REGIONAL GRAVITY DATA……….. 126
5.5: SEISMIC STRATIGRAPHY, NOMENCLATURE, HORIZON AND FAULT PICKS………. 128
5.5.1: INTRODUCTION……… 128
5.5.2: QUATERNARY SEISMIC STRATIGRAPHY……… 130
5.5.5: LATE CARBONIFEROUS TO TRIASSIC (PARMEENER SUPERGROUP)
SEISMIC STRATIGRAPHY……….. 133
Unit 4………. 133
Unit 2………. 133
Upper Marine Sequence………... 134
Cascades Formation………. 135
Lower Freshwater Sequence……….. 135
Lower Marine Sequence………... 136
Base Bundella Mudstone………. 136
Tillite……….. 136
Base Parmeener Unconformity……….. 136
Basement………. 137
5.5.6: FAULTS………... 139
Post - Jurassic (Post – Dolerite) Faults……… 139
Later Tertiary Faults………. 140
Early Tertiary Faults………. 141
Undifferentiated Tertiary Faults……… 142
Pre - Jurassic (Pre – Dolerite) Faults……… 144
“Not Intruded” Faults……….. 144
“Intruded” Faults……….. 147
Indeterminate Faults………. 148
CHAPTER 6
SEISMIC INTERPRETATION – DESCRIPTTION
6.1: INTRODUCTION………. 1496.2: CENTRAL HIGHLANDS………. 149
6.2.1: TB01-PA……….. 149
6.2.2: TB01-PB……….. 157
Shot-points 100 – 500……… 158
Shot-points 400 – 1000………. 162
Shot-points 1000-2200……….. 168
Shot-points 2200 – 2350………... 173
Shot-points 2350 – 3150………... 176
Shot-points 3150-3500……….. 179
Shot-points 3500-3800……….. 183
Shot-points 2800 – 3800 (Basement)……… 188
6.2.3: TB01-PD……….. 191
Shot-points 142 – 250……… 192
Shot-points 250 – 400……… 195
Shot-points 400 – 620……… 197
Basement………. 199
6.2.4: TB01-ST……….. 199
Shot-points 100-1650……… 200
Shot-points 1650 – 1950………... 204
Shot-points 100 – 275……… 213
Shot-points 275 – 475……… 217
Shot-points 475-570……….. 219
Basement………. 219
6.2.6: TB01-TB……….. 219
Shot-points 100 – 280……… 221
Shot-points 280 – 900……… 223
Shot-points 900-1650……… 229
Shot-points 1650 – 1876………... 232
6.2.7: TB01-TC……….. 234
Shot-points 100 – 950……… 236
Shot-points 950 – 1484………. 239
6.2.8: TB01-TD……….. 242
Shot-points 100 – 350……… 244
Shot-points 350 – 550……… 246
Basement………. 246
6.2.9: TB01-TH……….. 247
Shot-points 100 – 650……… 249
Shot-points 650 – 1650………. 253
Shot-points 1650 – 2810………... 259
6.2.10: TB01-TI……….. 262
6.2.11: 95AGST4………... 265
Shot-points 4000 – 4150………... 268
Shot-points 4150 – 4408………... 269
Basement………. 269
6.3: LONGFORD SUB-BASIN……….. 270
6.3.1: TB01-PF……….. 270
Shot-points 155 – 400……… 271
Shot-points 400 – 800……… 273
Shot-points 800 – 1527………. 273
Basement………. 274
6.3.2: TB01-PG……….. 274
Shot-points 100 – 500……… 275
Shot-points 500 – 1800………. 275
Shot-points 1800 – 2382………... 284
Basement………. 286
6.3.3: TB01-PM……….. 287
Shot-points 100 – 275……… 288
Shot-points 275 – 1036………. 290
6.3.4: TB01-PT……….. 291
Shot-points 101 – 625……… 291
Basement………. 294
6.3.5: TB01-PU……….. 294
Shot-points 336 – 500……… 295
Shot-points 500 – 1075………. 295
Shot-points 1075 – 1514………... 297
Shot-points 370 – 850……… 299
Shot-points 850 – 1272………. 300
Basement………. 302
6.3.7: TB01-TE……….. 303
Basement………. 306
CHAPTER 7
SEISMIC INTERPRETATION – RESULTS
7.1: STRATIGRAPHY……… 3077.2: STRUCTURE………. 307
7.2.1: Tasmania Basin and Longford Sub-basin………. 307
Faults………. 307
Distribution………. 307
History of Generation……….. 310
Folds……….. 313
Type and Distribution... 313
7.2.2: Basement……… 317
Structural Domains……… 317
7.3: BASIN GEOMETRY……….. 320
7.3.1: Longford Sub-basin………. 320
7.3.2: Tasmania Basin……… 324
7.4: GEOMETRY OF DOLERITE INTRUSION………. 326
7.5: PETROLEUM GEOLOGY……….. 329
7.5.1: Potential Hydrocarbon Trap Styles………. 329
Stratigraphic Traps……… 329
Pinch Outs……….. 329
Unconformity Traps………. 330
Base Parmeener Supergroup Unconformity………. 330
Structural Traps……….. 332
Anticline Traps……….. 332
Fault Related Traps……….. 334
Fault Drag Fold Traps……….. 334
Fault Block Traps……….. 335
CONCLUSIONS
8.1: INTRODUCTION……….……….. 339
8.2: THE TASMANIA BASIN……….……….. 339
8.3: THE STRUCTURAL HISTORY OF TASMANIA……….. 340
8.3.1: Pre–Late Carboniferous (Tabberabberan Orogeny)……….……… 340
8.3.2: Late Carboniferous–Middle Jurassic……….……….. 341
8.3.3: Middle Jurassic–Early Tertiary (Gondwana Break-up)………... 342
8.3.4: Miocene–Pliocene (Inversion)……….………... 343
8.3.5: Summary……….………. 343
8.4: STRUCTURAL HISTORY AND IMPLICATIONS FOR HYDROCARBON PROSPECTIVITY………... 344
8.4.1: Introduction………. 344
8.4.2: Larapintine Petroleum System……….. 344
8.4.3: Gondwana Petroleum System……… 345
8.4.4: Summary……….. 347
REFERENCES………. 349
LIST OF FIGURES
Figure 1.1: Locations mentioned in the text……….. 4Figure 1.2: Major geographical areas mentioned in the text……….. 5
Figure 1.3: 1:250 000 Geology of the TB01 Seismic Survey Area……… 6
Figure 2.1: Devonian structural trends in Tasmania……… 17
Figure 2.2: Current extent of the Tasmania Basin……… 20
Figure 2.3: The Panthalassan margin of Gondwana……… 20
Figure 2.4: The Panthalassan margin between Australia and Antarctica………. 22
Figure 2.5: Comparison of the schematic cross-section for a foreland basin system and the orogen normal cross-section of the Transantarctic Basin……… 23
Figure 2.6: The generalised stratigraphy of the Lower Parmeener Supergroup………. 25
Figure 2.7: Palaeogeographic reconstructions of the Tasmania Basin during deposition of the major units of the Lower Parmeener Supergroup……….. 28
Figure 2.8: Angular unconformity between the Mathinna Supergroup and the Lower Freshwater Sequence, Lower Parmeener Supergroup, Pepper Hill, north-eastern Tasmania (570 934 mE, 5 390 283 mN)………. 34
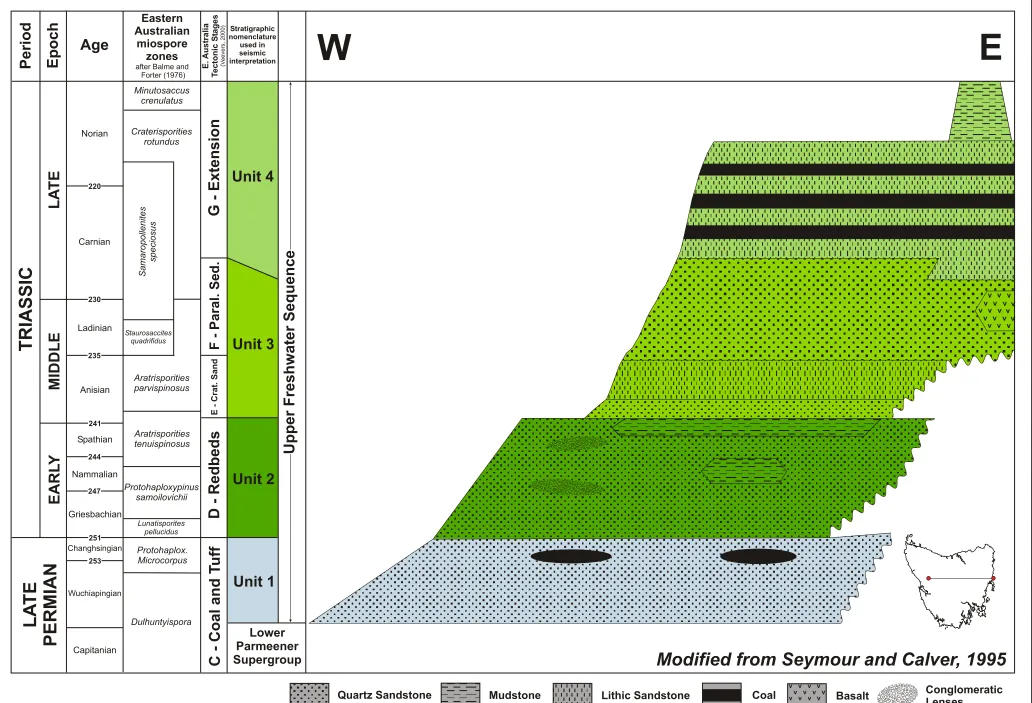
Figure 2.9: The generalised stratigraphy of the Upper Parmeener Supergroup………. 44
Figure 2.10: Palaeogeography of the Tasmania Basin during the deposition of the major units of the Upper Parmeener Supergroup……… 45
Figure 2.11: Mesozoic basins of Tasmania………. 53
Figure 2.12: Location and extent of the Launceston Tertiary Basin……… 57
Figure 2.13: Sub-basins of the Launceston Tertiary Basin………... 58
Figure 2.14: Distribution of Early to Middle Jurassic tholeiitic rocks in Gondwana…………... 62
Figure 2.15: Distribution of Jurassic Dolerite and Cretaceous Alkaline igneous rocks in Tasmania……… 64
CHAPTER 1
INTRODUCTION
1.1: PREAMBLE
Concerted exploration in pre-Carboniferous rocks of Tasmania’s west and northeast has yielded significant mineral discoveries, while exploration in the late Mesozoic to Cenozoic offshore basins have also shown significant potential and yielded hydrocarbons. In contrast, whether discouraged by the complex geology, the attitude of government or by poor results, there has only been intermittent exploration for hydrocarbons in onshore Tasmania, with many considering onshore Tasmania unprospective.
The main exploration interest lies in the Permo-Triassic Tasmania Basin, whose eroded remnant, often expressed as “Mesozoic cover sequences” on geological maps of Tasmania, covers more than 30 000 km2 across central and eastern Tasmania. The depth of erosion and the ubiquitous dolerite intrusions are a major risk. Other potential plays lie in the Early to Middle Palaeozoic fold-thrust belt beneath the basin. Our current understanding of petroleum systems in Tasmania has been gleaned mainly from outcrop at the margins of the basin and from a very few deep drill holes. The knowledge base is very limited. Onshore Tasmania has not been extensively explored using modern commercial and scientific methods and thus remains very much a frontier exploration province.
1.2: AIMS OF THIS STUDY
The main aims of this thesis are to:
1. identify the geometry and timing of folds and faults that affect the Permo-Triassic Tasmania Basin and the underlying Early-Middle Palaeozoic fold thrust belt,
2. examine the distribution of these structures, 3. identify potential hydrocarbon traps styles, and
4. discuss the structural history in terms of its implications for hydrocarbon prospectivity.
1.3: DATASETS, METHODS AND SOFTWARE TOOLS
The main datasets analysed were :
1. 662 line kilometres of regional 2D seismic data supplied by Great Southland Minerals, 2. Digital Elevation Model (DEM) at 25 m resolution supplied to the University of
Tasmania by the Department of Primary Industry, Water and Energy, Tasmania,
3. drill hole data sourced from reports and the Tasmanian Drill Hole Database (DORIS) by Mineral Resources Tasmania (MRT),
4. regional geological mapping at 1: 250 000, 1;50 000 and 1;63 360 scales, and 5. the measured gravity field over northern Tasmania.
These datasets were analysed using the following software products:
The seismic data was supplied in segy format and interpreted using Kingdom Suite™
software,
the pre-gridded DEM image was manipulated using ER Mapper™ image processing
software,
base-maps of the seismic survey area were prepared using Petrosys™, while ArcView™
has been used to view the DORIS database and create several other maps and images, and
Potent™ was used to model how changes in the thickness of dolerite sills affected the
1.4: LOCATIONS, MAPS AND SEISMIC SECTIONS
All maps presented in this thesis were produced using Universal Transmercator Projection, the datum is AGD 66 and AMG Zone 55. Grid references, where used are produced using this system. All the localities mentioned in the text are shown on Figure 1.1, a table of grid references for all of these localities is located in Appendix 1. In many instances a general geographic location is given rather then a specific locality, these geographic locations are presented in Figure 1.2.
All geological maps presented use the stratigraphic nomenclature and legend used by the 1: 250 000 scale geological maps produced by Mineral Resources Tasmania (Brown et al., 1995, Calver et al., 1995, Forsyth et al., 1995, McClenaghan and Calver, 1994). A modified version of this legend has been created, which applies to all geological maps included in this thesis. A copy of this legend (Figure 1.3) is located with Map 5.1.
Figure 1.2: Major geographical areas mentioned in the text.
1.5: EXPLORATION HISTORY
Modified from: McClenaghan, M. P. & Calver, C. R. (1994), Calver, C. R., Corbett, K. D., Everard, J. L.,
Goscombe, B. A. Pemberton, J & Seymour, D. B. (1995), Forsyth, S. M., Clarke, M. J., Calver, C. R.,
McClenaghan, M. P. & Corbett, K. D. (1995), Brown, A. V., Calver, C. R., Corbett, K. D.,
1:250,000 Geology of the TB01 Seismic Survey Area (Figure 1.3)
Pl Pu P Pc TRvv Pf Pt R
T TRv Rq T
TRvc Undifferentiated fluviolacustrine sequences of sandstone, siltstone and
mudstone R); dominantly lithic volcaniclastic sandstone Rv); lithic sandstone, siltstone, mudstone and felsic tuff with some coal and basal quartz sandstone Rvc); dominantly siltstone, lithic sandstone and mudstone Rvv); dominantly quartz sandstone Rq).
(T (T (T (T (T TRIASSIC
PERMIAN - LATE CARBONIFEROUS
Undifferentiated glacial, glaciomarine and non-marine sedimentary rocks (P);
freshwater sandstone with coal measures (Pc); upper glaciamarine sequences of pebbly mudstone, pebbly sandstone and limestone (Pu); freshwater and paralic sandstone and mudstone with some coal measures (Pf); lower glaciomarine sequences of mudstone, pebbly mudstone, pebbly sandstone, minor limestone and Tasmanite oil shale (Pl); basal tillite (Pt). LO
W ER U P P ER PA R M EE N ER S U P ER G R O U P Q U A TE R N A R Y H O LO C EN E P LE IS TO C EN E TERTIARY TQ Q Qpt Qpl Qh Qps
Qpg Glacial, periglacial and fluvial sediments including till andinterglacial deposits (Qp), Talus, vegetated and active (Qpt),
glacial and glaciogene deposits (Qpg), coastal sand and gravel (Qps) and limestone (Qpl) indicated.
Sand, gravel and mud of alluvial, lacustrine and littoral origin (Qh).
Erosional Surface
Ts Tf Tm
Tb
Dominantly non-marine sequences of gravel, sand, silt, clay and regolith (Ts);
marine limestone (Tm); ferricrete, laterite and derived lag deposits (Tf);
basalt (tholeiitic to alkalic) and related pyroclastic rocks (Tb). Qp CO COuc Ou C SDa SDf SDb SDc Ol SD COh COl COn COs WESTERN TASMANIA EARLY DEVONIAN - SILURIAN ORDOVICIAN LATE CAMBRIAN EL D O N G R O U P TI G E R R A N G E G R O U P D EN IS O N G R O U P O W EN G R O U P & C O R R E LA TE S W U R A W IN A S U P ER G R O U P MIDDLE CAMBRIAN
Angular unconformity in some areas, apparent conformity in others.
Pt
SSSSSSSSSSSSSSSSS
SSSSSSSSSSSSSSSSS
SSSSSSSSSSSSSSSSS
SSSSSSSSSSSSSSSSS
SSSSSSSSSSSSSSSSS
SSSSSSSSSSSSSSSSS
S
S
S Ptsg
Ptsl
Pts Undifferentiated metasedimentary sequences, with
greenschist facies metamorphism (Pt).
Dominantly quartzite sequences (Pts).
Platy or schistose micaceous quartzite (Ptsl).
Garnetiferous quartzite (Ptsg).
Dominantly pelitic sequences, mainly phyllite (Ptp).
Dolomite (Ptd). Cac
Caq Ca
Cas
Cdsv
WEST OF THE TAMAR RIVER
Db S Ol COu COuc Angular unconformity. W U R A W IN A S U P E R G R O U P Faulted Contacts Angular unconformity. Angular unconformity.
Cds Cda Cdsv
Ptp Pts Ptp ODq ODp OD Angular unconformity. EAST OF THE TAMAR RIVER
M A TH IN N A G R O U P
Early Ordovician to Early Devonian micaceous quartzwacke turbiditic sequences (O mudstone sequences (O
Dq);
Dp).
Pdv Mafic volcanoclastic
rocks (Pdv).
TERTIARY
JURASSIC
LATE - EARLY DEVONIAN IGNEOUS ROCKS Tb Jd Dgaf Dgafs Dgn Dgr
Basalt (tholeiitic to alkalic) and related pyroclastic rocks (Tb).
Dolerite (tholeiitic) and locally developed granophyre (Jd).
Dominantly alkali-feldspar granite, I-type(Dgaf); S-type (Dgafs).
Dominantly granodiorite/adamellite, (I-Type) (Dgn).
Dominantly granodiorite, I-type (Dgr).
Strike and dip of bedding: right way up; overturned; facing unknown; vertical with facing unknown. Strike and dip of cleavage: dipping; vertical.
Strike and dip of crenulation cleavage: dipping; vertical.
Direction and plunge of hinge line of minor folds: unspecified age; folding, cleavage or schistosity. Strike and dip of igneous mineral foliation: dipping; vertical; trend of foliation trace on horizontal surface. Geological boundary.
Fault.
Concealed fault.
Fault with relative downthrown side indicated. Thrust or reverse fault, teeth on upper plate. Strike and dip of schistosity or metamorphic foliation: dipping; vertical.
Wrench fault with relative displacement indicated.
Axial trace of major antiform. Axial trace of major synform.
P R O TE R O ZO IC C A IN O ZO IC M ES O ZO IC PA LA EO ZO IC Angular unconformity.
Undifferentiated shallow marine quartz sandstone, siltstone and shale (SD); siltstone, shale and fine-grained sandstone (SDb).
Shallow marine quartz sandstone (SDf).
Siltstone, shale and minor quartz sandstone (SDa).
Shallow marine quartz sandstone and pebbly conglomerate (S Dc).
Dominantly shallow marine limestone with minor siltstone and sandstone (Gordon Group) (Ol).
Undifferentiated or poorly constrained conglomerate sequences (CO).
Undifferentiated or poorly constrained, dominantly quartz sandstone sequences with rare fossils ( COu).
Dominantly calcareous sandstone and siltstone (COuc).
Thin bedded quartz sandstone, siltstone and minor conglomerate (COl).
Dominantly thick bedded siliceous conglomerate (COh).
Dominantly marine sandstone, micaceous siltstone and minor conglomerate (COn).
Dominantly siliceous conglomerate and pebble sandstone near Queenstown; dominantly quartzwacke turbidite and minor conglomerate near Adamsfield (COn).
Dominantly sedimentary sequences with minor volcanic material (Cds); some dominantly andesitic volcanics indicated (Cda); dominantly felsic volcanosedimentary sequences (Cdsv).
Undifferentiated conglomerate - sandstone sequences (Ca).
Dominantly conglomerate and lithic sandstone (Cas).
Dominantly quartzwacke and lithicwacke turbidite with rare fossils in some sequences (Caq).
To date the only hydrocarbons recovered from onshore Tasmania have been produced from the retorting of oil shale. Small deposits of Late Carboniferous Tasmanite Oil Shale have been mined intermittently in northern Tasmania since the 1860’s. A variety of fuels and fuel products were retorted during the 1930’s, without long term commercial success as the high production costs and high sulphur content made these products uncompetitive with imported oil.
Since 1915, over 200 licenses have been issued to search for oil and gas in Tasmania. Historically, exploration was been driven by reports of bitumen strandings and oil and gas seeps. Over 130 reports of seeps have been registered, the majority caused by agents other than naturally occurring hydrocarbons. Only one example, the seep at Lonnavale in southern Tasmania, has been confirmed as migrated hydrocarbons generated by a Tasmanian source. Over 40 holes have been drilled in the search for oil and gas, most drilled in the vicinity of seeps without detailed knowledge of stratigraphy or structure. Most of these wells were shallow, generally less then 350 m deep and bottom in Jurassic Dolerite.
The peak in exploration activity occurred in the 1920’s when the Commonwealth Government offered a ₤10 000 reward for the discovery of a payable oil deposit anywhere in Australia. This led to a number of holes being drilled in northern Tasmania. Gas was reported at 350 m in Bore 8 drilled near Sassafras by the Adelaide Oil Exploration Company (Bacon et al., 2000), however exploration was generally unsuccessful and the individuals and companies involved eventually turned their attention to oil-bearing substances such as oil shale and “Pelionite”.
and 1981 (Bacon et al., 2000). Interested in the Tertiary sequences they acquired gravity and seismic data, however, their interpretations indicated the thicknesses were insufficient to have generated hydrocarbons from any basal Tertiary sequence (Shaw, 1985).
Since 1984, GSLM and its predecessors have held several licenses in Tasmania. These companies have carried out numerous geochemical analyses on source rocks, seeps, tars and bitumens, acquired significant quantities of infill gravity and reconnaissance magnetic data over southern Tasmania and an experimental reflection seismic survey was conducted on North Bruny Island in 1987. From 1997, GSLM has acquired 662 line kilometres of seismic data in the TB01 survey and completed over 6000m of drilling a 8 locations including the stratigraphic holes on North Bruny Island (Shittim 1, 1751 m in 1997) and the Central Highlands (Hunterston 1, 1324 m in 2002). Initially, their exploration concentrated on oil generated from the Gordon Group. However, from their work two petroleum system concepts have evolved: a Larapintine Petroleum System in the Ordovician to Devonian Wurawina Supergroup and a Gondwana Petroleum System in the Permo-Triassic Parmeener Supergroup.
The generally poor exploration results achieved thus far suggest that onshore Tasmania is indeed unprospective. However as many wells have been drilled without any knowledge of stratigraphy or subsurface structure, such results are not surprising. In addition to Bore 8 at Sassafras, gas has also been reported from two holes drilled by the Department of Mines at Conara in 1963 and 1990. All these holes were drilled in Tertiary sediments and the gas is speculated to have originated from bands of decomposing vegetable matter (Bacon et al., 2000). Gas was also reported from another Mines Department hole at Douglas River, however analysis indicated the methane was biogenic. Methane and C2-C6 hydrocarbons, hydrogen and
helium have been detected in varying quantities from cuttings in the GSLM wells Shittim 1 and Jericho 1 drilled on Bruny Island and at Lonnavale 1 and Pelham 1 drilled in southern Tasmania (Burrett and Tanner, 1997).
1.6: PREVIOUS WORK
stratigraphic summary of the Parmeener Supergroup (Banks, 1989a, Clarke, 1989, Forsyth, 1989b). Whether because of ubiquitous dolerite outcrop, a lack interest by minerals and hydrocarbon explorers or both, the previous analysis of structures affecting the Tasmania Basin has generally been concentrated on the Launceston Tertiary Basin and the Tertiary grabens in southern of Tasmania. This section aims to present the previous work relating primarily to the structures affecting the Tasmania Basin, other work directly related to the analysis of the Digital Elevation Model and acquisition of seismic data is presented in Chapters 4 and 5. (Banks, 1989b, Forsyth, 1989a)
In northern Tasmania, Johnston (1874) used the name Launceston Tertiary Basin to describe the trough containing Tertiary sediments, which he interpreted as a Tertiary rift. A detailed structural study was made by Carey (1947), who concluded the rift consisted of two, Early Miocene graben separated by a central horst and that both the Tiers and Mt Arnon were pre- to syn-dolerite, i.e. Middle Jurassic or older.
The later structural interpretations in northern Tasmania are based on mapping and gravity data. Hinch (1965) was the first to conduct a gravity survey in the Cressy Area, interpreting two half-graben divided by a central horst. He concluded that faulting had begun in the Jurassic and continued through to the Tertiary when the grabens developed. Longman (1966) and Longman and Leaman (1971) generally agree with this model, while Mathews (1983) interprets a more symmetrical graben structure. All these workers agree that the major basin bounding faults have a Jurassic history, while the major faults within the basin were formed during the Tertiary.
Using newly acquired seismic data Lane (2002) concluded the Longford Sub-basin comprised a graben in the west and a half-graben in the east, separated by a central high along strike from Hummocky Hills. The basin was formed by Tertiary extension creating major northwest striking faults and minor northeast striking faults, which compartmentalise the basin. The western graben is interpreted to have formed first followed by the eastern half-graben.
Mapping commissioned by the Hydro-Electric Commission of Tasmania in the late 1940’s in the Central Highlands region is the first systematic evaluation of the geology and structure of the Tasmania Basin in this area. The Parmeener Supergroup in the areas around Great Lake, Arthur’s and Lake River was interpreted as flat-lying, broken up by steep normal faults of Early Miocene age (Voisey, 1948a, Voisey, 1948b). Fairbridge (1948) completed a more complex interpretation for the area around Waddamana, producing a cross-section showing tilting, steep normal and reverse faulting and folding of the Parmeener Supergroup and Jurassic Dolerite. The faults were interpreted to have both a pre- and post-dolerite history (Fairbridge, 1948).
Extensive, geological mapping by MRT and its predecessors from the mid 1960’s to the mid 1980’s in northern and central Tasmania confirms the Parmeener Supergroup is generally flat-lying throughout the region and has been affected by two major phases of faulting, one dolerite and a later Cretaceous to Tertiary phase. The authors all recognised faults with pre-dolerite movement, faults that were truncated by or intruded by sills, they also recognised faults which offset the dolerite sills (Longman, 1966, Pike et al., 1973b, Leaman, 1976, Forsyth, 1984, Mathews et al., 1996, Pike et al., 1973a, Forsyth et al., 1989).
striking northeast. This event was active before and after the Middle Jurassic dolerite intrusion. The models also indicate a subsequent phase of faulting produced by east to northeast extension in the early to middle Tertiary.
In summary, from numerous, well distributed studies the majority of workers report the Parmeener Supergroup as flat-lying with steep dips only occurring locally in the vicinity of faults. They also generally agree that the sequence has been affected by at least two major phases of faulting. The first occurring either prior to or concomitant with the intrusion of dolerite in the Middle Jurassic and resulting in normal, reverse and strike-slip movement, and the second in the Tertiary resulting in down to the east, normal faulting.
1.7: THESIS STRUCTURE
This thesis comprises eight chapters, two appendices and a series of maps and interpreted seismic sections in a separate map folder.
Chapter 1 is a general introduction to this work. It contains a background and states the reasons for and aims of this research. A description of the datasets, resources and tools utilised, an exploration history and an account of previous structural interpretations.
In Chapter 2, a detailed account of the regional geology is presented. This account includes new work on the Tasmania Basin which places the basin into its Gondwana context. The position of the basin in Gondwana and its relationship to adjacent basins is shown, with a new model for the basin presented. A summary of the stratigraphy of the Tasmania Basin has been undertaken. The stratigraphy and stratigraphic names vary across the basin and a detailed understanding is required to integrate stratigraphic data of different sources and vintage into a basin wide interpretation. This account is detailed and shows how the numerous stratigraphic units can be brought together in a simplified stratigraphic nomenclature that is applied to the entire basin.
Chapter 4 describes the use of high resolution Digital Elevation Model (DEM) with state-wide coverage to predict the pattern of Tertiary faulting in the Tasmania Basin. The resultant fault pattern is then used to make predictions regarding the nature of structures in the basement, especially in the region of the Tamar Fracture System. The DEM has been an important constraint to the seismic interpretation.
Chapters 5, 6 and 7 are concerned with the interpretation of the seismic dataset. The nature of the dataset and the methodology employed to interpret it, is outlined in Chapter 5. This chapter includes information on acquisition and processing, and suggestions as to why there is such variability in seismic data quality. The chapter also contains a description of the stratigraphic controls and constraints applied to the interpretation, including the results of a velocity survey undertaken as part of this research. Finally, Chapter 5 contains a thorough description of the nomenclature used in the seismic interpretation.
Chapter 6 is a detailed description of the seismic interpretation. The level of detail presented here is a reflection of the quality of the seismic data and the care taken during the interpretation process. This chapter aims to show the reasoning and constraint applied to the interpretation, especially in the many areas where the seismic data is ambiguous.
In Chapter 7 the results of the seismic interpretation are presented. The distribution and history of fault and fold generation in the Tertiary and Tasmania basins is described, while the basement is described in terms of three structural domains. The geometries of the Longford Sub-basin and Tasmania Basin derived from the seismic interpretation are compared with previous interpretations that were primarily based on outcrop and drill-hole data. Dolerite is recognised on all of the seismic sections and the intrusion geometry is described. Finally, the structures interpreted are described in terms of petroleum geology, i.e. the style of potential hydrocarbon traps and their distribution.
CHAPTER 2:
REGIONAL GEOLOGY
2.1: INTRODUCTION
The ?Mesoproterozoic basement of Tasmania is overlain by a Neoproterozoic passive margin
sequence. Deposition was interrupted by a major Cambrian arc-continent collision.
Ordovician to early Devonian, shallow-water sedimentation dominated across the Western
Tasmanian Terrane, while a turbidite succession built rapidly across eastern Tasmania
(Eastern Tasmania Terrane).
The eroded vestiges of the Late Carboniferous to Triassic Tasmania Basin cover
approximately half of Tasmania. The Late Carboniferous to Early Permian Lower Parmeener
Supergroup consists largely of glaciomarine sediments overlain by Triassic non-marine
sandstones and coal measures of the Upper Parmeener Supergroup. Large volumes of
tholeiitic dolerite intruded the Tasmania during the Middle Jurassic mainly as sills in the
Parmeener Supergroup.
The Sorell, Bass and Durroon basins were initiated in the latest Jurassic to Early Cretaceous
by extension related to rifting between Australia and Antarctica. By the Late Cretaceous,
spreading had begun in the Tasman Sea. The Bass Basin continued to propagate southwards,
extending onshore, opening the Tamar Graben in the latest Cretaceous, the Devonport-Port
Sorell Sub-basin in the Early Paleocene, and the Longford Sub-basin in the Late Paleocene.
On the west coast, the Sorell Basin extended onshore with the development of the Macquarie
Harbour Graben in the Late Paleocene. During the Late Paleocene-Early Eocene, Tasmania
was moving north along a left-lateral transform against Northern Victoria Land. In the
Eocene, Australian-Antarctic motion became more divergent along this margin (Royer and
2.2: PROTEROZOIC
Zircon inheritance in granites on King Island demonstrates that the basement of the Western
Tasmania Terrane is 1600 Ma old (Black et al., 2004a), although the western King Island
section may be an allochthonous element with no relationship to the larger scale history of
Tasmania. The Eastern Tasmania Terrane did not exist at this stage and Black et al. (2004)
identified the lower crust as less than 1000 million years old.
The early Neoproterozoic stratigraphy of northwest Tasmania is dominated by shallow water
siliciclastics (Rocky Cape Group in the north west, Clark Group in the south) and turbidites
(Burnie and Oonah Formations, Badger Head Block in the north) (Seymour and Calver,
1995). The age of these units is poorly constrained. The internal stratigraphy of the early
Neoproterozoic siliciclastic sequences varies dramatically. In the northwest there are three
basic facies varying from deep shelf through storm dominated shelf to massive quartzite
deposited above fair weather wave base. The Clark Group includes similar shallow marine
orthoquartzite units but has more carbonate units (Seymour and Calver, 1995).
The deep-water facies (Burnie and Oonah Formations) shallow up from classical turbidites to
storm-affected siliciclastics and carbonates.
A second extensional phase followed in the late Neoproterozoic, and possibly started as early
as 740 Ma (Adams et al., 1985, Calver and Walter, 2000). The base of the late Neoproterozoic
section is a regional-scale low angle (20˚) unconformity (Calver, 1998). A more intense
deformation (Wickham Orogeny) is recorded from King Island where there was polyphase
deformation and extensive granitoid intrusion at about 760 Ma (Cox, 1989, Turner et al.,
1998). The granites have intensely deformed aureoles, but are not linked to any larger scale
deformation features and may be related to rifting and the break-up of Rodinia (Holm et al.,
2003). The Wickham Orogeny may correlate with the low angle unconformity observed on
mainland Tasmania. (Holm et al., 2003)
The late Neoproterozoic rift sequence (e.g. Togari Group in northwest Tasmania) has an
initial siliciclastic shallow water section, followed by a lower dolomite and diamictite.
Subsequent widespread intrusion of tholeiitic dolerite dykes (Rocky Cape dyke swarm),
extrusion of tholeiitic basalt and associated volcanogenic sediments were followed by a
second dolomite section and finally marine siliciclastics (Brown, 1989, Turner, 1989,
Neoproterozoic rift sequence is in northwest Tasmania, and elsewhere only parts of the
section are known (Seymour and Calver, 1995, Calver, 1998). Calver & Walter (2000)
correlated the early dolomite with the Sturtian glaciation and the later dolomite with the
Marinoan glaciation. The late Neoproterozoic sequence is interpreted as a rift-drift facies
associated with the break-up of Rodinia (Crawford and Berry, 1992) or a second stage rift
event (Direen and Crawford, 2003).
The Neoproterozoic sequence in Tasmania has largely been considered “unmetamorphosed”,
but detailed petrographic descriptions of the basalt commonly include pumpellyite and to a
lesser extent prehnite. These units are best regarded as very low-grade metamorphic rocks.
The age of this metamorphism is problematic. No structural model developed so far explains
the inferred depth of burial (~10 km) of these rocks during either the Cambrian or the
Devonian orogeny.
2.3: EARLY TO MIDDLE CAMBRIAN
The Tyennan Orogeny in Tasmania was a complex event. The locus and style of deformation
changed very rapidly. At 520 Ma, Tasmania collided with an oceanic arc, and major slices of
fore-arc lithologies were thrust over the Proterozoic sedimentary rocks. The only
allochthonous element specifically identified by Berry & Crawford (1988) was the
mafic/ultramafic complexes. Other possible allochthonous elements identified since are the
Forth, Badger Head, Port Davey, Franklin, Mersey River and Arthur Metamorphic Complexes
(Meffre et al., 2000), and the Wings Sandstone (Black et al., 2004a). These blocks are
scattered across Tasmania lying structurally above the late Neoproterozoic rift facies and are
unconformably overlain by late Middle Cambrian and younger sedimentary rocks. The Arthur
Lineament was formed during the Tyennan Orogeny (Turner et al., 1998), but its tectonic
significance remains in doubt (Turner, 1989, Holm and Berry, 2002). This lineament forms
the western limit to allochthonous blocks in Tasmania and appears to mark the maximum
extent of the thrust complex. The early part of the thrust emplacement is recorded in high
temperature mylonites, and indicates thrusting towards the west (Berry 1989b). A major phase
of thrusting to the south is recorded in the amphibolite facies metamorphic rocks and
widespread cataclasites in western Tasmania (Berry et al., 1990, Findlay and Brown, 1992,
Findlay, 1993, Holm and Berry, 2002) and is interpreted as a second component of the
The second stage of the Tyennan Orogeny was a Middle Cambrian extensional event that
produced rapid subsidence, active syn-orogenic deposition and major post-collisional
felsic-dominated volcanism (Mt Read Volcanics). East-west extension is recorded in the
hydrothermal vein geometry and the Henty dyke swarm. The extensional phase was closely
followed, or may be coincident with, a north-south compressional event that produced
east-west-trending folds to the east of the Mt Read Volcanics.
Most of the folding in the Neoproterozoic rocks in Tasmania is correlated with the Tyennan
Orogeny. Two generations of early recumbent folding are recognised in allochthonous blocks
and high strain underlying elements. These are overprinted by upright north-south
(e.g. northwest Tasmania) or east-west (e.g. Tyennan block) folding and related high angle
reverse faults. West of the Arthur Lineament, upright folding and thrusting dominated the
Proterozoic (Seymour and Calver, 1995). The allochthonous units are scattered across the rest
of Tasmania and overly a variably deformed Neoproterozoic section.
2.4: LATE CAMBRIAN TO EARLY DEVONIAN
2.4.1: WURAWINA SUPERGROUP
In the Late Cambrian, the last phase of the Tyennan Orogeny inverted earlier extensional
faults (e.g. Henty Fault). Major reverse faults and upright, open, north trending folds were
formed in western Tasmania. This phase also caused uplift of the Tyennan block with
syn-orogenic sediments (Owen Conglomerate) accumulating in synclinal cores and other
structural depressions (Berry, 1994).
Following the Late Cambrian basin inversion western Tasmania was peneplained and a new
cycle of deposition began in the Middle Ordovician. This cycle has a thin basal sheet sand
followed by widespread intertidal to shallow marine tropical carbonate (Gordon Group) that is
overlain by a Silurian to Early Devonian shallow marine siliciclastic sequence (Tiger Range
Group) (Banks, 1989b).
2.4.2: MATHINNA SUPERGROUP
The Mathinna Supergroup was deposited in northeast Tasmania. The earliest unit, Stoney
Head Sandstone, is a proximal turbidite and is overlain by Middle Ordovician deep-water
mudstone unit. The Silurian and Early Devonian section is a highly variable turbidite section
(Baillie et al., 1989a). However, detrital zircon dating indicates this source was not the
Western Tasmania Terrane (Black et al., 2004b).
2.5: MIDDLE DEVONIAN TO LATE CARBONIFEROUS
Middle Devonian deformation (Tabberabberan Orogeny) (390 Ma: Black et al. 2004b) is
characterised by the complexity of fold orientations. In many areas, the fold geometry is
controlled by the Cambrian fold trends, which tightened during the Devonian (Figure 2.1).
This led to Devonian cleavage orientations that are not parallel to the axial plane of the folds
with which they are associated. In the north, east-west Cambrian folds were tightened. In the
west, north trending Cambrian folds were tightened with an associated
north-northwest-striking Devonian cleavage. North-northeast-trending folds, north of Tullah, are controlled by
the reactivation of the Henty Fault. This region acted as a transfer zone in the Devonian and
the north-northeast fold trend is probably a rotated north-trending Cambrian trend.
The subsequent north- to north-northeast-trending compression produced
west-northwest-trending folds and thrusts in the south, and northwest-striking thrusts and associated folds in
the north. On the west coast, there is an associated phase of brittle strike slip faulting
dominated by north-northeast-striking sinistral movement on the Henty Fault (Berry, 1989a).
(Berry, 1989b)
In northeast Tasmania, the early phase of deformation thrust the shallow-water West
Tasmania stratigraphy east across the deep-water section with recumbent folds in the
Georgetown area. This was followed by back thrusting, especially strong in the Beaconsfield
zone. A late stage of north-trending compression produced strike slip movement on some
faults and large-scale kinks (Goscombe et al., 1994).
The regional metamorphic grade associated with the Devonian orogeny is
prehnite-pumpellyite with local zones of greenschist facies in the vicinity of late syn- to post-orogenic
granites. Areas of very low grade metamorphism survive in the Western Tasmania Terrane at
Surprise Bay (Burrett, 1992) and in the Mathinna Supergroup on the far east coast at
Scamander (Patison et al., 2001).
Large-scale granitoid intrusion in northeast Tasmania started before the Devonian
deformation and continued after (400-380 Ma). The more restricted granite intrusions
scattered throughout western Tasmania and King Island, post-date peak deformation
(375-350 Ma: Black et al. 2004b).
2.5.1: TABBERABBERAN OROGENY AND THE TAMAR FRACTURE SYSTEM
Deposition of the Early Ordovician to Early Devonian Mathinna Supergroup in eastern
Tasmania was approximately coeval with the deposition of the Wurawina Supergroup in
western Tasmania (Seymour et al., 2006). The Mathinna Supergroup comprises turbiditic
sandstone and mudstone deposited in deepwater, while the Wurawina Supergroup comprises
shallow marine carbonates and siliciclastics. Folds in northeast Tasmania verge northeast,
while west of the Tamar Valley Devonian folds in the Sheffield Element verge southwest
(Williams, 1979, Williams, 1989, Seymour and Calver, 1995). Furthermore, the age of
granitoid intrusions in the is are generally younger than those of the granitoid batholiths in the
east (Williams et al., 1989). Current models suggest that eastern and western Tasmania may
have been substantially separated at the time of deposition of these two units