Rochester Institute of Technology
RIT Scholar Works
Theses
Thesis/Dissertation Collections
2017
Visual-Linguistic Semantic Alignment: Fusing
Human Gaze and Spoken Narratives for Image
Region Annotation
Preethi Vaidyanathan
Follow this and additional works at:
https://scholarworks.rit.edu/theses
This Dissertation is brought to you for free and open access by the Thesis/Dissertation Collections at RIT Scholar Works. It has been accepted for inclusion in Theses by an authorized administrator of RIT Scholar Works. For more information, please [email protected].
Recommended Citation
Visual-Linguistic Semantic Alignment: Fusing Human Gaze and
Spoken Narratives for Image Region Annotation
by
Preethi Vaidyanathan
M.S. Electrical Engg., Rochester Institute of Technology, 2009
B.Tech (equivalent to B.S.) Electronics Engg., KNMIET, India, 2007
A dissertation submitted in partial fulfillment of the
requirements for the degree of Doctor of Philosophy
in the Chester F. Carlson Center for Imaging Science
Rochester Institute of Technology
2017
Signature of the Author
Accepted by
CHESTER F. CARLSON CENTER FOR IMAGING SCIENCE
COLLEGE OF SCIENCE
ROCHESTER INSTITUTE OF TECHNOLOGY
ROCHESTER, NEW YORK
CERTIFICATE OF APPROVAL
Ph.D. DEGREE DISSERTATION
The Ph.D. Degree Dissertation of Preethi Vaidyanathan has been examined and approved by the
dissertation committee as satisfactory for the dissertation required for the
Ph.D. degree in Imaging Science
Dr. Jeff B. Pelz, Co-advisor
Dr. Rajendra Raj, External Chair
Dr. Cecilia O. Alm, Co-advisor
Dr. Emily T. Prud’hommeaux, Co-advisor
Dr. Anne R. Haake
Dr. Christopher Kanan
Date
Visual-Linguistic Semantic Alignment: Fusing Human Gaze and
Spoken Narratives for Image Region Annotation
by
Preethi Vaidyanathan
Submitted to the
Chester F. Carlson Center for Imaging Science in partial fulfillment of the requirements
for the Doctor of Philosophy Degree at the Rochester Institute of Technology
Abstract
Advanced image-based application systems such as image retrieval and visual question answering depend heavily on semantic image region annotation. However, improvements in image region annotation are limited because of our inability to understand how humans, the end users, process these images and image regions. In this work, we expand a framework for capturing image region annotations where interpreting an image is influenced by the end user’s visual perception skills, conceptual knowledge, and task-oriented goals. Human image understanding is reflected by individuals’ visual and linguistic behaviors, but the meaningful computational integration and interpretation of their multimodal representations (e.g. gaze, text) remain a challenge. Our work explores the hypothesis that eye movements can help us understand experts’ perceptual processes and that spoken language descriptions can reveal conceptual elements of image inspection tasks. We propose that there exists a meaningful relation between gaze, spoken narratives, and image content. Using unsupervised bitext alignment, we create meaningful mappings between participants’ eye movements (which reveal key areas of images) and spoken descriptions of those images. The resulting alignments are then used to annotate image regions with concept labels. Our alignment accuracy exceeds baseline alignments that are obtained using both simultaneous and a fixed-delay temporal correspondence. Additionally, comparison of alignment accuracy between a method that identifies clusters in the images based on eye movements and a method that identifies
iv
Acknowledgements
I would like to gratefully acknowledge the support, guidance, and encouragement of my doctoral advisor Dr. Jeff Pelz who believed in me at every step, even at times when I did not. I wish to express my indebtedness to my mentors Dr. Cecilia O. Alm who pushed me beyond my limits and shaped me into an independent researcher and Dr. Emily Prud’hommeaux, who provided valuable guidance on word alignment, data augmentation, and spoken language transcription. My gratitude extends to Dr. Anne Haake who laid the foundation of the research, and Dr. Christopher Kanan for sharing his dissertation experience and motivating me. Special thanks to Dr. Rajendra Raj for stepping in as my external chair and Drs. Pengcheng Shi and Cara Calvelli for their expert suggestions.
This dissertation would not have been possible without funding from the National Institutes of Health and National Science Foundation.
I sincerely thank Drs. Stefi Baum and David Messinger for giving me the opportunity to pursue my dreams. Special thanks to Sue Chan, Joyce French, Elizabeth Lockwood, Melanie Warren, and late Cindy Schultz, who were always eager to help and would cheer me up at difficult times. Also, the endless cookies and cakes provided by the MVRL and Carlson team contributed in keeping the energy going.
I also thank Mr. Dixon Cleveland and the family of LC Technologies for giving me the opportunity to do an internship. I was fortunate to gain more knowledge about eye tracking as well as witness the difference it can make in people’s lives.
My gratitude extends out to my colleagues Kathryn Womack, Dr. Rui Li, Sai Krishna Mulpuru, Dong Wang, Xuan Guo, Rakshit Kothari, Kamran Binaee, and Wilson McCoy with whom I have collaborated on various occasions and enjoyed working with. I also thank my friends Laura Sesma, Sravani Vaddi, Nikita Moharir, Ashima Chhabra, Renu Singh, Tusharika, and Varun Maurya.
These acknowledgements would not be complete if I did not mention my good friend Kate Walders who made sure I paid attention to physical fitness along with mental fitness and Ramin Djawadi for his music that kept me motivated during my Ph.D. pursuit. I thank my colleagues and friends for their encouragement, support, and most of all for keeping me smiling.
I must acknowledge with tremendous and deep thanks my mother Buvaneswari Vaidyanathan and father K. Vaidyanathan for giving me a good foundation with which to meet life, sister Priya Vaidyanathan who is more than a best friend, and brother-in-law
vi
To Chechappa, Bamu, Bapu, Parvathi, and Chitra.
Contents
1 Introduction 1
1.1 Contributions . . . 5
2 Previous Work 6 2.1 Challenges in image annotation . . . 6
2.2 Importance of capturing perceptual and conceptual expertise . . . 8
2.3 Need to integrate eye movements and spoken narratives . . . 9
2.4 Summary . . . 14
3 Eye Tracking and Spoken Description 15 3.1 Components of the experimental design . . . 15
3.2 Gaze-verbal data collection for experts (DERM I) . . . 18
3.3 Gaze data collection for novices (NOV) . . . 19
3.4 Gaze-verbal data collection for experts (DERM II) . . . 19
3.5 Fixations, narratives, and data quality . . . 20
3.6 Other studies with DERM I, II, and NOV . . . 23
3.7 Summary . . . 39
4 SNAG: Spoken Narratives and Gaze Dataset 40 4.1 Motivation . . . 40
4.2 Gaze-verbal data collection for general users . . . 40
4.3 Fixations, narratives, and data quality . . . 43
4.4 Summary . . . 47
5 Visual-Linguistic Alignment 48 5.1 Overview of framework . . . 48
CONTENTS ix
5.2 DERM II visual-linguistic alignments . . . 48
5.3 SNAG visual-linguistic alignments . . . 55
5.4 Reference alignments . . . 57
5.5 Baseline alignments . . . 59
5.6 Summary . . . 60
6 Results and Discussion 61 6.1 Evaluation of results . . . 61
6.2 Effect of parameters . . . 62
6.3 DERM II . . . 64
6.4 SNAG . . . 68
6.5 Summary . . . 76
7 Future Work and Conclusions 77
8 List of Publications 81
List of Figures
1.1 Concept figure showing image region annotation . . . 2
1.2 Hypothetical example illustrating the proposed idea . . . 3
3.1 Master-Apprentice model . . . 18
3.2 Multimodal data example . . . 21
3.3 Mean word types vs. mean word tokens for images for thederm iidataset 23 3.4 Mean word types, tokens and type-token ratio for observers in thederm ii dataset . . . 24
3.5 Fixation maps . . . 26
3.6 Eye movement differences through global statistics . . . 27
3.7 Ideal area under the curve (iAUC) . . . 28
3.8 Hypothetical fixations overlaid on image and recurrence plot . . . 31
3.9 Eye movement differences through global and local statistics . . . 32
3.10 Asynchrony between multimodal data . . . 34
3.11 Union, intersection, and SIFT plots . . . 36
3.12 Gaze and k-means algorithm . . . 37
3.13 Fixation ratio metric . . . 38
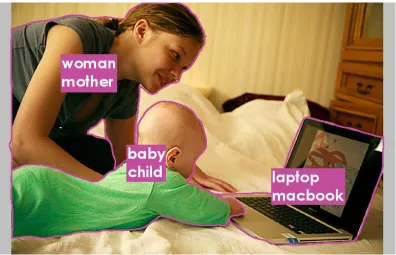
4.1 Example images frommscoco . . . 41
4.2 Data collection set-up for snagdataset . . . 42
4.3 Multimodal data example forsnag dataset . . . 43
4.4 Comparison of ASR output . . . 44
4.5 Mean word types vs. mean word tokens for images in thesnagdataset . . . 45
4.6 Mean word types, tokens and type-token ratio for observers in the snag dataset . . . 46
LIST OF FIGURES xi
5.1 The alignment-annotation framework . . . 49
5.2 Pre-processing steps for thederm ii data . . . 50
5.3 Segmentation methods used in derm iidataset . . . 51
5.4 Example of bitext alignment . . . 52
5.5 Example of sliding window for training data . . . 53
5.6 Training data example . . . 54
5.7 Pre-processing steps for thesnagdata . . . 55
5.8 Segmentation methods used in snagdataset . . . 56
5.9 GUI used to acquire reference alignments . . . 58
5.10 Example showing baseline alignments . . . 60
6.1 Framework output example . . . 62
6.2 Parameter effects on framework’s performance . . . 63
6.3 Output annotations forderm ii dataset . . . 64
6.4 Comparison of annotations for different cases in dermatology . . . 66
6.5 Comparison of correct and incorrect labels for MSFC . . . 67
6.6 Annotation output for the snagdataset . . . 70
6.7 Annotations for images with varying number of objects . . . 71
List of Tables
3.1 Example of raw data from eye tracker . . . 20
3.2 Calibration comparison forderm i,nov, and derm ii dataset . . . 22
3.3 First-order statistics for narratives in thederm iidataset . . . 22
4.1 Example of raw data from eye tracker . . . 42
4.2 Calibration comparison of all four dataset . . . 43
4.3 First-order statistics for narratives in thesnagdataset . . . 44
5.1 Linguistic units present in both the narratives and the images . . . 59
6.1 Comparison of alignment performance forderm ii dataset . . . 63
6.2 Comparison of alignment performance forsnagdataset . . . 69
6.3 Performance improvement over baselines forsnag dataset . . . 69
6.4 Alignment performance for different image categories . . . 72
6.5 Alignment performance trend comparison . . . 74
6.6 Correlation between MSFC clusters and performance metrics . . . 75
6.7 Framework performance for uncorrected vs. corrected narratives . . . 75
1
Introduction
Digital imaging has seen an exponential growth in the past decade with usage ranging from personal photos and social media to more complex applications in education and medicine. With advanced cameras, photographs (images) are not only used for capturing memory or evidence, but for facilitating decision making as well. For example, doctors use medical images to help diagnose and determine the treatment of diseases. Ideally, for computers to be able to assist humans in their reasoning and decision making process, they need to process these images as well as humans do. Intelligent computers should be capable of making inferences about what people look at and what they say about what they look at. Therefore, computers should be able to acquire and use learned associations. This is known as semantic image annotation, and when performed on images to identify objects or regions it is called semantic image region annotation. With this knowledge and learning, computers would be able to provide useful and detailed information about an object. For instance, when a user gazes at a painting in a museum, the computer can highlight areas of the painting where an expert artist looked at and provide more conceptual information about that area. This work integrates gaze and linguistic information indicating ‘what people look at’ and ‘what they say’, to identify the objects and their corresponding names or labels in images.
Automatic semantic image region annotation is the task of computationally identifying image regions that are perceptually meaningful for humans and associating them with appropriate natural language concept labels. It plays a key role in developing sophisticated image-based information systems but it is a difficult and long-standing problem [Smeulders et al., 2000, Zhang et al., 2012, Karpathy and Fei-Fei, 2015]. An example of
1. INTRODUCTION 2
Figure 1.1: Example illustrating the concept of image region annotation. The two-fold process involves identifying and segmenting correct regions in an image and labeling them correctly.
1. INTRODUCTION 3
Figure 1.2: Panels A and C show the eye fixation locations extracted from eye movements and lexical concepts (labels) obtained from spoken narratives, respectively, over a common time scale. This hypothetical example shows that the data collection session for this image took T seconds. Panel B shows the seven image regions that were looked at by the participant in the original image. The proposed algorithm will align words such as
1. INTRODUCTION 4
images, spoken language is the most natural and convenient instrument of expression. In this case co-captured image descriptions convey relevant meaning, particularly special knowledge and experience that the human observers possess. An important novelty of this work lies in the integration of human observers’ perceptual and conceptual knowledge using natural language processing (NLP) methods to annotate images.
People often have the intuition that when they look at an object and mention its name, they do so simultaneously. However, research in sentence production has shown that there is a variable amount of time between when a person looks at an object and when they name it aloud [Meyer et al., 1998, van der Meulen, 2003, Griffin, 2004]. Therefore, even when visual and linguistic information is co-captured we cannot assume that a fixation on a region will occur simultaneously with the verbal naming of the region. This lag, which can vary in length, demands more sophisticated methods.
The bitext word alignment method [Brown et al., 1993], widely used in machine translation, aligns the words of a sentence in one language with the word or words in another language that are likely to be translations. For our problem, the location of eye fixations on images are analyzed as visual units that encode visual regions while the spoken descriptions about the images contain the linguistic units. Prior work confirms the utility of associating words and sentences with images, objects and image regions, and videos [Forsyth et al., 2009, Kuznetsova et al., 2013, Kong et al., 2014, Socher et al., 2014, Thomason et al., 2014]. Many of these works rely on written description of general-domain images, making the framework difficult to translate to domain-specific images. This work, in contrast, focuses on building a framework that can be applied to any image dataset. Perceptual and conceptual information is combined via the integration of gaze and narratives to advance annotation of image regions.
1. INTRODUCTION 5
1.1
Contributions
The four main contributions of this work are as follows:
1. Show that human-elicited gaze and narratives jointly provide information that if considered separately would be insufficient to understand how humans perform image inspection and description tasks.
2. Exemplify the broad applicability of the visual-linguistic alignment framework by comprehensively using and evaluating it with both domain-specific and scaled-up general-domain image datasets.
3. Compare the performance of various image region segmentation techniques used to identify the visual units for the two datasets to illustrate the strengths and weaknesses both for the described framework and respective segmentation techniques.
4. Provide the research community with a large multimodal dataset comprised of co-captured gaze and spoken descriptions data collected during an image inspection task involving general-domain images.
2
Previous Work
2.1
Challenges in image annotation
The goal of this work is to automatically annotate images through the integration of end users’ perceptual and conceptual information with the information in the images. Research efforts in automatic image annotation can be categorized into three types of approaches [Zhang et al., 2012, Li et al., 2015]. The first approach involves manual annotations by humans using text [Tamura and Yokoya, 1984, Chang and Hsu, 1992]. This approach is brittle since as the number of images increases, manual annotation becomes impractical. The second approach annotates images using low-level features such as color, shape, and texture to index images [Saber et al., 1996, Jain and Vailaya, 1996, Sivic and Zisserman, 2003]. The third approach is more recent and attempts to bridge the semantic gap. It involves understanding images and learning the semantic concept models that can be used to label new images [Duygulu et al., 2002, Qu and Chai, 2008, Ballerini et al., 2009, Karpathy and Fei-Fei, 2015, Johnson et al., 2015].
Treisman and Gelade (1980) were the first to introduce the concept of semantic understanding of images. In their feature integration theory, they proposed that processing of image information is a dynamic interaction between bottom-up and top-down directed processes. The bottom-up process corresponds to the stimulus-driven discovery of low-level image information pieces whereas the top-down process is the user-driven processing of the discovered information pieces. The user-driven processing involves linking these disjoint information pieces into perceptually meaningful image concepts and objects.
In spite of the proposed integration theory, for a long time image annotation
2. PREVIOUS WORK 7
algorithms were built solely on low-level features such as color and texture to perform segmentation and retrieval [Saber et al., 1996, Shi and Malik, 2000]. Algorithms employing these low-level features succeeded in capturing basic statistics of natural scenes [Fei-Fei and Perona, 2005], identifying faces [Viola and Jones, 2004], or segmenting single objects in a scene [Kumar et al., 2010, Jaber and Saber, 2010] but were unable to deal with multiple objects in the scene, statistics of domain-related images, and other high-level processing tasks. For example, while the bottom-up methods helped in automatic detection and segmentation of objects in a scene, they did not provide the relationship between these objects or the contextual meaning of the scene [Li et al., 2009]. Recent researchers have had some success with generating image descriptions and semantic labeling [Kong et al., 2014, Karpathy and Fei-Fei, 2015, Yatskar et al., 2016]. However, their techniques cannot be easily translated to complex domains such as medicine.
To bridge the semantic gap, Duygulu et al. (2002) proposed the use of machine translation to combine image content with the accompanying text for object recognition [Duygulu et al., 2002]. Following this, other researchers proposed several integrating techniques using different mathematical approaches such as Bayesian methods, Latent Dirichlet Allocation and Latent Semantic Analysis methods [Barnard et al., 2003, Li and Wang, 2003, Berg et al., 2004b, Berg et al., 2004a]. Similarly, researchers proposed the use of deep learning to combine text and images for image annotation [Karpathy and Fei-Fei, 2015, Vinyals et al., 2014], as well as unsupervised alignment to align text instructions with video segments [Naim et al., ]. In their recent work, Johnson et al. (2015) suggested the use of neighboring test images and their annotations to disambiguate and annotate otherwise ambiguous images. These approaches bridge the semantic gap to a certain extent by bringing in multimodal information through images and text. However they do not involve speech or gaze data and are only successful on certain types of images failing to capture the semantics of images in complex domains. Qu and Chai extended the idea of using multimodal data by using speech and eye gaze that are more natural to elicit than traditional methods. However their application scenario is a 3D simulated scene with no real-life challenges such as occlusion to deal with [Qu and Chai, 2008].
2. PREVIOUS WORK 8
stage. For crucial applications such as clinical decision making or pilot training these methods are unreliable and demand approaches that incorporate more human intelligence [Stark and Privitera, 1997, Scheirer et al., 2014]. The works of Scheirer et al. (2014) emphasized that one needs to involve the human early on in the modeling process as opposed to using the human performance solely for validation of machine performance. In their work they used visual psychophysics to draw out information reflecting human capacity which they callperceptual annotation and combine it with image features to build a better face detector [Scheirer et al., 2014]. Motivated by the body of prior research, our work proposes to fuse naturally obtained multimodal visual-linguistic data from experts and build a semantic image region annotation framework over it.
2.2
Importance of capturing perceptual and conceptual
expertise
An integral component of this study is the use of eye movements and spoken narratives to elicit human expertise or knowledge. Eye movements can be considered pointers to the perceptually important regions of an image while spoken narratives can reveal conceptual elements associated with those regions. Capturing perceptual and conceptual information relevant to the image processing system’s end user’s goal is of paramount importance to improve the annotation of images. Image-information systems must be reliable enough to assist in goal-oriented performance [M¨uller et al., 2004]. End users may not merely seek images or regions that have similar low-level features such as color or texture but they may want to locate, classify, or segment an image based on high-level reasoning features. Moreover, in domain-specific images, such as medical images, low-level features do not sufficiently capture the subtle but key attributes that are crucial for decision making in the visual domain of interest [Tang et al., 1999].
2. PREVIOUS WORK 9
test and observed faster responses and higher accuracy in highly skilled players [Gabbett and Abernethy, 2013]. In the field of radiology as well, through expert-novice comparison it is evident that novices tend to categorize objects first at the general level whereas experts show a preference to identify objects at a more specific level [Tanaka et al., 2005, Hoffman and Fiore, 2007]. Moreover, in their study with radiologists, Hoffman and Fiore (2007) reported that experts can perceive certain aspects that are literally invisible to the novice. Similarly, Krupinski (2000) showed that perceptual skills exhibited by radiologists when searching medical images do not necessarily transfer to a more general task such as “Where’s Waldo” where one has to search for a character called Waldo among other similar looking characters. Therefore the same expert of one field could be a novice in another area, implying that investigation into expertise-related differences must be done in a domain or task-specific manner.
Researchers use various knowledge elicitation methods to capture human users’ expertise. One of the most common methods is interviewing and asking participants to describe the decision making process through the think-aloud protocol. One problem with this method is that it will only produce what an expert can verbalize as an answer to the particular question [Shadbolt and Smart, 2015]. It also requires the expert to perform a secondary task in parallel with the primary task. Any non-verbalizable information is lost such as where these experts look in the image. Another widely used technique is to ask the experts to manually mark important regions in images, etc., [Shyu et al., 1999, Wang et al., 2012b]. The drawback with this technique is the loss of any information pertaining to how the expert arrived at that decision, i.e. information in the image that the expert used to decide where to mark. This work uses eye movements and spoken language as they are non-invasive and more natural tools that enable us to draw out the tacit perceptual and conceptual information of humans.
2.3
Need to integrate eye movements and spoken narratives
2. PREVIOUS WORK 10
initial stages of visual attention, meaningful content of the image soon comes into play [Stark and Privitera, 1997]. As a result eye movement behavior can differ with the change in task even if the stimuli remain the same [Yarbus, 1965, Yarbus et al., 1967]. Recent studies suggest that top-down processes influence visual perception more than bottom-up processes in real tasks [Castelhano et al., 2009]. Although eye movements cannot completely reveal complex cognitive processes, empirical studies have established relationships between visual perception and recognition. Walther et al. (2005) used visual attention to learn to recognize objects in cluttered indoor and outdoor scenes. Likewise, Mishra et al. (2009) used eye movements to aid their segmentation algorithm. Eye movements have also been used to annotate video frames of paper printing and stapling tasks [Yu and Ballard, 2004a].
Analogously, researchers in psycholinguistics have used language to understand certain aspects of human psychology. Natural language is a fundamental knowledge representation system, and spoken narratives can indicate viewers’ focus of attention [Ji and Ploux, 2003]. Researchers have previously used verbal narratives to investigate the process of language production in simple day-to-day tasks and storytelling [Meyer et al., 1998, Holsanova, 2006]. Language is also used by researchers in computer vision to caption images and video frames [Karpathy and Fei-Fei, 2015, Naim et al., , Naim et al., ]. Through simultaneous multimodal gaze-verbal capture higher-level conceptual knowledge of the expert can be added to the eye movements for analysis.
Empirical experiments have shown that eye movements are closely time-locked with human language processing [Just and Carpenter, 1976, Ferreira and Tanenhaus, 2007, Griffin, 2004]. Linguists, for instance scholars active in psycholinguistics, have used eye movements as a tool to understand language. Similarly, eye movement researchers have incorporated linguistic input into their studies. Just and Carpenter (1980) described how measures like fixation duration changed depending on the linguistic characteristics of the text being read. Soon Frazier and Rayner (1982) pioneered the use of eye movements to understand written language and syntactic processing. During the following two decades numerous contributions were made by researchers who used eye movements as a tool to reveal the way written language is processed [Heller, 1988, Pollatsek et al., 1993, Rayner, 1998].
2. PREVIOUS WORK 11
people understand spoken language by measuring people’s eye movements while listening to verbal commands and executing them. Richardson and Dale (2005) conducted a study to understand the coupling between speakers and listeners, reporting that the interlocutors’ eye movements were closely time-locked. Another study showed that eye movements can be used to understand the stages of language comprehension such as hearing a command, interpreting it, and engaging in resolving and executing commands [Kaiser and Trueswell, 2008]. Such prior works revealed that a relation between cognition, vision, and language exists and that by integrating eye movements and spoken narratives, an understanding of cognitively complex tasks can be obtained.
Inspired by language comprehension studies, Cooper (1974) used eye movements to investigate language production. He observed that participants’ fixations were generated before the end of words they used in narration. Similarly, Meyer et al. (1998) investigated sentence generation and fixation duration during simple noun phrases and found that people fixated the next object only after lexically encoding, but before executing the prior word. Authors also observed that mean viewing time for speakers was significantly longer for objects with low frequency names (names that were not used very often) than with high frequency names (names used very often). This is particularly interesting because our work focuses on modeling the visual-linguistic relation and prior research has revealed that factors such as frequency of a name can play an important role. In another study, van der Meulen (2003) observed that participants fixated the objects to be named in the order of mention and once just before naming. This indicates that speech is performed in an incremental fashion, i.e. speakers tend to look at the objects they are about to find words for in the same order in which the object names were mentioned in the utterance.
2. PREVIOUS WORK 12
understand how complex noun phrases are produced and if the production process was similar to that of simple noun phrases [Shao et al., 2013].
The above findings indicate that vision and language are tightly integrated. In 1964, Kirsch published a paper that attempted to combine the two cognitive modalities to understand semantic processing. His work combined lexical and visual data from newspaper photographs and briefly laid the ground for studying the two together. Although there were other researchers who performed studies along the same lines [Badler, 1975, Waltz, 1980, Herzog and Wazinski, 1994], the focus shifted away from understanding the interactions of the two modalities until 1995 when Srihari investigated the correspondence problem and visual semantics [Srihari, 1995]. In the following years there was an increased interest in developing methods to integrate language and vision and understand how human cognition works, including a proposed technique to integrate the two modalities using the mutual information model [Roy, 2000, Roy and Pentland, 2002]. Several researchers investigated the multimodal integration problem in relation to sentence prediction and object naming in scenic images [Coco and Keller, 2012, Clarke et al., 2013, Yun et al., 2013a, Yun et al., 2013b]. While these works were successful in infant-directed interactions or on scenic images it is not clear that they would translate successfully to complex scenarios such as clinical decision making.
Although there is some relationship between the timing of eye movements and spoken narratives, an exact or fixed-delay temporal match indicating that a fixation on a region will occur simultaneously or after a fixed time interval with the verbal naming of the region cannot be assumed. Holsanova (2006) studied the interaction of vision and language over time by investigating the dynamics of picture viewing and picture description. Her research revealed that correspondence between the spoken words and the objects in the scene could be of different types, e.g. one-to-one or many-to-one [Holsanova, 2008]. These findings partly confirm hypotheses such as the existence of a temporal relationship between when objects are gazed upon and when their names are uttered but lack any quantitative validity or technical modeling that could be used in automated systems. An important concern that arises from prior research is how feasible it is to use temporal correlation to model the temporal relation between eye movements and language given that there are various factors that affect this relation. Therefore, we need to employ other techniques such as bitext alignment, which is widely used in machine translation to align words in one language to their corresponding translations in another language.
2. PREVIOUS WORK 13
in scenes [Duygulu et al., 2002]. They segmented images into regions and clustered them into region types that they referred to as blobs. Further, expectation-maximization was used to learn the mapping between the blobs and the keywords for a given image. However, the image regions or blobs and keywords were obtained using image segmentation methods and a large vocabulary from captions without any human-elicited eye movements and spoken narratives. A similar technique was used by other scholars to automatically match words to the corresponding pictures [Barnard et al., 2003], faces in pictures to names [Berg et al., 2004a, Berg et al., 2004b], and natural language instructions to video frames for a particular task [Naim et al., ]. Jamieson et al. (2006) addressed the problem of grouping image features, namely SIFT (scale-invariant feature transform) features, by associating them with the names of objects appearing in cluttered scenes obtained through captioning. Qu and Chai (2008) proposed that a modified IBM translation model II [Brown et al., 1993] together with perceptual information and observer’s domain semantic information expressed using spoken language could be helpful in interpreting unexpected user language inputs in conversational systems. They applied this idea to computer-generated videos involving 3D objects in a room scene where the participants were asked various questions about the decoration of the 3D simulated room. Their work provides an interesting factor of including domain knowledge into the translation model. However, the use of a 3D simulated room scene with objects simplifies many challenges faced when dealing with complex real-life scenarios.
2. PREVIOUS WORK 14
six [Yu and Ballard, 2004a] participants and three trivial video stimuli. Primarily, Yu and Ballard explored object annotation with images that had uniform background and consisted of distinct objects that were trivial to segment. It is also unclear whether their work could be easily generalized or extended to other domains such as medical image inspection. Lastly, Yu and Ballard’s work does not provide a clearer evaluation and baseline comparison. Motivated by their work, we investigate multimodal image region annotation with images that do not have uniform background and consist of image regions including skin lesions that are difficult to segment. We explore the annotation task using two larger datasets consisting of images from general-domain and specific-domain, respectively, as well as provide baseline comparison.
2.4
Summary
3
Eye Tracking and Spoken
Description
This chapter begins by briefly describing the components of the experimental design in section 3.1. Four IRB-approved eye tracking studies were conducted as part of this work. Sections 3.2, 3.3, and 3.4 describe three of the eye tracking studies conducted with a larger research team, with the detailed description of the fourth study, specific to this work, in Chapter 4. Section 3.5 provides insight into the data quality and Section 3.6 discusses some preliminary results obtained using the collected data.
3.1
Components of the experimental design
In this section we briefly introduce eye tracking, spoken description, our approach to elicit natural data from participants.
3.1.1 Eye tracking
Visual perception is an active dynamic process in which the viewer seeks out specific information to support ongoing cognitive and behavioral activity [Malcolm and Henderson, 2010]. Visual perception can be divided into two main phases, low-level vision and high-level vision. Low-level vision incorporates gathering of visual information from the outside world, such as extracting object boundaries or color, which is then transmitted to the visual cortex for further processing. High-level vision is concerned with problems such as object recognition and classification that involves appropriate
3. EYE TRACKING AND SPOKEN DESCRIPTION 16
interpretation of the information obtained from low-level vision [Ullman, 2000]. Both these phases are intertwined temporally in cognitive processes and are crucial components of perceptual skill. Humans integrate the low-level information gathered through their vision system (e.g. eye movements) with high-level knowledge in their mind to perform the reasoning process. By tracking human experts’ eye movements we can investigate where they focus their attention over time and what perceptual strategies they employ during image inspection. Therefore, eye movements of humans can be used to extract useful information about complex cognitive processes.
The eye moves frequently, shifting the gaze to subsequently foveate different portions of the world. There are two key concepts in eye movements that will be referred to frequently in this work: (1) saccade - a type of eye movement, and (2) fixation - a state of the eye when gaze is relatively stable. Fixations occur when a stationary observer is viewing a static object. Other types of eye movements include smooth pursuit, vergence, and vestibulo-ocular eye movements.Smooth pursuit movements occur when a stationary observer smoothly pursues a moving object [Leigh and Zee, 2015]. Leigh and Zee describe
vergence movements as the movements that allow rotation of the two eyes simultaneously in the same or opposite directions so that gaze can be shifted between different depth planes. Vestibulo-ocular movements are reflex movements that come into play when the observer is in motion [Leigh and Zee, 2015]. When an observer fixates at an object and moves their head the eyes rotate in the opposite direction of the head to compensate for the head movement. Since our data collection process involves stationary observers viewing static images, we focus on fixations and saccades.
1. Saccade:A saccade is a ballistic eye movement that observers make to shift their point of regard. On average a person makes about 150,000 saccades a day and can execute about 2-4 saccades per second [Phillips and Edelman, 2008]. Although we move our eyes frequently, we do not consciously perceive the image motion resulting from saccades.
2. Fixation:The saccades are separated by fixations, periods of retinal image stability when we obtain high resolution information about the visual environment. The duration of a fixation depends on participants’ interest in the visual region but typically ranges from 200 to 400 ms and can vary with the underlying task [Pelz and Canosa, 2001, Lipps and Pelz, 2004].
3. EYE TRACKING AND SPOKEN DESCRIPTION 17
eye trackers to collect eye movement data. Remote eye trackers are typically placed more than 50 cm from the participant, and hence, are not invasive. The majority of trackers use infrared to illuminate the eyes and can be binocular or monocular. Depending on where the infrared illuminator is placed with respect to the image capturing camera, eye trackers can be categorized as bright pupil or dark pupil. More information about various types of eye trackers can be found in Duchowski’s recent textbook [Duchowski, 2017].
A calibration procedure is usually required in eye tracking to collect enough information about the participant’s eye to accurately predict the gaze point and to account for the individuality of the participant. It is the process through which the eye tracker measures characteristics such as shape of the participant’s eyes and the relative position of the fovea. During calibration a participant is required to look at some known points within the scene while certain eye features are captured (depending on the eye tracking technique) for each point. Some researchers include a validation procedure after calibration to determine the participant’s calibration accuracy and if the validation indicates (using a machine or manually defined threshold) unacceptable accuracy, the calibration procedure is repeated.
3.1.2 Spoken descriptions
Conceptual knowledge of a human is not directly observable but capturing observers’ spoken descriptions of images during image inspection can give insight into their conceptual reasoning process. Transcribed spoken narratives can be analyzed at various levels depending on the goal of the analysis. Narratives can be segmented into paragraphs, utterances, word tokens, morphemes, and other units of analysis. In this work we record verbal data and transcribe them.
3.1.3 Master-Apprentice approach
3. EYE TRACKING AND SPOKEN DESCRIPTION 18
Figure 3.1: Master-Apprentice approach: Here the domain expert (right) is the Master
sitting in front of the eye-tracker which is located underneath the computer screen displaying the images. In this case, a Physician Assistant student (left) is theApprentice
who does not talk during the experiment.
the traditional think-aloud paradigm because ‘teaching’ in this context feels more natural than ‘thinking out loud,’ a task that observers often need to be reminded to continue.
3.2
Gaze-verbal data collection for experts (DERM I)
3. EYE TRACKING AND SPOKEN DESCRIPTION 19
32×22 degrees on the display. We used SensoMotoric Instruments (SMI) RED remote eye-tracker attached to the above display, as shown in Figure 3.1, and running at 50Hz to collect gaze data. The reported accuracy of the RED eye-tracker is 0.5 degree. It monitors the position of a participant’s point of regard on the image in a non-intrusive way. We use a double computer set-up wherein one of the computers was used to present the image and the other ran the software iViewX gaze tracking system and Experiment Center 2.3. The dermatologists were instructed to “examine and describe each image verbally as if teaching the trainee sitting next to you to make a diagnosis based on the image.” A nine point calibration followed by a four point validation was conducted after every 10 images with a re-calibration done, if necessary. In addition, we recorded verbal narratives using an Olympus VN-6000 Digital Voice handheld recorder. It was small and convenient but not high quality. This dataset is referred to asderm idataset in this thesis.
3.3
Gaze data collection for novices (NOV)
The second experiment included 15 undergraduate students with no medical training recruited from Rochester Institute of Technology. Eight of the images from the original
derm i dataset were judged to be too disturbing for a non-medical audience, and were
removed, leaving a subset of 42 images for the second study. The eye-tracker set-up and calibration routine were identical to that used in the collection of thederm idataset. In
order to replicate as closely as possible the conditions of the physician group in thederm i
dataset, the undergraduates in the novice group were instructed to “examine and describe each image as if you are describing it over the phone to a dermatologist who cannot see the image but has to diagnose it.” No verbal data were collected in this experiment. This dataset is referred to as the novdataset in this thesis indicating it involves novices with
respect to dermatology.
3.4
Gaze-verbal data collection for experts (DERM II)
3. EYE TRACKING AND SPOKEN DESCRIPTION 20 Table 3.1: Sample raw data as obtained from SMI eye tracker showing from left to right: system timestamp, left-eye horizontal and vertical fixation locations, right-eye horizontal and vertical locations, left-eye and right-eye event, respectively.
Time Lx[px] Ly[px] Rx[px] Ry[px] L Event R Event
7456470899 919.19 504.03 919.19 504.03 Fixation Fixation
differential diagnosis, a final diagnosis as well the certainty of their final diagnosis expressed as a percentage, while their eye movements and verbal narratives were being recorded. For the calibration routine, we performed a validation after every 5 images and re-calibration was performed only if the participants’ validation error was more than one degree. The 50Hz SMI remote eye-tracker was replaced with a 250Hz SMI remote eye-tracker. The 250Hz tracker results in higher number of samples and also uses a velocity-based saccade detection algorithm to find saccades more accurately as compared to the dispersion-based algorithm used in the 50Hz. A blank gray slide and a test slide with a small, visible target with an invisible trigger area of interest were inserted between every two stimuli. Using a gray slide ensured that the gaze on one image did not influence the gaze on the following image. The test slide helped us measure (post-experiment) the drift in eye movement accuracy that takes place over time. Measuring the distance between the participants’ fixation at the center target and the actual location of the center target provided us with information regarding drifting (due to participants’ movement) that may have occurred. We used a TASCAM DR-100MKII audio recorder with a lapel microphone to collect the audio recordings as opposed to the recorder used in derm i data collection. The rest of
the eye-tracking set-up was similar toderm i data collection. This dataset is referred to
asderm ii dataset in this thesis and is used in the visual-linguistic alignment framework.
3.5
Fixations, narratives, and data quality
3. EYE TRACKING AND SPOKEN DESCRIPTION 21
Figure 3.2: Example of multimodal data. On the left is the transcription of the spoken description. On the right is the eye movement data overlaid on the image. The radius of the red circles represent the amount of time spent fixating that location and the red lines represent change of fixation location i.e. a saccade.
Narratives: We manually transcribed and time-aligned the spoken description recordings at the word level for both the derm i and derm ii datasets using Praat, a
software package for speech analysis [Boersma, 2002]. An example of transcribed verbal description from the derm ii dataset is shown in Figure 3.2 (left). As mentioned earlier
no verbal data was collected for thenov dataset.
Data quality: Since the accuracy of eye trackers is not exactly as stated by the manufacturer [Wang et al., 2012a], we analyzed the sets of collected eye movement data for calibration errors. For each study, we calculate the mean calibration accuracy in the horizontal and vertical direction for every participant by averaging over the participants’ calibration data. Following this the overall mean and the standard deviation across all the participants is calculated for the two directions respectively. Participants whose means in both directions were within two standard deviations of the overall mean in that direction were included in further analysis. Using the calibration method for data quality, we selected 75%, 100%, and 86% participants of the total in derm i, nov, and derm ii dataset,
respectively. Some participants and images were not considered for further analysis for reasons such as unacceptable calibration accuracy, accidental loss of eye movement or verbal data, and too much noise. The overall mean and standard deviation in the two directions for the three dataset after removing participants with poor calibration along with final number of images used is shown in Table 3.2.
We performed first-order descriptive analysis of the gaze and spoken description data for the derm ii dataset. Average fixation duration across the 26 observers was 320
3. EYE TRACKING AND SPOKEN DESCRIPTION 22 Table 3.2: Mean calibration accuracy after participants with poor calibration were removed for the three datasets (all values are in degrees) The last two columns of this table show the number of participants and images used in further data analysis.
Dataset X Mean X SD Y Mean Y SD Participants Images
derm i 0.51 0.13 0.51 0.09 12 (75%) 50 nov 0.63 0.29 0.70 0.14 12 (100%) 34 derm ii 0.71 0.16 0.81 0.23 26 (86%) 29
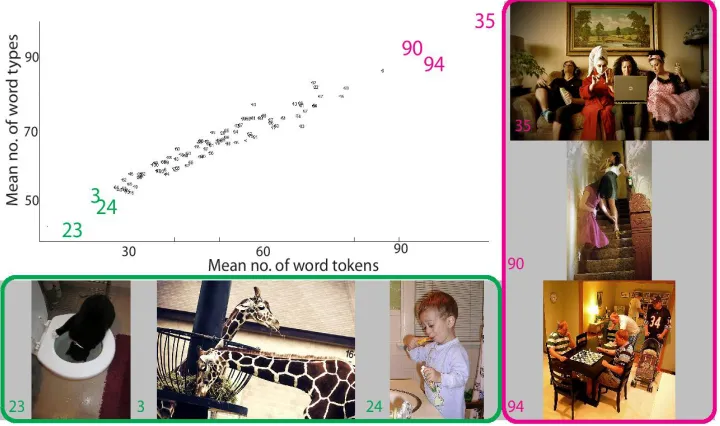
Table 3.3: Mean, standard deviation, minimum, and maximum number of word tokens, word types, and type-token-ratio across the 754 narratives (26 observers, 29 images) for thederm iidataset. The high value of mean type-token ratio with a low value of standard
deviation suggests high lexical diversity.
Mean SD Min. Max.
No. of Tokens 80 39 16 264
No. of Types 56 21 14 128
Type-Token Ratio 0.74 0.09 0.48 1
3. EYE TRACKING AND SPOKEN DESCRIPTION 23
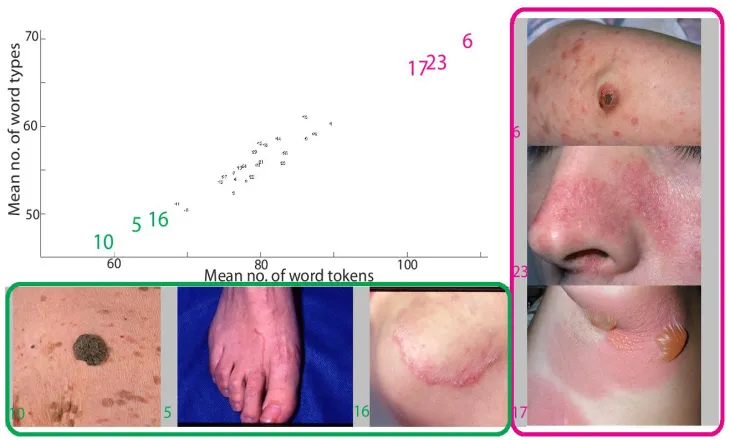
Figure 3.3: Scatter plot showing mean word types vs. mean word tokens for each image across all observers in thederm iidataset. Each image is a data point. Highlighted images
are shown at the bottom (green) and on the right (magenta).
ratio. Additionally, the experts were instructed to describe as if they would diagnose which could have also contributed to the high values of mean type-token ratio. Figure 3.4 shows the mean number of word tokens, word types, and type-token ratio for each observer across all the images. The high values of type-token ratio suggest lexical richness and heterogeneity present in the descriptions provided by the observers.
3.6
Other studies with DERM I, II, and NOV
Before embarking on multimodal alignment, thederm iandnovdataset were thoroughly
explored.
The verbal data from the derm i dataset led to some interesting work about
3. EYE TRACKING AND SPOKEN DESCRIPTION 24
Figure 3.4: Bar plot showing the mean number of word tokens, word types, and type-token ratio (TTR) for each observer across the 29 images in thederm iidataset. All the observers
have a mean type-token ratio greater than 0.6 suggesting stronger lexical diversity.
and explore the differences [Li et al., 2012, Li et al., 2013, Li et al., 2016]. In addition, Guo et al. (2014a) used the gaze and verbal data to design a human-centered image retrieval application [Guo et al., 2014a]. Guo et al. (2014b) also studied the narrative data. The verbal data from the derm ii dataset was also used to shed light on physician decision
making [Hochberg et al., 2014a] as well as automate the process of annotation of those styles [Hochberg et al., 2014b]. Bullard et al. (2014) used the derm ii dataset to model
physicians’ diagnostic confidence and self-awareness.
In the following subsections we discuss preliminary work performed using the two datasets that motivated the alignment-annotation framework. We first introduce some technical concepts that are helpful to understand the preliminary work and related findings.
3.6.1 Technical concepts
3. EYE TRACKING AND SPOKEN DESCRIPTION 25
fixation and the surrounding region. Using BeGaze 3.1.117 software from the SMI package [Sensomotoric Instruments, 2016], x, y locations of fixations on the stimuli and their corresponding durations are obtained. Thesex, y locations indicate where on the stimuli the participant gazed at a point in time. To visualize this, a value of 1 is assigned tox, y
pixel coordinates that were fixated and 0 to the rest of the image coordinates resulting in a binaryfixation plot; see Figure 3.5(b). Since the fovea is not a single pixel but subtends a larger area, a simple binary plot would not be appropriate to represent the region over which visual information is acquired during the fixation. Therefore, to approximate the fovea, a 2D Gaussian kernel of size σhorizontal = 2, σvertical = 3 degrees is convolved
with the binary plot to yield a grayscale map representing regions of visual information [Wooding, 2002]. The intensity of the darkness of the regions are further weighted by the individual fixation durations and finally normalized by dividing each value by the maximum to range from 0 to 1. The resulting continuous heatmap overlaid on the original image as shown in Figure 3.5(c) is called the fixation map. The standard deviations in the two directions for the kernel are not the same because, generally in eye tracking, a participant’s eyes tend to drift more in the vertical direction. Union maps are generated by adding every participant’s fixations maps and normalizing, per image. These union maps illustrate pixels fixated by one or more participants. Likewise intersection maps are generated by taking the area in the union map shared by at least 80% of the participants. Most of the results discussed in the following sections were obtained using binary fixation maps unless stated otherwise.
Area Under the Curve (AUC): Receiver operating curves (ROC) can be used as a metric to evaluate how well one participant’s fixations match another participant or a group of participants [Green and Swets, 1966]. In this method the fixation map of any participant or a group of participants is treated as a binary classifier on every pixel in the image. The fixations of the participant or group to be compared are used as ground truth. By varying the threshold, the ROC curve is drawn as the false positive rate vs. true positive rate and the area under this curve (AUC) indicates how well the fixation map ranks a ground truth fixation with values ranging from 0.5 (chance performance) to 1 (ideal performance).
3. EYE TRACKING AND SPOKEN DESCRIPTION 26
Figure 3.5: Panel (a) the original image showing melanoma on foot; Panel (b) participant’s fixations (blue) overlaid on the image: the blue locations are assigned 1 and others 0 creating a binary map; Panel (c) the participant’s fixations from Panel (b) convolved with a Gaussian to obtain a heatmap overlaid on the original image.
luminance channelL, a red-green opponent channela, and a yellow-blue opponent channel
b.Labspace has been widely accepted and shown to be effective for differentiating between lesioned and normal skin [Shin et al., 2002, Bosman et al., 2010].
Scale Invariant Feature Transform (SIFT): The SIFT algorithm extracts distinctive features in an image or video that are invariant to image scale and rotation [Lowe, 1999]. The image data is transformed into scale-invariant coordinates with respect to local features. Firstly, interest points that are invariant to scale and orientation are identified. In the next step, interest points are tested for stability and keypoints are selected based on the measures of their stability. Each keypoint is then assigned with one or more orientations based on the local image gradient directions. Finally, local image gradients around each keypoint are transformed into a set of descriptors that are invariant to shape distortion and range of illumination.
3.6.2 Importance of eliciting perceptual behavior of experts
3. EYE TRACKING AND SPOKEN DESCRIPTION 27
Figure 3.6: Box plots for median fixation duration and saccade amplitude for the experts and novices. Notice that experts tend to have longer fixation durations and saccade amplitudes compared to novices.
the derm i dataset so that the analysis is performed on the same set of images. Both
groups respectively comprised data for 12 participants.
For the experts and novices, the median fixation duration and saccade amplitude over all images and all participants were calculated separately. Figure 3.6 shows that for the novice group these two metrics were lower than for the expert group. On each box, the central mark is the median, the edges of the box are the 25th and 75th percentiles. The whiskers extend to the most extreme datapoints that are not considered as outliers. The outliers are plotted individually. A two-tailed Student’s t-test indicated that these differences were significant (p <0.05).
While these measures indicate a difference between the two groups they are not strong enough to rule out the null hypothesis that the two groups are not different. Also, more than one type of comparison metric is required to compare different aspects of eye movement behavior [Riche et al., 2013]. For this purpose two other measures were used namely ideal area under the curve (iAUC) and recurrence quantification analysis (RQA). They are discussed below.
3. EYE TRACKING AND SPOKEN DESCRIPTION 28
Figure 3.7: Histogram of ideal Area under the Curve (iAUC) values averaged over 34 images.
of iAUC was used in the following way to investigate the existence of differences between dermatology experts group (derm i) and undergraduate novices group (nov). Taking one group at a time, for a given image:
1. A grayscale Gaussian fixation map for a participant is generated at a time using the method described above. This is the Test Eye Map.
2. Next, the x-y fixation coordinates of the remaining n-1 participants in the same expertise group are accumulated and a binary map is generated by assigning 1 to the locations specified by the accumulated x-y coordinates and 0 to the rest of the pixels. This is referred to as the Ground Truth Eye Map.
3. With the above two maps the AUC is calculated in the traditional way as described above for the participant. This is done for all the participants and an average over all the participants is calculated.
4. This is done for all the images in the dataset and the average across images is calculated resulting in a single value of iAUC for a group.
3. EYE TRACKING AND SPOKEN DESCRIPTION 29
None of the above measures take into account the crucial temporal order of the eye movement sequences (referred to as fixation patterns). The temporal order differences in global and local temporal fixation patterns between the two groups were explored using recurrence quantification analysis (RQA). Classical RQA is a technique to investigate the time evolution of data series widely used in describing complex dynamic systems [Webber and Zbilut, 1994]. Recently cross-recurrence analysis has been used to investigate the coupling between speakers’ and listeners’ eye movements [Richardson and Dale, 2005]. The RQA method and measures have been used to investigate the differences in the spatial and temporal characteristics of expert and novice eye movement behavior [Anderson et al., 2013]. A brief description of the method that takes fixation duration into account is provided below.
For a fixation sequence fi and corresponding durations ti, i = 1, . . . N, two fixations
(i, j) are recurrent if they are within certain distance of each other and a recurrence plot (visualization technique) is created by assigning the sum of the corresponding durations to the positioni,j:
rij =
ti+tj, d(fi, fj)≤ρ.
0, otherwise.
(3.1)
whered is the distance metric andρ is the radius, i.e. the maximum distance between two fixations to be considered recurrent. Distance can be defined in various ways. This study used Euclidean distance with radiusρ = 64 pixels, approximately 1.5◦ visual angle for our experimental setup. The value approximates the size of the fovea and tracker error in the employed eye tracker. For calculations only the upper triangle is taken into account since the recurrence plot is symmetric and the diagonal does not provide additional information.
These plots provide useful visualization of the temporal behavior of a participants’ eye movements. The four RQA measures used by Anderson et al. and explored in this work are:
recurrence,determinism,laminarity and center for recurrence mass. The recurrence and center for recurrence mass measures are rather global temporal fixation sequences whereas local patterns are captured by determinism and laminarity. The sum of recurrences in the upper triangle is defined as R = PN−1
i=1
PN
j=i+1rij, and T = PNi=1ti is the sum of
the fixation durations used for normalization purposes. Each RQA measure quantifies a certain aspect of the fixation sequence and is defined as:
3. EYE TRACKING AND SPOKEN DESCRIPTION 30
often a location is refixated.
REC = 100 R
(N−1)T (3.2)
Determinism (DET): Determinism measures how often participants repeat short subsequences in their overall fixation sequence. Recurrent points in the plot can form diagonal lines (DL) that indicate repetition of short subsequences. For example if a
participant looks back and forth between two locations creating a repeated pattern, those fixations would constitute a diagonal line. The reported results were calculated using L = 2 (other line lengths showed similar results).
DET = 100
R
X
(i,j)∈DL
rij (3.3)
Laminarity (LAM): Recurrent points can also form vertical (VL) and horizontal (HL)
lines. Since the plot is symmetrical, vertical and horizontal lines in the upper half of the plot are the same as horizontal and vertical lines in the bottom half, respectively. A vertical line (upper half) indicates detailed rescanning of a location that was previously fixated with a single fixation. On the other hand, a horizontal line (upper half) shows brief refixation to a location that was previously scanned in detail with multiple fixations. Together the horizontal and vertical lines are used to calculate what is called laminarity
representing revisited locations in the scene.
LAM = 100
2R
X
(i,j)∈HL rij +
X
i,j∈VL rij
(3.4)
Center of recurrence mass (CORM): This measure quantifies the temporal distribution of the recurrent points. A small CORM value would mean that most of the refixations occurred very close in time whereas a large CORM value shows that refixations were widely separated in time.
CORM = 100
PN−1
i=1
PN
j=i+1(j−i)rij
(N−1)2T (3.5)
3. EYE TRACKING AND SPOKEN DESCRIPTION 31
Figure 3.8: Left: Hypothetical fixation sequence overlaid on the image to illustrate the RQA method. Numbers represent fixation order; circles represent a radius of 64 pixels. Right: Recurrence plot for the scanpath shown on the left. The black squares represent recurring fixations which means they were within 64 pixel radius of each other. Examples of diagonal line fordeterminism (solid green box) and of horizontal and vertical lines for
laminarity (dotted red and dashed blue boxes) are indicated.
Recurrence: Significant difference between experts and novices was observed with recurrence for experts being lower than recurrence for novices as shown in Figure 3.9. This shows that expert dermatologists tend to refixate previously inspected areas less often than novices suggesting that perceptual expertise probably helps experts to quickly obtain the required information pertaining to a region thereby requiring less rescanning.
Determinism: The results suggest that experts repeat short sequences of fixations less often than novices. The rank-sum test indicates that the difference is significant and that determinism is higher among novices.
Laminarity: Experts were observed to be significantly lower in laminarity than were novices, indicating that they had fewer instances of repeated fixations within a relatively small region (defined byρ).
Center of recurrence mass: CORM values among experts were significantly higher, indicating that experts refixated regions after longer intervals than did the novices. A probable reason is that experts fixate regions at the beginning of the trial and then revisit those regions towards the end when confirming their final diagnosis [Li et al., 2012].
3. EYE TRACKING AND SPOKEN DESCRIPTION 32
Figure 3.9: Comparison of RQA measures between experts and novices: recurrence, determinism and laminarity are significantly lower for experts than novices; center of recurrence mass was higher for experts. These results indicate that experts refixate or repeat their scanpaths less often and that most of their refixations occur widely separated in time.
along with higher number of fixations per second for the novice group suggests that novices are quickly scanning the scene with less strategy thereby having low fixation duration for individual fixations. On the other hand experts have longer fixation durations meaning they spend enough time on individual fixations to extract the useful information. This supports the low values of RQA measures except for CORM indicating involvement of different type of perceptual strategy by experts in comparison to novices. When viewing dermatology images the high values of CORM could mean that experts initially inspect regions that are most informative or important, then fixate regions that might help them further in their diagnostic path followed by refixations to confirm their inferences. The sensitivity of the analysis to the parameters L andρwas also tested. The significance tests were unaffected by variations in these parameters.
3. EYE TRACKING AND SPOKEN DESCRIPTION 33
these results differences in the RQA measures between attending physicians and in-training residents were examined. Due to unequal sample size an iterative test was conducted by comparing the 3 residents with 3 randomly selected attendings. Differences observed were not significant for all the iterations and depended on the individual attending. Larger sample size and statistically stronger tools are required to validate if differences exists between these two groups.
These results suggest that perceptual behavior of experts in a domain can provide additional cognitive information relevant to the user’s end goal and benefit the image understanding system, which is the ultimate aim of this work. These results were published by Vaidyanathan et al. [2014].
3.6.3 Multimodal asynchrony
Researchers have investigated how linguistic and visual information are integrated during language processing [Ferreira and Tanenhaus, 2007, Ferreira and Henderson, 2004, Holsanova, 2006]. An observation from prior research is that people do not verbally mention an object’s name at the same time as they look at it [Meyer et al., 1998, Griffin, 2004]. To understand if this asynchrony exists in our visual-verbal dermatology datasetderm iand what factors might influence it we analyzed a subset of eye movement
data in the following way.
The subset comprised of eye movement data for dermatologists inspecting 12 dermatological images. An expert dermatologist selected the 12 images with 6 images that were easy to diagnose and 6 images that were difficult to diagnose. For each image, two concrete, frequent clinical attributes, namely primary morphology (e.g. papule) and
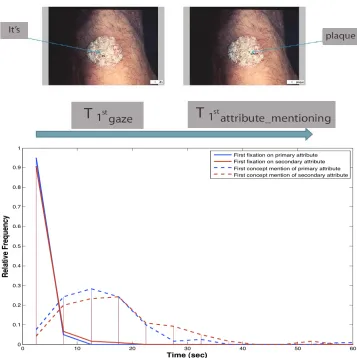
secondary morphology(e.g.scale) were selected for analysis. Automatic identification of the true image regions that represent these clinical attributes is a challenging task. Therefore, to identify these regions accurately manual annotations were used in this case. An expert dermatologist marked the image regions that depicted each attribute. The asynchrony was calculated as the difference between the first time (T1stgaze) the physician gazed in the
marked region and thefirst mention (T1stattribute mentioning) of the corresponding attribute
(Figure 3.10 (top)).
3. EYE TRACKING AND SPOKEN DESCRIPTION 34
3. EYE TRACKING AND SPOKEN DESCRIPTION 35
and image complexity on the asynchrony. There was a significant effect of both the type of clinical attribute and image complexity on the asynchrony at thep <0.05 level. Also, the primary attribute showed a shorter time-lag than the secondary attribute suggesting that dermatology experts name the primary attribute prior more quickly than they name the secondary attribute. This further indicates that such variables should be taken into account when modeling the temporal relation between the two modalities.
Additionally, participants spent on average 3 seconds inspecting the image before they began to talk. This suggests that physicians might be trying to obtain an initial holistic view of the image and plan their speech prior to execution. Figure 3.10 (top) shows how the asynchrony measure can be calculated. Figure 3.10 (bottom) illustrates that physicians looked at the regions depicting the two attributes at about the same time but mention the primary attribute prior to mentioning the secondary attribute. This could be because of how they were taught to perform the diagnoses.
These results bring into focus various factors that affect the temporal relation between visual and linguistic information processing. This demands further investigation into mechanisms to fuse information from the two modalities. These results were published by Vaidyanathan et al. [2012, 2013].
3.6.4 Image processing algorithms and multimodal data
We also performed a qualitative comparison of the well-known local feature descriptor called Scale Invariant Feature Transform (SIFT) with the collected fixation data. The union and intersection plots of physicians’ visual fixations for two images from thederm idataset are shown in Figure 3.11. The union plots were quite similar to the local feature
plots. The intersection plots, on the other hand, provided ROIs that are potentially most diagnostic. Data indicate that physicians, due to image center-bias which is an observer’s tendency to look at the center of an image [Tatler, 2007], fixate near the center of images for the first few fixations. However, they are very quickly drawn towards the regions of interest. There is a strong connection between lesion location and the eye movements suggesting that during image inspection the effect of viewer center bias is drastically reduced. Results from this analysis suggest that SIFT feature descriptors have moderate amount of overlap with eye movement locations and can potentially be useful in the identification of regions of interest when dealing with large datasets.
3. EYE TRACKING AND SPOKEN DESCRIPTION 36
Figure 3.11: Illustration of (a, b) Union of all participants’ fixations; (c, d) intersection of 80% of all participants’ fixations; (e, f) SIFT plots for the two cases of psoriasis and pemphigus vulgaris, respectively.
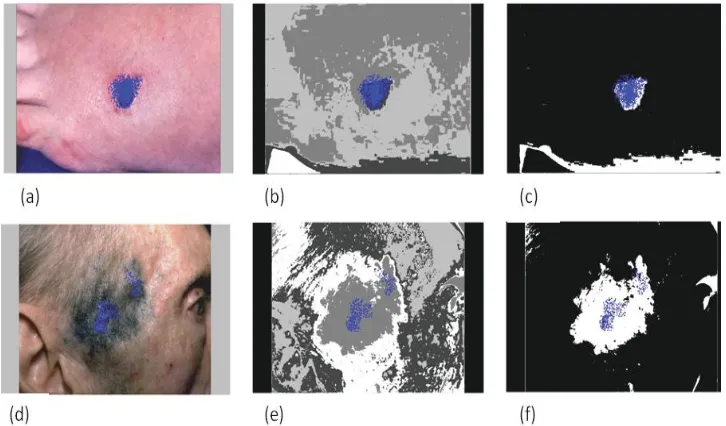
to eye movements, the number of these descriptors is huge; thus gaze data can be used to filter unwanted descriptors. In an attempt to achieve this, a correlation between perceptually-relevant image regions obtained through eye movements and individual clusters of image regions identified throughk-means clustering was investigated. Judging the segmentation output for various values of k visually, a value of k = 4 was selected because higher values lead to oversegmentation. CIELAB color space and the data from the derm i were used. To measure the correlation between participants’ gaze and the
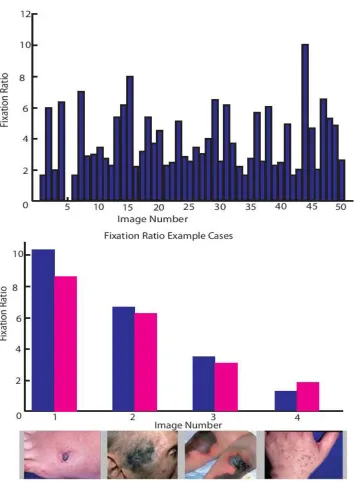
segmented image regions, a metric called fixation ratio was defined. This metric was useful in capturing the cluster that would most effectively segment the primary region (lesion) in the image. For each image we calculated the fixation ratio as follows:
1. The originalRGB images were converted into CIELAB and a-b vectors were used as input for thek-means algorithm, dividing each image into 4 clusters. This generated a segmentation map for each of the 50 images, each with four clusters.
3. EYE TRACKING AND SPOKEN DESCRIPTION 37
Figure 3.12: Panels (a, d) fixations (blue dots) overlaid on original images. Panels (b, e) fixations (blue dots) overlaid on the segmentation maps of panel (a) and panel (d) respectively. Panels (c, f) cluster picked using the fixation ratio measure.
map to obtain the number of fixations falling in each cluster.
3. These fixations were normalized by the total number of fixations in the intersection map, generating relative fixations per cluster.
4. Similarly, the relative area per cluster for the segmentation map was obtained.
5. Fixation ratio for every cluster was obtained by dividing the relative fixation from step 3 by relative area from step 4.
Visualization of the intersection fixation data overlaid on the segmentation map as shown in Figure 3.12 illustrates thatk-means was effective in isolating the primary region (lesion) with high visual interest to the physicians. The high relative fixation on one of the clusters shown in Figure 3.12 and low relative area resulted in a high fixation ratio that also provided a quantitative measure to select this cluster as the most perceptually relevant.
Figure 3.13(a) shows the fixation ratio value of