Detecting the attributes of a wheat crop using digital imagery
acquired from a low-altitude platform
T. Jensen1, 2, *, A. Apan2, F. Young2 and L. Zeller1
1 Emerging Technologies, Department of Primary Industries and Fisheries, PO Box 102
Toowoomba QLD 4350 AUSTRALIA
2 Faculty of Engineering and Surveying & Australian Centre for Sustainable Catchments,
University of Southern Queensland, Toowoomba QLD 4350 AUSTRALIA
* Corresponding author: [email protected] phone +61 7 46881307 fax +61 7
46881192 Abstract
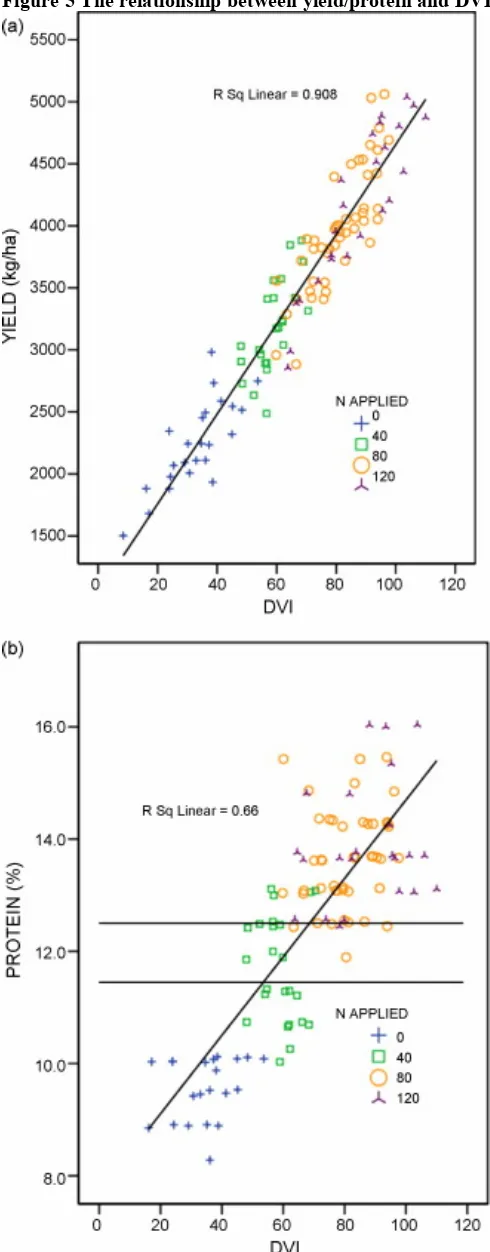
A low-altitude platform utilising a 1.8-m diameter tethered helium balloon was used to position a multispectral sensor, consisting of two digital cameras, above a fertiliser trial plot where wheat (Triticum spp.) was being grown. Located in Cecil Plains, Queensland, Australia, the plot was a long-term fertiliser trial being conducted by a fertiliser company to monitor the response of crops to various levels of nutrition. The different levels of nutrition were achieved by varying nitrogen application rates between 0-120 units of N at 40 unit increments. Each plot had received the same application rate for 10 years. Colour and near-infrared images were acquired that captured the whole 2 ha plot. These images were examined and relationships sought between the captured digital information and the crop parameters imaged at anthesis and the at-harvest quality and quantity parameters. The statistical analysis techniques used were correlation analysis, discriminant analysis, and partial least squares regression. A high correlation was found between the image and yield (R2 = 0.91) and a moderate correlation between the image and grain protein content (R2 = 0.66). The utility of the system could be extended by choosing a more mobile platform. This would increase the potential for the system to be used to diagnose the causes of the variability and allow remediation, and/or to segregate the crop at harvest to meet certain quality parameters.
Keywords: grain protein, grain yield, low altitude, digital camera
This is the authors’ final pre-print version of:
Jensen, Troy and Apan, Armando and Young, Frank and Zeller, Lez (2007) Detecting the attributes of a wheat crop using digital 3D imagery acquired from a low-altitude platform.
1. Introduction
Considerable research has been conducted using satellite and aircraft based imagery to observe cropping areas. Studies have used remotely sensed images for yield prediction (Layrol, et al. 2000; Staggenborg and Taylor 2000), pest and disease detection (Roth 1993), crop modelling (Barnes, et al. 1997), and measuring crop growth parameters (Price and Bausch 1995). However, imagery acquired from satellite platforms are often confined by repeat cycle, availability, cloud cover, cost and spatial resolution limitations (Zhang, et al. 2002) . Airborne sensors offer much greater flexibility than satellite platforms by being able to operate under clouds and having a much finer spatial resolution (Lamb and Brown 2001). However, this type of imagery is still costly when dedicated ‘mobilisation’ of the aircraft is required, especially for remote localities and repeated data acquisition needs. There have been several occurrences of low altitude aerial platforms being reported as research tools to collect imagery. A cable-supported and helium balloon platform has been used to record temporal changes in surficial environments (Baker, et al. 2004). Kites and balloons were used to map periglacial geomorphology in Alaska (Boike and Yoshikawa 2003). Blimps have been used to map spatial variability between and within agricultural (rice and soybean) fields (Inoue, et al. 2000) and to monitor gully erosion (Ries and Marzolff 2003). Remote-control helicopters were used to generate maps of crop status (Sugiura, et al. 2005) and model aircraft were used as the platform to remotely sense crop biomass and nitrogen status (Hunt Jr., et al. 2005). Additionally, a high altitude unmanned aerial vehicle was used to monitor crop ripeness and weeds in a coffee plantation (Herwitz, et al. 2004).
Although digital cameras have been used on aerial platforms since the early 1990s (Everitt, et al. 1995), recent technological developments in sensors and miniaturisation of systems offer new innovative applications for tactical level farming. Thus, the aim of this study was to investigate the potential of detecting and mapping grain crop attributes using digital imagery acquired from a low-altitude platform (i.e. a helium-filled balloon). The specific attributes mapped were grain yield and, more particularly, grain protein levels. If surrogates for these parameters of cereal grain can be discovered during the growing season, interventions to crop management would be possible. Alternatively, segregating grain at harvest to maintain quality has the potential to return the greatest profit to the farmer.
2. Materials and methods
2.1 Sensor and platform system
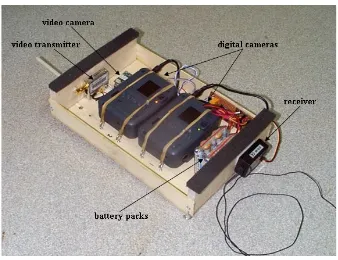
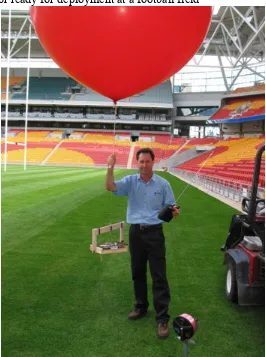
controlled with two tether lines. The sensor prior to deployment at a test site is shown in Figure 2.
Figure 1 The various components of the sensor system.
Figure 2 The sensor ready for deployment at a football field
In order to conserve power, the cameras would automatically power down after 5 minutes of inactivity and, as a result, would fail to take images. To avoid one or both cameras failing to trigger, a feedback and re-initialisation system was developed. The system was based on the light emitting diode (LED) on the rear of the camera that indicated the operational state of the cameras. The LED has three states: (1) LED is continuously energized - camera is ready for image acquisition, (2) LED is intermittently energized (at a frequency of approximately 1 Hz) - camera is processing and storing an image, and (3) LED is not energized - camera is not powered, the memory is full, or some other problem. A photo-transistor was positioned over this LED and a micro-controller used to monitor the state of each LED, and hence the camera readiness. If the micro-controller encountered a problem (i.e. anything other than a ready signal), the power would be disconnected from both digital cameras and the video camera for four seconds. This video interruption provided a visual feedback to the operator and allowed the cameras to power down and reboot ready for the next image acquisition. This ensured matching images from the pair of cameras.
(VIS) wavelengths (approximately 400 to 700 nm) and the other camera captured the near infrared (NIR) information (700 to 1050 nm). For the NIR camera, the visible wavelengths of light were excluded by the use of a ‘Hoya R72’ filter (details available from www.hoyaoptics.com). The specifications of this filter state that it cuts out all light below 700 nm. There is a near-linear ramp to 750 nm at which point approximately 90% of all available light is transmitted. This transmission rate continues up to and beyond 2600 nm. The total weight of the system was 1.0 kg, had a run time of two hours and could store 200 images (each image approximately 300 kb) per camera.
2.2 Study area
The study area was located at the ‘Colonsay’ fertiliser trial site (170 m x 120 m), in the Cecil Plains district of southeastern Queensland (151°54′ E, -27°40′ S), Australia. During the 2003 winter crop season, it was planted with cereal wheat (Triticum spp.). The site was a long-term fertiliser trial where N, P and S were varied. The nitrogen application rates varied between 0-120 units of N at 40 unit increments. The same fertiliser rates had been applied for 10 years resulting in preplant available N rates varying between 5 kg/ha at the 0 applied plots to over 150 kg/ha at the 120 applied plots. The starting moisture was uniform across all plots tested. There were 120 plots in total, with 3 replicates in a randomised design. A large range of agronomic measurements were taken, including the amount of fertiliser applied, soil analysis (nutritional information and water content) at planting, and harvest parameters (grain yield and protein content). This paper focused on the relationships between these harvest parameters and imagery.
2.3 Deployment
The balloon was inflated with balloon-grade helium and tied off with a soft cotton string. The balloon was attached to the stabilizing frame (see Figure 2) with 100 kg breaking-strain trace wire. The stabilizing frame was constructed of balsa wood and served to attach the tether lines to the balloon. In addition, the frame provided a location where the sensor was suspended and hung under the force of gravity. To stop the sensor from rotating freely beneath the frame, the rotation was restricted to ± 15o by the use of a slack light nylon line that was treaded through the sensor and attached to the two stabiliser arms. The two tether lines, each with 25 kg breaking strain nylon fishing line, were attached to each arm.
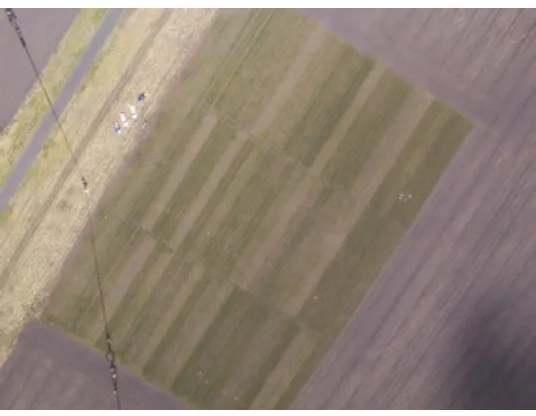
The images were transferred and viewed on a laptop computer while at the location and later to a desktop computer where the most appropriate images were chosen for further processing. One of these images is shown in Figure 3. Images were geo-referenced using 20 ground control points that were collected with a differentially corrected global positioning system (GPS) at the time of image acquisition.The resulting ground resolution of the sensor was approximately 0.25 m when flown at an altitude of 400 m above ground level.
Figure 3 One of the colour images collected above the trial site.
2.4 Data pre-processing and analysis
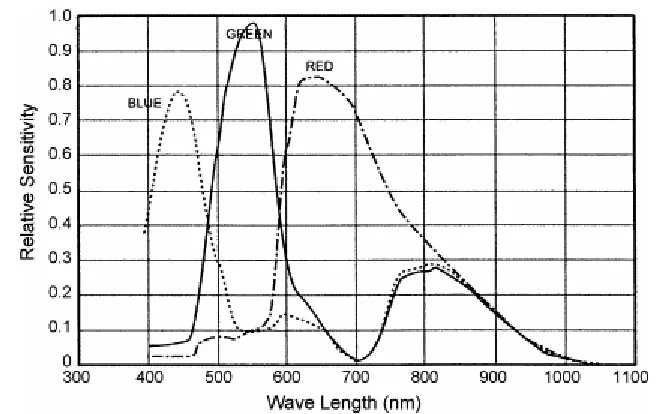
Figure 4 The spectral response for a typical CCD (sourced from www.pulnix.com).
An analogue-to-digital converter turns each pixel's value into a digital value or digital number (DN) which is then stored by the camera. An image processing package ERDAS IMAGINE® 8.7 (Leica Geosystems GIS & Mapping LLC - Norcross, GA, USA) was used to extract the digital number from the stored camera information. Digital number values for red (R), green (G) and blue (B) were obtained from the colour camera and DN values for the red (NIRR), green (NIRG) and blue (NIRB) photosite were obtained from the NIR camera.
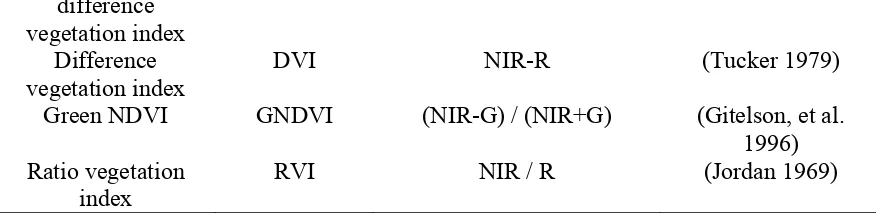
As the primary interest was in the crop attributes of yield and grain protein (measured at harvest time for the whole plot), the DN values for the whole plot were extracted, except for a 2-pixel buffer around the edge of the plot. This resulted in an average of 1300 pixels being exported for each of the 120 plots. The average digital number for each band of the sensor, for each of the plots, was tabulated. Spectral vegetation indices derived from these values, as well as the yield and protein values, were also added to the table. The spectral bands and vegetation indices used in this research are listed in Table 1.
Table 1 Spectral bands and vegetation indices used in this study
Spectral Band (Raw DN values)
Name Abbreviation Approximate spectral range (nm)
Blue B 400-500
Green G 500-600
Red R 600-700
Near-infrared NIR (NIRR, NIRG, NIRB)
700-≈1050
Vegetation Indices
Name Abbreviation Formula Reference
difference vegetation index
Difference vegetation index
DVI NIR-R (Tucker 1979)
Green NDVI GNDVI (NIR-G) / (NIR+G) (Gitelson, et al. 1996) Ratio vegetation
index
RVI NIR / R (Jordan 1969)
The statistical analysis included correlation and discriminant function analysis using SPSS for Windows® Version 12.0.1 (SPSS Inc - Chicago, Ill, USA) and partial least squares
regression using Unscrambler 9.1 (CAMO Process AS – Oslo, Norway). The correlation analysis and partial least squares regression was performed on the raw digital camera bands and the vegetation indices that could be derived using these bands. The discriminant function analysis (DA) was performed to see if the sensor could accurately discriminate between the various fertiliser regimes, i.e. if the plots that had 0 kg/ha of fertiliser applied could be differentiated from the plots that had 40, 80, and 120 kg/ha N applied. The DA procedure generates one or more discriminant functions based on linear combinations of the predictor variables that provide the best discrimination between groups. It has been used successfully in spectral discrimination studies (Strachan, et al. 2002). The entire sample set of 120 was used in the DA calculations.
To assess the predictive power of the relationship between grain yield/protein and imagery values, a partial least squares (PLS) regression was implemented. PLS regression is a bilinear modeling method for relating the variations in one or several response variables (Y-variables) to the variations of several predictors (X-variables), with explanatory or predictive purposes (Esbensen 2002). Unlike the classical multiple regression technique, PLS performs particularly well when the various X-variables have high correlation (which is often the case for multispectral data). Information in the original X-data is projected onto a small number of underlying (“latent”) variables called PLS components.
Aside from the raw imagery data, the set of derived vegetation indices was also calculated and analysed using the full cross-validation (leave-one-out) technique. The root mean error of prediction (RMSEP) was calculated, which gave the measurement of the average
difference between predicted and measured response values. It can be interpreted as the average prediction error, expressed in the same unit as the original response value (Unscrambler 9.1, CAMO Process AS – Oslo, Norway). The RMSEP values between datasets can be compared to determine which PLS regression model is better than others. 3 Results and discussion
[image:8.612.87.525.80.187.2]variation indicates that the plots were not entirely uniform. The information contained in the three near infrared bands (NIRB, NIRG and NIRR) were relatively similar as they were measuring the same light intensities. The magnitude differed however, due to the
[image:9.612.119.489.238.338.2]difference in sensitivities of each of the sensors. As the red sensor has more sensitivity to near infrared light (refer to figure 4) compared to that of the blue and green, the DN values for NIRR were proportionally larger than that of NIRG and NIRB. Although the exposure time/shutter speed is not recorded in the *.jpg file, laboratory tests indicated that under the same lighting conditions, the NIR camera had a noticeably slower shutter speed. This is a possible reason for the DN values NIRR being higher than any of the visible (RGB) bands
Table 2 The summary statistics of the band values for a 40 units of N-applied plot
R G B NIRR NIRG NIRB
average 161.4 143.7 122.5 185.3 48.4 62.7
median 161.0 143.0 123.0 185.0 48.0 62.0
minimum 143.0 127.0 98.0 161.0 35.0 50.0
maximum 179.0 158.0 145.0 213.0 64.0 79.0
Standard
deviation 5.7 5.5 8.5 10.1 4.6 5.0
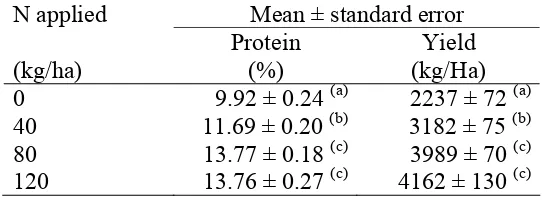
An analysis of variance was performed on the data to check for statistical differences (at the 0.05 level) between yield / protein and the amount of N fertilizer applied. As can be seen from table 3, all the results were significant except at the higher application rates (80-120 kg/Ha) for both yield and protein.
Table 3 The summary statistics for yield and protein of the entire trial site.
N applied Mean ± standard error (kg/ha) Protein (%) (kg/Ha) Yield 0 9.92 ± 0.24 (a) 2237 ± 72 (a) 40 11.69 ± 0.20 (b) 3182 ± 75 (b)
80 13.77 ± 0.18 (c) 3989 ± 70 (c) 120 13.76 ± 0.27 (c) 4162 ± 130 (c)
(a,b,c)Significance at the 0.05 level
3.1 Correlation analysis to predict yield and protein
[image:9.612.170.441.460.560.2]theoretical expectations and with some other related studies (Yang and Anderson 2000). This study also agrees with other studies (Staggenborg and Taylor 2000; Yang, et al. 2000) that the best relationship was found with the near infrared band.
In Figure 5, as well as displaying the yield/protein and image values for each of the 120 plots, the amount of N applied is also displayed. The four different rates are displayed as different symbols and give a good visual representation of the grouping of the data. The plots with 0 units of N applied were suffering from nutrient deficiency and resulted in a low crop growth/vigour and with reduced biomass. This low fertiliser rate equates to a low protein and yield and a corresponding low DVI values. These are represented as the + sign in the graph and occur in the bottom left hand corner of both graphs. The other three classes (40, 80 and 120 N applied) do not fall into similarly tight clusters, however grouping is still evident.
3.2 Discriminant function analysis to predict the amount of fertiliser applied
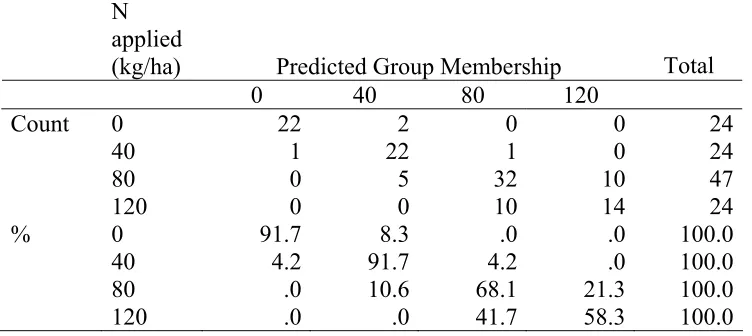
[image:12.612.120.496.503.671.2]Discriminant analysis was used to predict the amount of fertiliser applied to the crop using the raw digital camera values (Table 4). Of the original grouped cases, 90 of the 119 plots (75.6%) were correctly classified. However, in the nutrient deficient plots where plant available N had run down (the 0 and 40 unit treatments), the sensors were able to predict these areas with 91% accuracy. It was more difficult to predict the 80 kg treatments (68% accuracy) and the 120 kg treatments (58% accuracy). The 80 kg treatments were sufficient to sustain the crop (no build-up or run down of plant available N) and the 120 kg treatments had excess nutrients to requirements (N building up). This indicates that the sensor is better at detecting where nutrients are limited rather than where they are in excess. This study attained comparable accuracy with the hyperspectral work of Strachan et al. (2002) who used canonical discriminant analysis to accurately classify different levels of crop nutrition (varying rates of nitrogen) using reflectance data with overall success rates varying from 70-93%, depending on timing during the season.
Table 4 Prediction accuracy of fertilizer treatment classification using discriminant analysis
N applied
(kg/ha) Predicted Group Membership Total
0 40 80 120
Count 0 22 2 0 0 24
40 1 22 1 0 24
80 0 5 32 10 47
120 0 0 10 14 24
% 0 91.7 8.3 .0 .0 100.0
40 4.2 91.7 4.2 .0 100.0
80 .0 10.6 68.1 21.3 100.0
3.3 Partial least squares regression
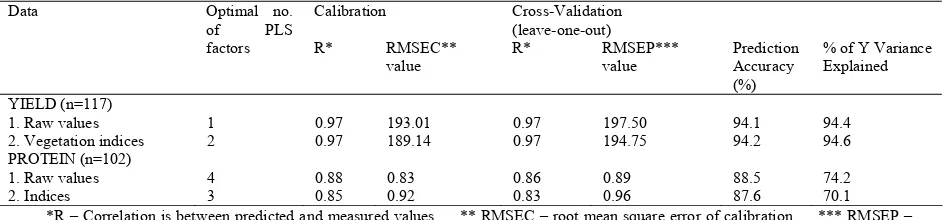
[image:13.612.71.543.266.376.2]The PLS regression results showed that it is possible to predict grain yield using digital camera imagery obtained from a balloon platform. Correlations between predicted and measured values for the calibrated and validated samples were very high (r=0.97 for all models) (Table 5). For both raw imagery and vegetation indices, the RMSEP values were relatively low, equivalent to prediction accuracy of 94.1% and 94.2%, respectively. The optimal number of PLS factors (components) was minimal (i.e. one for the raw imagery and two for the vegetation indices), but was able to explain the Y-variance sufficiently (i.e. over 94%). This is desirable as it is good to have simple models, where the total explained variance goes to 100% with as few components as possible.
Table 5 PLS regression results of imagery values and yield and protein
Calibration Cross-Validation (leave-one-out)
Data Optimal no.
of PLS
factors R* RMSEC**
value R* RMSEP*** value Prediction Accuracy (%)
% of Y Variance Explained
YIELD (n=117)
1. Raw values 1 0.97 193.01 0.97 197.50 94.1 94.4
2. Vegetation indices 2 0.97 189.14 0.97 194.75 94.2 94.6
PROTEIN (n=102)
1. Raw values 4 0.88 0.83 0.86 0.89 88.5 74.2
2. Indices 3 0.85 0.92 0.83 0.96 87.6 70.1
*R – Correlation is between predicted and measured values ** RMSEC – root mean square error of calibration *** RMSEP – root mean square error of prediction
For grain protein, correlations between predicted and measured values for calibrated and validated samples were also high (i.e. from r=0.83 to r=0.88), although they were lower than for grain yield values (Table 5). Consequently, prediction accuracies for grain protein were lower than for grain yield, i.e. 87.6% to 88.5% for the validated model. The regression models needed three to four PLS components to explain 70.1% to 74.2% of the variation in grain protein. Compared with grain yield, these values indicate that imagery has less predictive power for grain protein.
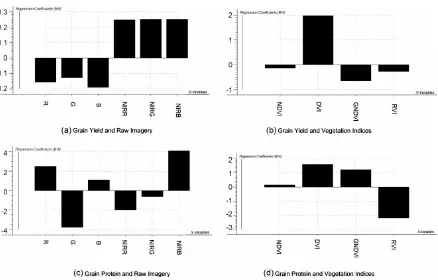
Figure 6 Regression coefficients for the cross-calibrated prediction model involving grain yield, grain protein, raw imagery values, and vegetation indices.
With regards to grain protein, the regression coefficient plots (Figure 6c) indicated that the near infrared band (NIRB) and the visible wavelength green band (G) were the most significant predictor variables among the raw imagery. These results further reinforce the importance of the NIR bands in grain protein prediction. These findings agree with the results of Basnet et al. (2003) that listed the tasselled cap greenness index (a transformation involving the NIR and VIS bands) as among those with the highest statistical association with grain protein content. The Ratio Vegetation Index (RVI) and DVI were the best performing vegetation indices (Figure 6d). The simple ratio image RVI and the difference image DVI performed better than the normalised ratios. This agrees with a study (Wright, et al. 2003) of spectral data and grain protein content which found that the simple ratio of NIR and red bands achieved the highest correlation coefficient (r = 0.59).
3.4 The yield-protein relationship
These protein thresholds have been shown in figure 5. This identifies the areas in the trial where the yield had been limited by rainfall and stored moisture, and those areas where nutrition had been limiting. It is not surprising that the areas limited my nutrition were the areas where the fertiliser application rates were low. In the nutrient-rich areas, the yield potential had been limited by water.
The limitations, be they water or nutrition, are expressed in the plant as crop stress. When the crop is stressed, the stomata begin to shut down, reducing the photosynthetic activity. With the associated reduction in chlorophyll, less light is being reflected in the NIR, providing a darker signal in the image. The lack of stress in the crop is indicted by an actively growing crop (higher biomass) that has high reflectance in the NIR due to the photosynthetic activity.
The ability to identify areas of fields where stress has hindered crop performance may allow better management decisions to be made. These decisions could include remedial actions to rectify these causal agents or to deal with the variation at harvest time. The ability to apply remedial actions is dependent on the nature of the stress. If the stress is a lack of water and the crop is rainfed, there is no potential for remedial action. If nutrition is limiting growth, then a fertiliser application may be possible dependent on the ability to apply the nutrients and for these nutrients to be made available to the plant. If no action is possible during the growing season of the crop, then segregation maybe possible at harvest to allow targeting of grain protein for specific markets to optimise crop return. Alternatively, the data gained on the spatial distribution of the yield and protein could be used to change management decisions in following crops.
This research offers proof-of-concept that digital cameras can provide relatively cheap and useful data layers that are highly correlated with at-harvest parameters. For trial sites, the balloon is the ideal platform, however the utility of applying this system to broadacre agriculture would be greatly expanded by having a more mobile platform. Plans are currently underway to mount a higher resolution sensor system on a remotely controlled aircraft that has an onboard autopilot to provide the capacity to fly to waypoints and initiate image acquisition.
4 Conclusions
to make management decisions for future crops. Greater utility of the system could be achieved with a more mobile platform.
Acknowledgements
We thank the Grains Research and Development Corporation (GRDC) and the Queensland Department of Primary Industries & Fisheries (DPI&F) for their financial support for this project. We also thank Incitec and David Lester for allowing us to use the trial plots and agronomic datasets.
References
Apan, A., Kelly, R., Jensen, T., Strong , W., Butler, D., 2004. Correlating high resolution aerial imagery with wheat yield and protein content, In: Smith, R. and Dawbin, K. (Ed.), 12th Australasian Remote Sensing and Photogrammetry Conference, Spatial Sciences Institute, Fremantle, Western Australia, pp. 983-95.
Baker, A.K.M., Fitzpatrick, R.W., Koehne, S.R., 2004. High resolution low altitude aerial photography for recording temporal changes in dynamic surficial environments. In: Roach, I.C. (Ed.), Regolith 2004., CRC LEME, pp. 21-25.
Barnes, E.M., Pinter, P.J.J., Moran, M.S., Clarke, T.R., 1997. Remote sensing techniques for the integration of crop models with GIS. In: 87th Annual meeting of the American Society of Agronomy, Crop Science Society of America, and Soil Science Society of America, Anaheim, California.
Basnet, B., Apan, A., Kelly, R., Jensen, T., Strong , W., Butler, D., 2003. Relating satellite imagery with grain protein content. In: Spatial Science 2003, Canberra, Australia.
Boike, J., Yoshikawa, K., 2003. Mapping of periglacial geomorphology using kite/balloon aerial photography. Permafrost and Periglacial Processes, 14 (1), 81-85.
Esbensen, K., 2002. Multivariate Data Analysis - in practice. CAMO Process AS, Oslo Everitt, J.H., Escobar, D.E., Cavazos, I., Noriega, J.R., Davis, M.R., 1995. A three-camera multispectral digital video imaging system. Remote Sensing of Environment, 54, 333-337. Gitelson, A.A., Kaufman, Y.J., Merzlyak, M.N., 1996. Use of a green channel in remote sensing of global vegetation from EOS-MODIS. Remote Sensing of Environment, 58 (3), 289-298.
Hunt Jr., E.R., Cavigelli, M., Daughtry, C.S.T., McMurtrey III, J.E., Walthall, C.L., 2005. Evaluation of digital photography from model aircraft for remote sensing of crop biomass and nitrogen status. Precision Agriculture, 6 (4), 359-378.
Inoue, Y., Morinaga, S., Tomita, A., 2000. A blimp-based remote sensing system for low-altitude monitoring of plant variables: a preliminary experiment for agricultural and ecological applications. International Journal of Remote Sensing, 21 (2), 379-385.
Jordan, C.F., 1969. Derivation of leaf area index from quality of light on the forest floor. Ecology, 50 (4), 663-666.
Kelly, R.M., Strong, W.M., Jensen, T.A., Butler, D., 2004. Application of probability analysis to assess nitrogen supply to grain crops in northern Australia. Precision Agriculture, 5 (2), 95-110.
Lamb, D.W., Brown, R.B., 2001. Remote-sensing and mapping of weeds in crops. Journal of Agricultural Engineering Research, 78 (2), 117-125.
Layrol, L., Hedoin, E., Lepoutre, D., Francois, O., 2000. Matching multitemporal yield and images data, In: Robert, P.C., Rust, R.H. and Larson, W.E. (Ed.), 5th International Conference on Precision Agriculture, American Society of Agronomy, Madison, USA, Bloomington, Minnesota, USA, pp. 1-16.
Liu, L., Wang, J., Bao, Y., Huang, W., Ma, Z. & Zhao, C., 2006. Predicting winter wheat condition, grain yield and protein content using multi-temporal EnviSat-ASAR and Landsat TM satellite images. International Journal of Remote Sensing, 27(4), 737-753.
Price, J.C., Bausch, W.C., 1995. Leaf area index estimation from visible and near-infrared reflectance data. Remote Sensing of Environment, 52, 55-65.
Ries, J.B., Marzolff, I., 2003. Monitoring of gully erosion in the Central Ebro Basin by large-scale aerial photography taken from a remotely controlled blimp. CATENA, 50 (2-4), 309-328.
Roth, G.W., 1993. Agronomic measurements to validate airborne video imagery for irrigated cotton management. Masters of Applied Science Thesis, University of Canberra. Rouse, J.W., Haas, R.H., Schell, J.A., Deering, D.W., Harlan, J.C., 1974. Monitoring the vernal advancement of retrogradation of natural vegetation. NASA/GSFC, Greenbelt, MD USA.
Strachan, I.B., Pattey, E., Boisvert, J.B., 2002. Impact of nitrogen and environmental conditions on corn as detected by hyperspectral reflectance. Remote Sensing of Environment, 80 (2), 213-224.
Strong , W., Holford, I.C., 1997. Fertiliser and Manures. In: Wylie, P.B. (Ed.), Sustainable Crop Production in the Subtropics, QDPI, Brisbane, Australia, pp. 214-234.
Sugiura, R., Noguchi, N., Ishii, K., 2005. Remote-sensing technology for vegetation monitoring using an unmanned helicopter. Biosystems Engineering, 90 (4), 369-379.
Tucker, C.J., 1979. Red and photographic infrared linear combinations for monitoring vegetation. Remote Sensing of Environment, 8 (2), 127-150.
Wright, G.G., Matthews, K.B., Cadell, W.M., Milne, R., 2003. Reducing the cost of multi-spectral remote sensing: combining near-infrared video imagery with colour aerial photography. Computers and Electronics in Agriculture, 38 (3), 175-198.
Yang, C., Everitt, J.H., Bradford, J.M., Escobar, D.E., 2000. Mapping grain sorghum growth and yield variations using airborne multispectral digital imagery. American Society of Agricultural Engineers, 43 (6), 1927-1938.
Zhang, N., Wang, M., Wang, N., 2002. Precision agriculture--a worldwide overview. Computers and Electronics in Agriculture, 36 (2-3), 113-132.