Educational Implications of the Values Held by Australian Aboriginal Students
Colin White and Gerard J. Fogarty University of Southern Queensland
Full reference: White,C., Fogarty,G., (2001). Educational implications of the values held by
Abstract
Fogarty and White (1994) found that Australian Aboriginal university students tend to be more collectively minded than their non-Aboriginal counterparts. Using the Values Survey developed by Schwartz (1992), the present study set out to replicate this finding and to
determine whether observed value differences can help to explain the low achievement levels of Aboriginal students in a university setting. The differences noted by Fogarty and White (1994) were replicated in the present study where data gathered from a sample of Aboriginal students (N = 202) over a six year period indicated that they score more highly on the
Educational Implications of the Values Held by Australian Aboriginal Students In recent years, the Australian Government has made a concerted effort to make higher education more available to Aboriginals, a group that has been under-represented in the higher education sector. As part of this effort, agencies were established in higher education institutions to increase the participation of Aboriginal students and to provide support for any special preparatory needs. Despite the growing involvement of Aboriginal people in university education, however, major concerns have emerged in relation to retention and progression rates. McInerney (1991) reported that Aboriginal high school students perform poorly and have the lowest retention rates of any group in Australia. Other researchers have noted that Indigeneous students are under-represented among higher
education graduates, a situation that is getting worse as the Indigenous population grows at a faster rate than the rest of the Australian population (Stanley & Hansen, 1998, p. 43).
Statistics collated by the University of Southern Queensland over a seven year period suggest Aboriginal students are passing on average one out of every two units attempted. This figure is unacceptably low and the identification of causal factors has become a high priority. The present study investigated the influence of values on educational achievement. Specifically, it sought to determine whether previously demonstrated value differences between Aboriginal and non-Aboriginal students (Fogarty & White, 1994) accounted for substantial variance in academic performance.
In reviewing the literature pertaining to educational achievement and persistence for Indigenous Australians, it is clear that cultural difference is a predominant theme.
Researchers (e.g., Harris, 1990; Christie, 1985; Hughes & More, 1993; Malin, 1990; Guider, 1991; Peacock, 1993; Teasdale & Teasdale, 1992) have all noted and/or commented on differences in values, world views, cultural outlooks, learning styles or ways of learning for Indigenous students. These students come from a culture where the interests of the group are likely to be placed before those of the individual and where there is respect for traditional customs and ideas. These values describe what Hofstede (1980) defined as "collective" interests. For example, Teasdale & Teasdale (1992) suggested that the overriding feature of the Aboriginal system is its dependence on informal learning strategies whereby most
knowledge is acquired incidentally through the day-to-day processes of socialisation. In this system, learning is generally self-motivated, not consciously goal directed, and has little need for verbal explanation. In Western educational contexts, however, a different set of values and modes of behaviour appear to be more conducive to academic achievement. These values and behaviours tend to be what Hofstede (1980) defined as "individualistic" in orientation and to involve constructs such as independence, direction, ambition, self-reliance, capability, creativity, curiosity, achievement and competition which are encouraged and fostered in the educational environment.
enhancing motivation and its failure to take sufficient account of culture-specific notions of motivation and achievement. A more suitable overall framework for investigating the role in values in a cross cultural context is provided by Schwartz and Bilsky's (1987) theory of universal human values. Their theory proposed that the full range of values in all cultures could be defined in terms of a set of goals or motivational domains that values are intended to express. In their original formulation, there were seven of these motivational domains.
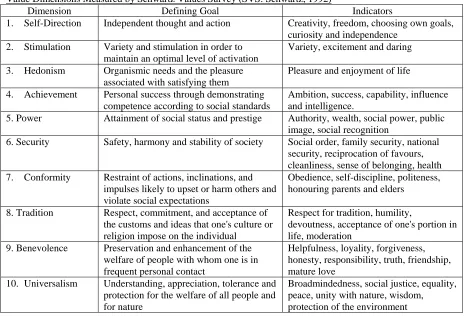
Drawing on the work of other researchers (e.g., Braithwaite & Law, 1985), Schwartz and Bilsky (1990) extended the range of motivational types to ten. The Schwartz Values Survey (SVS) was developed by Schwartz (1992) to measure these ten types. Because of the importance of this theory to the present study, the ten domains are described in Table1.
Fogarty and White (1994) found reliable differences between Aboriginal and non-Aboriginal students on some of the Schwartz dimensions. non-Aboriginal students placed greater emphasis on the collectivist values of Conformity, Tradition, and Security and were less prepared to endorse individualistic values orientations associated with Achievement, Self-direction, Stimulation and Hedonism. The finding that Aboriginal students differ significantly from a peer group of non-Aboriginal students concerning values that serve collective as opposed to individual interests is likely to have educational implications. For example, Triandis, Leung, Villareal, & Clark. (1985) found that idiocentric individuals (those placing higher importance on individual oriented values) had higher academic motivation and placed a greater emphasis on social recognition and competition, characteristics that are valued in most western educational contexts. Support for the contention that idiocentrism is positively related to academic success and that allocentrism (collective values) is negatively related to academic success was also provided by Dabul, Bernal & Knight (1995) in a study that
compared Mexican American and Anglo American adolescents. They found that adolescents who valued idiocentrism had higher academic competency and grade point averages than those valuing allocentrism. In the Fogarty and White (1994) study, the differences that emerged between the two cultures on values associated with the Conformity, Tradition and Security domains suggests that many Aboriginal students will accord collective goals such as family obligations and relationship maintenance a higher priority than more individualistic and competitive educational goals.
These suppositions about the role of values in educational achievement, although plausible, have yet to be tested. We do not know of any previous empirical investigations of the relationship between values and educational achievement for Australian Aboriginal university students. Indeed, apart from those mentioned above, there appear to have been few studies of any kind that have explored the relations between values and behaviour. As Roe and Ester (1999) commented, values research to date has been rather narrow, tending to concentrate on the structure of values.
In an educational context, Feather (1972) showed that school children are happier and better adjusted when there is a match between their own value systems and the perceived value systems of their schools. It has also been shown that Australian university students tend to place a higher value on the academic skills of reading, writing and speaking when compared with more collectively-minded Malaysian university students who tend to favour speaking, practical and social skills (Gill & Keats, 1980). Working with Australian student samples, Lokan and Shears (1995) found that values show small (less than .2) but significant relationships with general scholastic aptitude measures and teacher ratings of school
achievement.
substantially different from Schwartz's (1992) Self-Direction value type. McInerney, Hinkley & Dowson (1997) also found that compared with Indigeneous students, their
non-Indigeneous groups agreed more strongly that excellence, task orientation, and
competitiveness are characteristics of successful students in general. They suggested that this result could illustrate the advantage that non-Indigeneous groups have in academic settings, which emphasise the achievement of these individualistic goals as a measure of success.
These studies have tended to use differing measures of the value construct or equated measures of attitudes and intentions with values. Nevertheless, the studies are consistent in suggesting that scores on certain primary value dimensions should be correlated with measures of academic performance. These expectations allowed us to generate a set of hypotheses, which are described below.
Hypotheses
H1: Aboriginal students will not perform as well academically as their non-Aboriginal counterparts.
A major motivation for conducting this study was the observation that Aboriginal university students experience difficulty meeting assessment demands and, consequently, have a high drop out rate and lower performance levels than their non-Aboriginal
counterparts. The first hypothesis covers this expectation.
H2: Aboriginal students will score higher than non-Aboriginals on Security, Conformity, and Tradition scales.
All three scales are associated with the broad second-order collectivism dimension (Hofstede, 1980) and differences have already been observed on these values by Fogarty and White (1994). The present study will attempt to replicate those findings.
H3: Values associated with Achievement and Self-Direction in the Schwartz Value Survey will show significant relationships with academic attainment while values associated with Conservation or Collectivism will be negatively related.
The indicators for the Achievement dimension include ambition, success, capability, and intelligence, all of which should favour academic success. Self-Direction was also expected to relate to success, primarily because its defining goal is independent thought and action, something that universities try hard to inculcate in students. On the negative side, Tradition and Conformity, being core collectivist values, were expected to create feelings of conflict among Aboriginal students in a university setting and to lead to poor achievement in this setting. As far as the remaining value dimensions were concerned, there were no clear expectations. Given the largely exploratory nature of the present study, however, relations with academic achievement were examined for all value dimensions.
Method
Participants
Survey responses from 202 Aboriginal and 194 non-Aboriginal students were used in the present study. Because of the relatively small intake of Aboriginal students each year, the data for this study were collected over a six year period and the present sample included the 112 Aboriginal and 110 non-Aboriginal students described by Fogarty and White (1994). The Aboriginal students were predominately from rural, semi-urban, and urban environments with very few from what could be considered traditional Aboriginal
values; b) transitional – generally speak both the native language and English, may not fully accept the cultural heritage and practices of their tribal group or identify with mainstream culture and values; c) bicultural – generally accepted by the dominant society, simultaneously able to know, accept and practise both mainstream values and the traditional values and beliefs of their cultural heritage; d) assimilated – generally accepted by the dominant society, embrace only mainstream culture and values. The third category, bicultural, would probably best describe the majority of Australian Aboriginal people living outside of traditional communities, and also best describes the cultural commitment and experience of the
Aboriginal students who participated in this study. The majority of these students had spent at least 10 years in Australian primary and secondary schools prior to their enrolment in the university.
The gender composition for both groups was predominantly female, with males comprising 34.2% of the Aboriginal group and 37.1% of the non-Aboriginal group. The mean age for the Aboriginal group was 27.34 years with an age range from 17 to 55 years. The mean age for the non-Aboriginal group was 26.34 years with an age range from 17 to 54 years. The Aboriginal students were enrolled in a variety of disclipines including Psychology, Nursing, Education, Management, and Arts. They were asked by the first author, who was employed by the University to assist Aboriginal students, to participate in the study. The non-Aboriginal respondents were predominately of Anglo-Saxon origin and were all First Year Psychology students who received course credit for participating. Informed consent was obtained from all participants.
Materials
The Schwartz Value Survey (SVS) as developed by Schwartz (1992) and described earlier in this paper was used in the present study. The questionnaire required respondents to rate the importance of a list of 56 values on a rating scale numbered from -1 to 7. Each value was accompanied by a short description and respondents were asked to rate how important each value was as a guiding principle in their lives. Labels used for the scale were “-1 = opposed to my values”, “0 = not important”, “3 = important”, “6 = very important”, and “7 = of supreme importance”. Written instructions requested respondents to first anchor the least important and most important value in each list and then attempt to distinguish as much as possible between the values by using all the possible ratings.
Upon completion of the SVS, 45 of the 56 values were used to form 10 scales
Table 1
Value Dimensions Measured by Schwartz Values Survey (SVS: Schwartz, 1992)
Dimension Defining Goal Indicators
1. Self-Direction Independent thought and action Creativity, freedom, choosing own goals, curiosity and independence
2. Stimulation Variety and stimulation in order to maintain an optimal level of activation
Variety, excitement and daring
3. Hedonism Organismic needs and the pleasure associated with satisfying them
Pleasure and enjoyment of life
4. Achievement Personal success through demonstrating competence according to social standards
Ambition, success, capability, influence and intelligence.
5. Power Attainment of social status and prestige Authority, wealth, social power, public image, social recognition
6. Security Safety, harmony and stability of society Social order, family security, national security, reciprocation of favours, cleanliness, sense of belonging, health 7. Conformity Restraint of actions, inclinations, and
impulses likely to upset or harm others and violate social expectations
Obedience, self-discipline, politeness, honouring parents and elders
8. Tradition Respect, commitment, and acceptance of the customs and ideas that one's culture or religion impose on the individual
Respect for tradition, humility,
devoutness, acceptance of one's portion in life, moderation
9. Benevolence Preservation and enhancement of the welfare of people with whom one is in frequent personal contact
Helpfulness, loyality, forgiveness, honesty, responsibility, truth, friendship, mature love
10. Universalism Understanding, appreciation, tolerance and protection for the welfare of all people and for nature
Broadmindedness, social justice, equality, peace, unity with nature, wisdom, protection of the environment
As part of the university induction process, many Aboriginal students (N = 160) also completed measures of verbal and numerical reasoning. These were the ML and MQ tests measuring linguistic and numerical reasoning respectively, developed by the Australian Council for Educational Research (ACER, 1981). The tests are intended primarily as predictive measures of general scholastic ability and as educational counselling aids in situations where the ability to reason with words and numbers is important (ACER Manual, 1981). Validation studies have shown that both tests predict academic performance, typically grade point average or an equivalent measure, with validity coefficients in the .5 to .6 range (e.g., Gleitman, 1981; White, 1996). Although not the primary focus of interest in this study, it was thought that the tests would provide a benchmark against which to assess the
predictive validity of values measures in an educational setting. The ML and MQ each contained 34 items and were administered by the first author (White) during interview
procedures for Aboriginal students upon application to undertake University studies. None of the non-Aboriginal students completed these tests. The predictive validity indices for the ML and MQ tests against the dependent variable used in the present study (see description below) were .54 and .47 respectively.
Dependent Variable
3.5, making it difficult to use this measure as a meaningful basis for comparisons of academic performance. For the purpose of this study, a variable called Progression Rate was defined as the ratio of units passed to units attempted. The ratio was converted to a figure ranging from 0 to 100, where 100 indicated a perfect pass rate and 0 indicated failure in all units attempted. Thus, a student who had passed five units out of ten was assigned a Progression Rate of 50.00. A student who passed four out of five units had a score of 80.00. Progression Rate was calculated from the student record database just prior to the completion of the study so that as much data as possible was available for all students participating in the study. At the time these progression data were collected, 31 Aboriginal students had graduated (15%), 40 were currently enrolled (20%), and 131 had cancelled or deferred their studies (65%).
There is no doubt that this measure is far from perfect. For example, it does not take into account the workload for each student. A student who attempted just one unit
successfully and then withdrew from the course would have a Progression Rate of 100 (and there were some of these) whereas a student who completed nine out of ten units would have a Progression Rate of 90. The unfairness, however, is more apparent than real. There are many valid reasons for withdrawing from a course, some of them not related to the student’s abiltity to cope academically. Dropout was also measured, however, and found to have a high correlation with Progression Rate (0.73), indicating that many of those who withdrew or deferred were struggling academically.
Procedure
Scores on the SVS, ML, and MQ scales were collected for all intakes over the period 1991 to 1996 at the rate of approximately 30 to 40 students per year. This slow accumulation was necessary because of the relatively small intake of Aboriginal students to the university each year. To help overcome cohort effects, data for the non-Aboriginal group were also collected incrementally over a similar time period. Most Aboriginal students completed the SVS and ACER scales during their interview procedures or in their first weeks at university. Some of these interviews were conducted away from the main campus where circumstances did not permit the administration of the ML and MQ tests, with the result that these data were available for 160 out of the total sample of 202 Aboriginal students. Data from
non-Aboriginal students were collected by posting recruitment notices on Psychology Departmental notice boards in semester one of these same years. These students then
completed the SVS in group testing sessions. Total testing time was approximately one hour when all three tests were administered and 20 minutes when only the SVS was administered.
Results
and study skills but it is likely that the group was still underprepared compared with the non-Aboriginal group. The second point is that the average age of both samples (26-27 yrs) may appear somewhat high for students commencing university study but the age is typical for this university which accepts a high proportion of mature-age students.
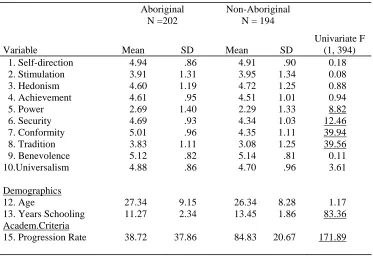
Table 2
Comparison of Means for Aboriginal and non-Aboriginal Groups on SVS Dimensions
Aboriginal N =202
Non-Aboriginal N = 194
Variable Mean SD Mean SD
Univariate F (1, 394) 1. Self-direction 4.94 .86 4.91 .90 0.18 2. Stimulation 3.91 1.31 3.95 1.34 0.08 3. Hedonism 4.60 1.19 4.72 1.25 0.88 4. Achievement 4.61 .95 4.51 1.01 0.94 5. Power 2.69 1.40 2.29 1.33 8.82 6. Security 4.69 .93 4.34 1.03 12.46 7. Conformity 5.01 .96 4.35 1.11 39.94 8. Tradition 3.83 1.11 3.08 1.25 39.56 9. Benevolence 5.12 .82 5.14 .81 0.11
10.Universalism 4.88 .86 4.70 .96 3.61
Demographics
12. Age 27.34 9.15 26.34 8.28 1.17 13. Years Schooling 11.27 2.34 13.45 1.86 83.36 Academ.Criteria
15. Progression Rate 38.72 37.86 84.83 20.67 171.89
Note. Underlined F values significant at .05 level.
As predicted by H1, progression rates were significantly lower for the Aboriginal students. The mean score on Progression Rate for Aboriginals was 38.72 compared to 85.35 for non-Aboriginals (F(1,394) = 171.89, p < .001). To remind the reader, a figure of 38.72 indicates that the students on average passed approximately four out of every ten units
attempted. The low Progression Rate score for the Aboriginal group reflects the concerns that gave rise to the study and shows that the problem was evident in this sample.
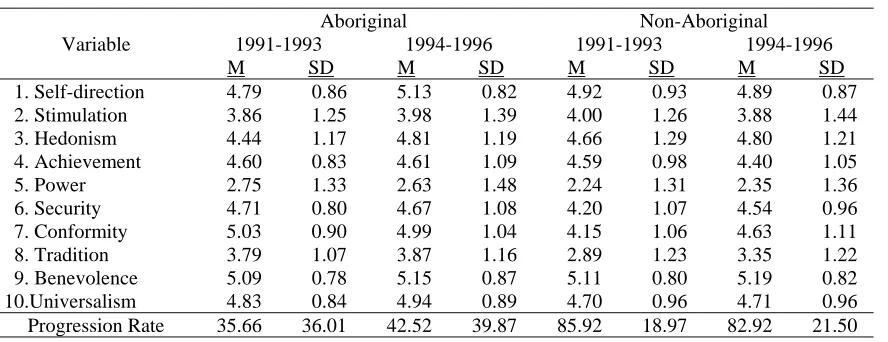
groups is shown in Table 3. The only significant difference between the samples from the second data collection period was on the Tradition variable, where once again the Aboriginal group had a higher score (mean difference = .53; Scheffe's test: p < .01). The difference between the outcomes for the two data collection periods was due to a drift in the second non-Aboriginal group towards collectivist values. Scores for the two Aboriginal groups were virtually identical on all scales, but the second non-Aboriginal group scored higher on
[image:10.595.70.514.234.405.2]Tradition (mean difference = .46; Scheffe: p < .05) and Conformity (mean difference = .49; p < .01) than the earlier non-Aboriginal group. A check on progression scores for groups in the two data collection periods showed that Progression Rate had not changed for either group.
Table 3
Mean Progression Rates for Two Groups of Aboriginal and Non-Aboriginal Students
Aboriginal Non-Aboriginal
Variable 1991-1993 1994-1996 1991-1993 1994-1996
M SD M SD M SD M SD
1. Self-direction 4.79 0.86 5.13 0.82 4.92 0.93 4.89 0.87 2. Stimulation 3.86 1.25 3.98 1.39 4.00 1.26 3.88 1.44 3. Hedonism 4.44 1.17 4.81 1.19 4.66 1.29 4.80 1.21 4. Achievement 4.60 0.83 4.61 1.09 4.59 0.98 4.40 1.05 5. Power 2.75 1.33 2.63 1.48 2.24 1.31 2.35 1.36 6. Security 4.71 0.80 4.67 1.08 4.20 1.07 4.54 0.96 7. Conformity 5.03 0.90 4.99 1.04 4.15 1.06 4.63 1.11 8. Tradition 3.79 1.07 3.87 1.16 2.89 1.23 3.35 1.22 9. Benevolence 5.09 0.78 5.15 0.87 5.11 0.80 5.19 0.82 10.Universalism 4.83 0.84 4.94 0.89 4.70 0.96 4.71 0.96 Progression Rate 35.66 36.01 42.52 39.87 85.92 18.97 82.92 21.50
The third hypothesis concerned the relations between the ten value types and
Progression Rate. In the first instance, relations were examined for the combined Aboriginal and non-Aboriginal samples. The correlations among the values scales themselves and correlations of scales with Progression Rate and the two reasoning measures are shown in Table 4. Results indicated that Power (r = -.14, p < .01), and the two collectivist values of Tradition (r = -.28, p < .01) and Conformity (r = -.28, p < .01) were the only SVS variables to correlate with Progression Rate. Because these three variables were also ones that
differentiated between the Aboriginal and non-Aboriginal samples, it was important to partial out the effect of Race. Hierarchical linear regression was used for this purpose. The variable Race was entered in step one to control for the influence of Aboriginality versus
non-Aboriginality. All 10 values were then entered as a block in the second step of the
Table 4
Correlations Among SVS Scales, Cognitive Variables, and Progression Rate (N = 396)
1 2 3 4 5 6 7 8 9 10 11 12
1. Self-direction 1.00 0.49 0.40 0.49 0.21 0.34 0.20 0.17 0.25 0.50 0.00 0.17 2. Stimulation 0.49 1.00 0.48 0.41 0.34 0.15 0.10 0.06 0.11 0.27 0.02 -0.06 3. Hedonism 0.40 0.48 1.00 0.38 0.32 0.19 0.06 0.01 0.15 0.18 0.05 -0.11 4. Achievement 0.49 0.41 0.38 1.00 0.52 0.45 0.34 0.19 0.28 0.25 0.08 0.11 5. Power 0.21 0.34 0.32 0.52 1.00 0.38 0.33 0.26 0.05 0.05 -0.14 -0.27 6. Security 0.34 0.15 0.19 0.45 0.38 1.00 0.62 0.48 0.43 0.44 -0.10 0.04 7. Conformity 0.20 0.10 0.06 0.34 0.33 0.62 1.00 0.60 0.45 0.29 -0.28 -0.10 8. Tradition 0.17 0.06 0.01 0.19 0.26 0.48 0.60 1.00 0.45 0.35 -0.28 -0.19 9. Benevolence 0.25 0.11 0.15 0.28 0.05 0.43 0.45 0.45 1.00 0.44 0.04 0.12 10. Universalism 0.50 0.27 0.18 0.25 0.05 0.44 0.29 0.35 0.44 1.00 -0.03 0.23 11. Progression R. 0.00 0.02 0.05 0.08 -0.14 -0.10 -0.28 -0.28 0.04 -0.03 1.00 0.53 12. ML 0.17 -0.06 -0.11 0.11 -0.27 0.04 -0.10 -0.19 0.12 0.23 0.53 1.00 13. MQ -0.07 -0.15 -0.03 -0.02 -0.17 -0.03 -0.16 -0.20 0.06 0.10 0.47 0.64
Note:
Correlations greater than 0.11 significant (p < .05)
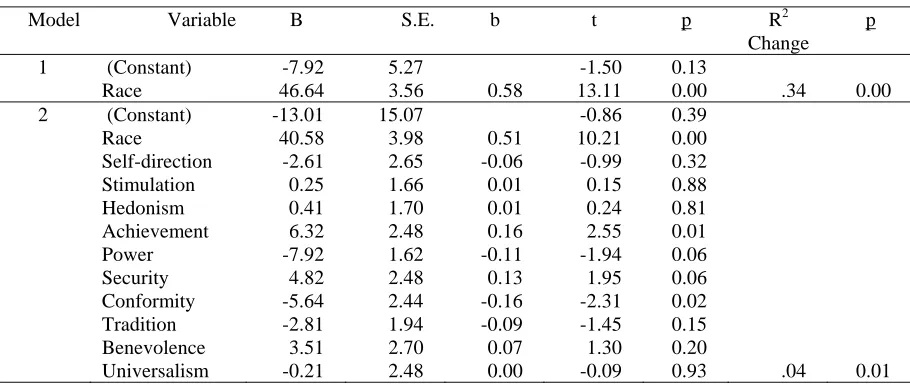
Table 5
Hierarchical Regression Analysis of Progression Rate on Race (Block 1) and Race plus Ten SVS Dimensions (Block 2).
Model Variable B S.E. b t p R2 Change
p
1 (Constant) -7.92 5.27 -1.50 0.13 Race 46.64 3.56 0.58 13.11 0.00 .34 0.00 2 (Constant) -13.01 15.07 -0.86 0.39
Race 40.58 3.98 0.51 10.21 0.00 Self-direction -2.61 2.65 -0.06 -0.99 0.32 Stimulation 0.25 1.66 0.01 0.15 0.88 Hedonism 0.41 1.70 0.01 0.24 0.81 Achievement 6.32 2.48 0.16 2.55 0.01 Power -7.92 1.62 -0.11 -1.94 0.06 Security 4.82 2.48 0.13 1.95 0.06 Conformity -5.64 2.44 -0.16 -2.31 0.02 Tradition -2.81 1.94 -0.09 -1.45 0.15 Benevolence 3.51 2.70 0.07 1.30 0.20
Universalism -0.21 2.48 0.00 -0.09 0.93 .04 0.01
At step one of this hierarchical regression analysis, using listwise deletion of missing data, Race accounted for 34% of the variance in academic progression, F (1, 333) = 171.89, p < .01. At step two, with the addition of the values scores, the proportion of variance
accounted for increased to 38.5%, F Change (10, 323) = 2.32, p < .01. Thus, values
contributed a further 4.5%; a significant but hardly major contribution. The values that made a unique contribution after controlling for other variables were Achievement (b = .157, p < .05) and Conformity (b = - .157, p < .05).
[image:11.595.69.524.397.590.2].01) were close to the validity coefficients reported for these tests in the manual (ACER Manual, 1981). For that subsample of 160 students, R Square for predicting Progression Rate from ML and MQ was 0.33, F (2, 157) = 37.25, p < .01). Clearly, the role of values in
predicting academic progression was rather small in comparison with the prediction achieved from well-known relevant measures of academic success, such as linguistic and numerical reasoning tests.
Discussion
The sample of Aboriginal students collected over the six-year period of this study showed the same worrying trend of relatively poor academic performance noted by other researchers at high school and university level (McInerney, 1991; Stanley & Hansen, 1998). One possible reason for this situation is the difference in educational standards prior to university admission. In the present study, we found that the Aboriginal sample had
experienced significantly less schooling than their counterparts (11.27 yrs Vs 13.45 yrs). The reason for the discrepancy is that admission requirements have been relaxed for the
Aboriginal students in an attempt to give them better access to higher education. It would be tempting to say that lower education levels were responsible for the poorer performance of this group. However, analyses of the data collected in this study (not reported earlier) indicated that years of schooling as a variable explained only about 5.5% of the variance in academic performance for the Aboriginal group. Clearly the major cause lies elsewhere.
The findings from the present study suggest that value differences reported by Fogarty and White (1994) and replicated here were not a major cause either. There were relationships between some of the value types measured by the SVS and academic progression but the relationships were rather weak. When Race was partialled out, values explained an additional 4.5% of the variance in Progression Rate with only Achievement and Conformity making a significant contribution to the prediction. Students who attached high importance to
achievement goals tended to do better academically. This finding makes sense because indicators for Achievement include ambition, success, capability, influence, and intelligence. In a Western educational setting, university study is a path to such goals. The significant negative relationship between Conformity and Progression Rate in the present study may simply be an expression of how conformity is interpreted by Aboriginal students in an academic context: conformity not with the prevailing Western norms of educational
achievement but with the traditional Aboriginal view that the most important lessons in life are not learned in a classroom.
The expectation that Self-Direction would be related to Progression Rate was not supported. The indicators for this variable include creativity, freedom, choosing own goals, curiousity, and independence. On reflection, it is apparent that these values do not necessarily encourage success at university. Indeed, they may support a decision to reject higher
education and all that it represents. It is possible for respondents to attach high importance to values such as independence, success and capability yet make no deliberate choice to
implement these values in a study environment.
Regarding the values that distinguish Aboriginal from non-Aboriginal students - Security, Conformity, and Tradition - we found no evidence that Security and Tradition values predicted performance once Race was controlled. Of the three, Conformity alone had a weak relationship with performance. The lack of support for strong associations between these values and performance suggests that the greater collective orientation of the
be noted, however, that the correlations reported by Dabul et al. were also very low, around the -.14 mark.
The finding that values do not relate strongly to indices of performance at university level echoes the conclusions of some other researchers who have sought to discover a link between values and behaviour. Feather (1975) - while conceding that the interrelationships between behaviour and cognitive concepts like beliefs, attitudes and values were exceedingly complex - contended that any model that attempts to relate action simply to general values alone is doomed to failure as it leaves out of consideration the important role of the situation in which the behaviour occurs. In subsequent work, Feather (1995) argued that outcome expectancies and the valences of particular objects must also be taken into account if the guiding roles of values are to be properly understood. In a similar vein, Smith and Bond (1993) argued that in order to resolve apparent discrepancies, we need to reflect on what we mean by values and what we mean by behaviour. Values are universalistic statements about what we think is desirable or attractive and do not ordinarily contain statements about how they are to be achieved. Behaviours, in contrast, are specific actions which occur in a particular setting and may be observed at a particular time. Blamey and Braithwaite (1997) pointed to another difficulty confronting researchers when they observed that “much
discontent with the predictive power of values in the psychological literature has its roots in observed discrepancies between what people or organisations profess to be their principles and what they actually do” (p. 76). Schwartz (1996) suggested that single behaviours are influenced by a large variety of factors specific to the situation in which they occur and hence it is difficult to predict single behaviours from a transsituational variable like values. He further suggested that values may play little role in behaviour except when there is value conflict, contending that “it is in the presence of conflict that values are likely to be activated, to enter awareness, and be used as guiding principles” (p. 2).
A more optimistic view allows that values can be important predictors of behaviour, but only in combination with other variables. Thus, McInerney (1991, 1995) found that the combination of self-reliance and confidence was related to school dropout. Along these same lines, Roe and Ester (1999) suggested that values may act as moderators. Thus, in order to predict performance, one would need input, moderator (values), and output (performance) variables. If this is indeed the true role of values, then the model we have used in the present study was incomplete in the sense that it contained only moderator and output variables. The failure to use multiple measures has to be counted as a limitation of the present study.
Perhaps what is needed are measures of other variables such as interests, attitudes, beliefs, behavioural intentions, expectancies, self-concepts, and abilities. The interactions of these variables with fundamental values constructs may well lead to better prediction of
achievement behaviour.
Although the main focus of this study was on the role of values in predicting academic achievement, it would be remiss to conclude without mentioning some of the other major factors that we see as contributing to the poor academic performance of many of the
Aboriginal students. Perhaps the most important factor is lack of readiness for tertiary study. As a group, the Aboriginal students in this study has significantly less schooling and scored significantly lower on tests of numerical and linguistic reasoning, both of which are known to predict academic achievement (as they did in this study). We have mentioned but not
criteria are not simply gateways to control numbers of students, they are also intended to point to knowledge and skills needed for success at university. Those without the knowledge and skills are not likely to do well, regardless of age, race, gender, or any other distinguishing characteristic. Thus, one downside of these access and equity policies is that attrition rates are likely to be high for disadvantaged groups before the inequities the policies are designed to address are finally overcome.
A second set of factors likely to contribute to poor performance has to do with the backgrounds of the Aboriginal students. We measured the values of the students themselves but knew little about the communities from which they came or the positions individual students normally occupied in these communities. We were able to collect some anecdotal evidence which suggested that a number of the Aboriginal students had significant
responsibilites in their home communities and found it difficult to make a continued
commitment to university study. Unfortunately, these data were not systematically collected. In future work of this kind we advocate the collection of more background data. In particular, the collection of data from students who have withdrawn from a course. We know from our own experience that collecting further data from students who have withdrawn from study is a very difficult exercise but it is a necessary step if we are to learn more about the non-academic factors that contribute to attrition among Aboriginal students.
References
ACER (1981) ACER higher tests ML-MQ (2nd edition) and PL-PQ manual. Hawthorn, Victoria: Australian Council Educational Research.
Blamey, R., & Braithwaite, V. (1997). The validity of security-harmony social values model in the general population. Australian Journal of Psychology, 49(2), 71-77.
Braithwaite, V., & Law, H. G. (1985). Structure of human values: Testing the adequacy of the Rokeach Value Survey. Journal of Personality and Social Psychology, 49(1), 250-263.
Christie, M. (1985). Aboriginal perspectives on experience and learning: The role of language in Aboriginal education. Victoria: Deakin University Press.
Dabul, A. J., Bernal, M. E., & Knight, G. P. (1995). Allocentric and idiocentric
self-description and academic achievement among Mexican American and Anglo American adolescents. The Journal of Social Psychology, 135, 621-630.
Feather, N.T. (1972). Value similarity and school adjustment. Australian Journal of Psychology, 24, 193-208.
Feather, N. T. (1975). Values in education and society. New York: Macmillan Publishing Co., Inc.
Feather, N. T. (1995). Values, valences and choice: The influence of values on the perceived attractiveness and choice of alternatives. Journal of Personality and Social Psychology, 68(6), 1135-1151.
Fogarty, G.J., & White, C. (1994). Differences between values of Australian Aboriginal and non-Aboriginal students. Journal of Cross Cultural Psychology, 25, 3, 394-408. Garrett, M. (1995). Between two worlds: cultural discontinuity in the dropout of Native
American youth. The School Counselor, 42, 186-195.
Gill, R., & Keats, D. (1980). Elements of intellectual competence: Judgements by Australian and Malay university students. Journal of Cross Cultural Psychology, 11, 233-243. Gleitman, H. (1981). Psychology. New York: W.W. Norton & Company.
Harris, S. (1990). Two way Aboriginal schooling: Education and cultural survival. Canberra: Aboriginal Studies Press.
Hofstede, G. (1980). Culture's consequences: International differences in work-related values. Beverly Hill, CA: Sage.
Hughes, P., & More, A. J. (1993). Aboriginal ways of learning. Adelaide: Education Department of South Australia.
Judge, T. A., & Bretz, R. D. (1992). Effects of work values on job choice decisions. Journal of Applied Psychology, 77(3), 261-271.
Lafromboise, T. D., Timble, J. E., & Mohatt, G. V. (1990). Counseling intervention and American Indian tradition: An integrative approach. The Counselling Psychologist, 18, 628-654.
Lokan, J. J., & Shears, M. (1995). Studies of work importance in Austalia. In D. E. Super, B. Šverko, & C. M. Super (Eds.), Life roles, values and careers (pp. 77-99). San
Francisco: Jossey-Bass Publishers.
Malin, M. (1990). The visibility and invisibility of Aboriginal students in an urban classroom. Australian Journal of Education, 34(3), 312-329.
McClelland, D. C. (1961). The achieving society. Princeton, NJ: Van Nostrand.
McInerney, D. M. (1991). Key determinants of motivation of non-traditional Aboriginal students in school settings: Recommendations for educational change. Australian Journal of Education, 35, 2, 154-174.
McInerney, D. M. (1995). Achievement motivation and indigenous minorities: Can research be psychometric? Cross-Cultural Research, 29, 211-239.
McInerney, D. M., Hinkley, J., & Dowson, M. (1997). Children’s belief about success in the classroom: Are there cultural differences? Paper presented at the annual meeting of the American Educational Research Association, Chicago, March 24-28, 1997.
Peacock, L. (1993). Absenteeism and the Aboriginal child. Aboriginal Child at School, 21, 3-11.
Roe, R.A., & Ester, P. (1999). Values and work: Empirical findings and theoretical perspective, 48(1), 1-21.
Rosen, B. C. (1962). Race, ethnicity, and the achievement syndrome. American Sociological Review, 32, 47-60.
Schwartz, S.H. (1992). Universals in the content and structure of values: Theoretical advances and empirical tests in 20 countries. Advances in Experimental Social Psychology, 25. Zanna. M (Ed.), New York: Academic Press.
Schwartz, S. H. (1996). Value priorities and behavior: Applying a theory of integrated value systems. In C. Seligban, J. M. Olson, & M. Zanna (Eds.), The psychology of values: The Ontario symposium, Volume 8 (pp. 1-24). Mahwah, New Jersey: Lawrence Erlbaum Associates.
Schwartz, S.H., & Bilsky, W. (1987). Toward a universal psychological structure of human values. Journal of Personality and Social Psychology, 53, 550-562.
Schwartz, S.H., & Bilsky, W. (1990). Toward a theory of the universal content and structure of values: Extensions and cross-cultural replications. Journal of Personality and Social Psychology, 58, 878-891.
Smith, P. B., & Bond, M. H. (1993). Culture: the neglected concept. In Social psychology across cultures. Hertfordshire, England: Harvester Wheatsheaf.
Stanley, O., & Hansen, G. (1998). Abstudy: An investment for tomorrow's employment. Canberra: ATSIC.
Innovations in cross-cultural psychology (pp. 442-457). Amsterdam/Lisse: Swets & Zeitlinger.
Triandis, H.C. (1990). Cross-cultural studies of individualism and collectivism. In J. Berman (Ed.), Nebraska Symposium on Motivation, 1989 (pp. 41-133). Lincoln: University of Nebraska Press.
Triandis, H.C. (1995). Motivation and achievement in collectivist and individualist cultures. Advances in motivation and achievement (Vol. 9, pp. 1-30). Greenwich, Conn: JAI Press.
Triandis, H. C., Leung, K., Villareal, M. V., & Clark, F. L. (1985). Allocentric versus idiocentric tendencies: convergent and discriminant validation. Journal of Research in Personality, 19, 395-415.