City, University of London Institutional Repository
Citation
:
Dillingham, I. (2012). Visual Analytical Approaches to Evaluate Uncertainty and Bias in Crowdsourced Crisis Information (MPhil to PhD transfer). London, UK: City University London.This is the unspecified version of the paper.
This version of the publication may differ from the final published
version.
Permanent repository link:
http://openaccess.city.ac.uk/1139/Link to published version
:
MPhil to PhD transferCopyright and reuse:
City Research Online aims to make research
outputs of City, University of London available to a wider audience.
Copyright and Moral Rights remain with the author(s) and/or copyright
holders. URLs from City Research Online may be freely distributed and
linked to.
City Research Online: http://openaccess.city.ac.uk/ [email protected]
Visual Analytical Approaches to Evaluate
Uncertainty and Bias in Crowdsourced Crisis
Information
Iain Dillingham giCentre, School of Informatics City University London, EC1V 0HB
May 8, 2012
Abstract
Increasing numbers of people are using social media to exchange in-formation during crisis and conflict events. On the one hand, the hu-manitarian community is reluctant to use this information in the re-sponse effort as it fears the cost of untrustworthy and inaccurate infor-mation. On the other, the volunteer and technical communities have attempted to resolve this impasse by crowdsourcing crisis informa-tion; for example, by asking volunteers to ascertain whether a crisis report is trustworthy and accurate.
Trust and accuracy are two characteristics of uncertainty: The fact that each is likely to have spatial, temporal and thematic aspects is sup-ported by research, which suggests that geography characterises crisis information. Consequently, a research programme grounded in geo-graphic information science, (geo)visualization and (geo)visual ana-lytics is presented that seeks to evaluate the degree to which uncer-tainty and bias (systematic variation) are found in crowdsourced cri-sis information; and seeks to provide heuristics to help manage these factors. This programme consists of a methodology for undertaking interactive, analysis-guided software development that is informed by action research, scenario-based design and Munzner’s model of visu-alization validation; and a prototype software application that com-bines interactive visual representations with spatial statistical func-tions to explore two datasets of crowdsourced crisis information.
methodology and its implementation are placed within an appropri-ate work plan. Three supporting publications are included, as well as supporting statements regarding the author’s skills and engagement with the academic community.
1 Introduction
People affected by crisis events are turning to new communications tech-nologies to exchange information (Coyle & Meier 2009). However, whilst the humanitarian community tend to see the risks associated with these technologies (Tapia et al. 2011), the volunteer and technical communities
focus on the rewards (Liu & Palen 2010).1 Nevertheless, organisations such
as Ushahidi (Ushahidi 2011c) are seeking to reconcile the costs of using
untrustworthy and inaccurate information with the benefits of engaging a large number of motivated and able individuals. They are doing so by
developing software to support the gathering (Ushahidi 2011b),
augment-ing (Ushahidi 2011a) and verifying (Ushahidi 2011d) of crisis information,
where these tasks arecrowdsourced, or completed by a heterogeneous group
in response to an open call (Howe 2006, 2009).
Trust and accuracy, however, are not the only characteristics of uncertainty (MacEachren et al. 2005, Thomson et al. 2005). Furthermore, each charac-teristic of uncertainty has spatial, temporal and thematic aspects (Veregin 1999). Analysis is as important as situational information to humanitarian response (King 2005) but analysis that ignores uncertainty (in all its forms) is of limited use (Fisher 1999). Geographic information science has made considerable progress in evaluating and communicating the uncertainty as-sociated with geographic information (Devillers et al. 2010) and uncertainty is a familiar topic in the visualization (Pang et al. 1997) and the geovisualiza-tion literature (MacEachren et al. 2005, Thomson et al. 2005). Consequently, geographic information science, visualization and geovisualization are well placed to help evaluate uncertainty and bias in crowdsourced crisis infor-mation.
1The term ‘volunteer and technical communities’ is from Harvard Humanitarian
2 Research questions, aims and objectives
• To what degree are uncertainty and bias found in crowdsourced crisis information?
– What characteristics of uncertainty can be identified in
crowd-sourced crisis information?
– To what degree do these characteristics vary over space?
– To what degree do these characteristics vary over time?
– To what degree do these characteristics vary with theme?
– Are any of these characteristics subject tobias, or systematic
vari-ation?
• What heuristics help manage uncertainty and bias in crowdsourced crisis information?
3 Literature
3.1 Characterising uncertainty
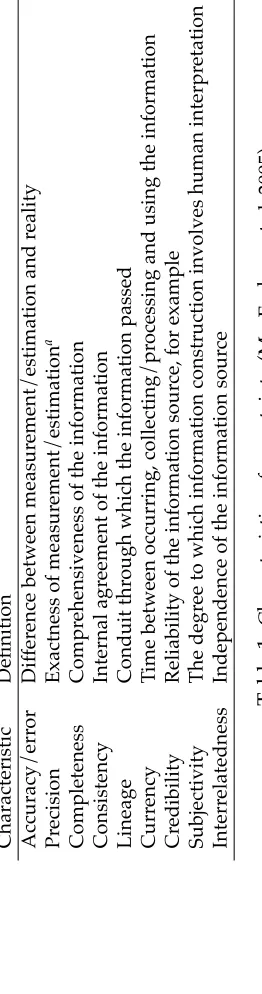
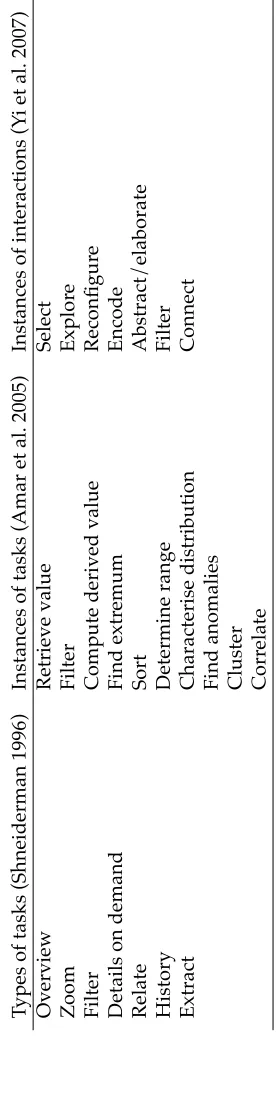
MacEachren et al. (2005), building on Thomson et al. (2005), make two fun-damental points about uncertainty: It is a complex concept that has domain-specific interpretations; and effective characterisation of uncertainty is cen-tral to effective visual representation of uncertainty. With these points in mind, they identify nine characteristics of uncertainty relevant to the ge-ographic information science and geovisualization domains (see Table 1). Veregin (1999) argues that four of these characteristics (accuracy, precision, completeness and consistency) have spatial, temporal and thematic aspects to match the spatial, temporal and thematic components of geographic in-formation. Consequently, it is reasonable to conclude that the nine charac-teristics of uncertainty identified by MacEachren et al. (2005) have spatial, temporal and thematic aspects.
caused by vagueness or by ambiguity (Fisher 1999). Whilst vagueness and ambiguity do not have obvious analogues with the characteristics of uncer-tainty identified by MacEachren et al. (2005), accuracy is clearly common to both. One possible reason for this commonality is that accuracy is well researched in geographic information science (Fisher 1999) and techniques have been developed to estimate the accuracy of point, line and polygon objects (Devillers et al. 2010). However, these techniques involve compar-ing lower accuracy representations to higher accuracy representations (see, for example, Goodchild & Hunter 1997), meaning that whilst Haklay (2010) is able to evaluate the accuracy of crowdsourced geographic information by comparing an OpenStreetMap dataset to an Ordnance Survey dataset, it is much harder to evaluate the accuracy of crowdsourced crisis information because no higher accuracy representations exist.
Wieczorek et al. (2004) present a possible solution to the problem of evalu-ating uncertainty without relying on higher accuracy representations—the
‘point-radius’ georeferencing method. Georeferencingis the process of
con-verting geographically relevant text into one or more geographic represen-tations (Goldberg 2011). Whereas many georeferencing methods result in a point that represents geographically relevant text, the point-radius geo-referencing method results in a point and a radius: The point represents the most probable location of the geographically relevant text; the radius represents the maximum distance within which the the geographically rel-evant text is to be found (Wieczorek et al. 2004). Working within the natural history domain, Wieczorek et al. (2004) argue that a ‘collecting event’ has spatial and temporal components, namely the place and time a specimen was collected. Wieczorek et al. (2004) call the spatial component the ‘local-ity description’ because the place a specimen was collected is often
descrip-tive.2 However, locality descriptions are not exclusive to the natural history
domain; Doherty et al. (2011), for example, apply the point-radius georef-erencing method to locality descriptions in historical records of search and rescue incidents. Consequently, it is reasonable to conclude that the point-radius georeferencing method can be applied to records of events in space and time, where the spatial component of each record is a description of a place. Within the context of the current research, the purpose of applying this method would be less to identify the location of an event and more to identify the uncertainty associated with the location of an event.
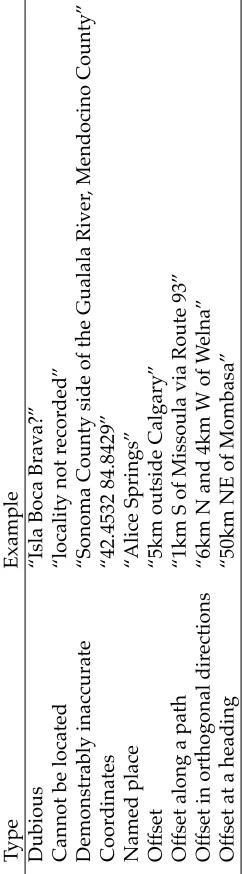
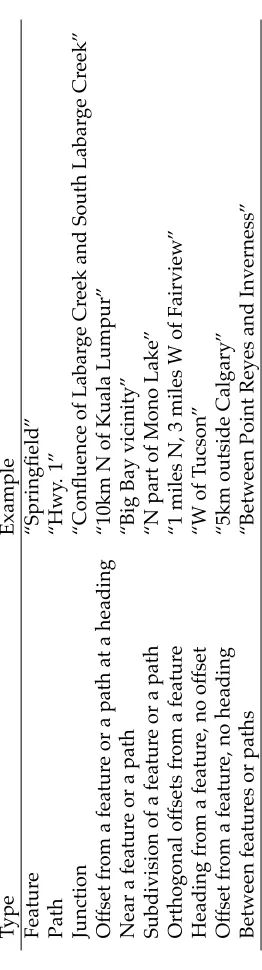
It is clear that of the nine types of locality descriptions Wieczorek et al. (2004)
2Similarly, Fisher & Unwin (2005, p.6) highlight the distinction between
found within natural history collections (see Table 2), eight are related to classes of well defined geographic objects. In related research, of the ten types of locality descriptions Guo et al. (2008) found within natural history collections (see Table 3), all are related to classes of well defined geographic objects. Consequently, it is not surprising that of the six types of uncertainty identified by Wieczorek et al. (2004) and Guo et al. (2008) (the extent of the locality; the map datum and scale; the precision of distance measurements, direction measurements and coordinate measurements), all relate to accu-racy and precision. Clearly, whilst the point-radius georeferencing method has the advantage of not relying on higher accuracy representations, it has the disadvantage of evaluating only two characteristics of uncertainty. In contrast to Wieczorek et al. (2004), Guo et al. (2008) account for vagueness when they delimit areas of uncertainty associated with locality descriptions. However, like Wieczorek et al. (2004), Guo et al. (2008) base these areas on well defined ‘reference objects’, such as named places. Whilst well defined reference objects may be present in locality descriptions in the natural his-tory domain and in historical records of search and rescue incidents, local-ity descriptions from other domains may be different. For example, Jones et al. (2008) contrast well defined administrative geographies with poorly defined vernacular geographies in the same way that Fisher & Unwin (2005) contrast space with place. Services such as Flickr are rich sources of vernac-ular geographies (Hollenstein & Purves 2010, Purves et al. 2011) and whilst these platforms were not developed to crowdsource tasks, like Ushahidi they were developed to manage information from a heterogeneous group. Consequently, it is reasonable to conclude that vernacular geographies may be present in crowdsourced crisis information; a conclusion supported by
Dillingham et al. (2012) (seeCompleted work). This, in turn, questions the
ap-plication of the point-radius georeferencing method to crowdsourced crisis information.
Gelernter & Mushegian (2011) Vieweg et al. (2010)
Country County name
State, region, city Place name
Abbreviated place City name
Neighbourhood or district Address
Topographical or infrastructure feature Highway
Cluster of buildings
Geolocatable building, area or organisation What and where
[image:10.612.154.458.127.286.2]Street address Multiple places Generic place Place with hashtag
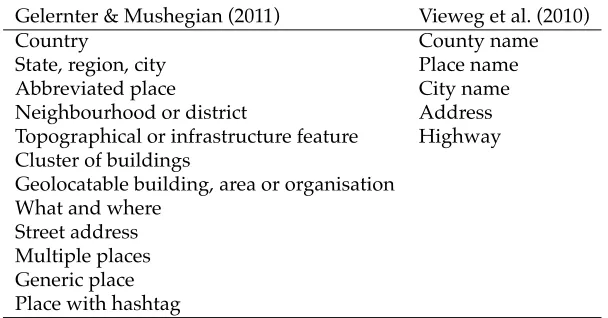
Table 4:Location-types in crisis-related microtext
3.2 Crisis information
There is a growing body of work on the geographic nature of crisis infor-mation, especially collections of short text messages (‘microtext’), such as ‘tweets’. For example, Gelernter & Mushegian (2011) and Vieweg et al. (2010) report the location-types present in three collections of crisis-related microtext (see Table 4). Gelernter & Mushegian (2011) identified twelve location-types in 300 tweets related to the 2011 earthquake in Christchurch, New Zealand. Vieweg et al. (2010) identified five location-types in 19,162 tweets related to a flooding event and 2,779 tweets related to a wildfire event in the USA in 2009.
characterised by considerable uncertainty. In contrast, the flooding event was predictable in location and had a relatively long warning phase. In summary, existing work suggests that geographic information is com-mon in crisis-related microtext. However, the degree to which this is the case appears to depend on the nature and phase of the crisis event. In ad-dition, although existing work has identified relatively well defined classes of geographic objects in crisis information, the influence of the nature of the crisis event; the presence of named places at multiple geographic scales; and the presence of location types such as “Generic place” and “Multiple places” suggest vagueness and ambiguity are important considerations.
3.3 Visual analytics
Although crisis information is geographic in nature, the geographies are potentially vague and ambiguous: “In Les Cayes” and “provisional shleter [sic] on Champs-de-Mars” are two example locations from the Haiti Crisis
Map (Ushahidi 2009) (seeData). Visual analytics is a multi-disciplinary
ap-proach that seeks to combine human judgement and computational tech-niques to “detect the expected and discover the unexpected” in complex situations such as these (Thomas & Cook 2006, p.10). Consequently, visual analytics is an ideal approach to explore uncertainty and bias in crowd-sourced crisis information.
Visual analytics can be defined as “the science of analytical reasoning fa-cilitated by interactive visual interfaces” (Thomas & Cook 2006, p.10). An analyst who applies the analytical reasoning process seeks insight (Thomas & Cook 2006), where insight is complex, deep, qualitative, unexpected and relevant (North 2006). He or she does so using visual representations and interactions, techniques that enhance cognition (Card et al. 1999). In this way, visual analytics is a process supported by techniques where the de-sired outcome is insight. However, process and techniques are closely in-terrelated.
The analytical reasoning process and the development of specific visual representations and interactions within the context of the current research
are discussed below (seeMethods). However, the general literature on
3.3.1 Visual representations
MacEachren et al. (2005) argue that, from the geographic information sci-ence and geovisualization perspectives, most research into the visual rep-resentation of uncertainty has focused on the application of Bertin’s visual variables (Bertin 1967) according to cartographic good practice. However, additional visual variables have not been applied as consistently. For exam-ple, although MacEachren (1992) adds transparency (opacity), this addition has been used to represent more certainty and less certainty, depending on the underlying visual metaphor (MacEachren et al. 2005).
As well as visual ‘primitives’, MacEachren et al. (2005) discuss glyphs, or
compound symbols. Glyphs have been used to represent data, and the uncertainty associated with data, simultaneously (MacEachren et al. 2005). Similarly, rather than producing a single representation, multiple represen-tations can been produced and compared (MacEachren et al. 2005). In such cases, Beard & Mackaness (1993, cited in MacEachren et al. 2005) suggest there is a fundamental conflict between representing the data and repre-senting the uncertainty associated with the data.
3.3.2 Interactions
Pike et al. (2009) draw on theories of situated cognition and distributed cog-nition to argue that interaction is fundamental to the analytical reasoning process. In doing so, they distinguish between ‘high level’ and ‘low level’ interactions where the former are between the analyst and the problem and the latter are between the analyst and the visual representation. Similarly,
Norman (1998) distinguishes betweengoals, or what to achieve and
inten-tions, or how to achieve it.
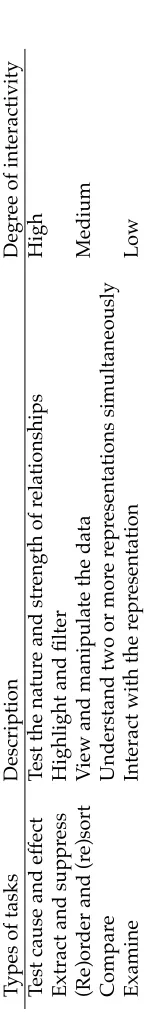
dis-agree; tasks and interactions are described separately, although tasks are ordered by degree of interactivity (see Tables 6 and 7). Finally, Amar et al. (2005) and Yi et al. (2007) suggest the elements in their typologies are spe-cific instances, rather than generic types. However, Shneiderman (1996) argues that ‘filter’ is a type of task (i.e. generic) (see Table 5). To confound this specific–generic dichotomy, Crampton (2002) suggests that ‘filter’ is a specific instance of both a type of task (‘extract and suppress’) and a type of interaction (‘interaction with the data’) (see Tables 6 and 7).
3.3.3 Situating visual analytical approaches
In summary, the literature on visual representations and interactions situ-ates the visual analytical approaches that are at the core of the current re-search. The visual representation of uncertainty is well researched in ge-ographic information science and geovisualization. Furthermore, a link to cartography is established through these domains. Similarly, the visualiza-tion community has considered the nature of interacvisualiza-tions, although recon-ciling this work is problematic. Nevertheless, enumerating interactions, be they general types or specific instances, allows one to imagine, build and evaluate (Crampton 2002) the tools that are necessary to evaluate uncer-tainty and bias in crowdsourced crisis information.
4 Data
Two datasets have been obtained for the current research. The first relates to the 2010 earthquake in Haiti (Ushahidi 2009); the second to the 2011 armed conflict in Libya (OCHA 2011). Both datasets come from Ushahidi, soft-ware for crowdsourcing the gathering, augmenting and verifying of crisis
information (Ushahidi 2011c).
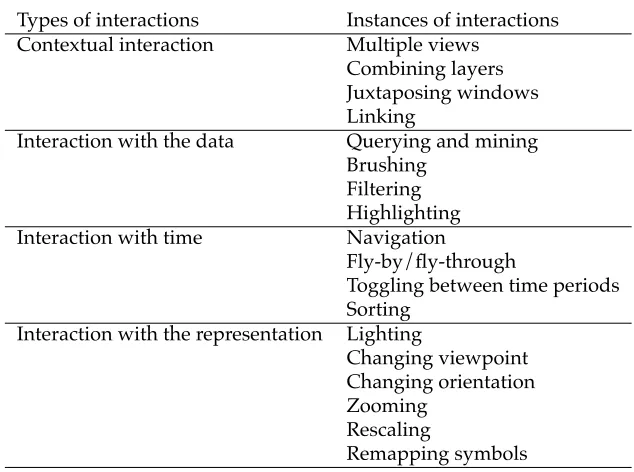
Types of interactions Instances of interactions
Contextual interaction Multiple views
Combining layers Juxtaposing windows Linking
Interaction with the data Querying and mining
Brushing Filtering Highlighting
Interaction with time Navigation
Fly-by/fly-through
Toggling between time periods Sorting
Interaction with the representation Lighting
Changing viewpoint Changing orientation Zooming
Rescaling
[image:16.612.146.463.125.361.2]Remapping symbols
Table 7:Interactions according to Crampton (2002)
that could be used to evaluate lineage). Nevertheless, these problems are likely to be common in other forms of crowdsourced information, making the current research interesting, challenging and applicable beyond the cri-sis domain.
5 Methods
5.1 Approach to the literature
The approach to the literature is semi-structured and iterative:
• Identify core publications. Identify, read and follow the references in core papers or chapters.
• Identify relevant journals based on the references in core papers or chapters. Monitor recent papers in relevant journals.
• Search relevant databases.
SeeLiterature sourcesfor additional information.
5.2 Approach to the research process
5.2.1 Background
Analysts, when reasoning analytically, create and test hypotheses and sce-narios and discover relationships in information (Thomas & Cook 2006). In this way, analytical reasoning is similar to the sensemaking process de-scribed by Pirolli & Card (2005). In this process the analyst gathers informa-tion; represents some of this information in a schema (a task-specific knowl-edge structure); and generates insight by manipulating the representation (Pirolli & Card 2005). Ideally, the sensemaking process results in knowl-edge or in action (Pirolli & Card 2005). In summary, analytical reasoning and sensemaking are similar in terms of the tasks the analyst undertakes. However, sensemaking highlights the role of schemas (task-specific knowl-edge structures) (Pirolli & Card 2005).
The analytical reasoning and sensemaking processes resemble Checkland’s model of rational thought (Checkland 1985, cited in Baskerville & Wood-Harper 1996), a model that is central to action research (Oates 2006). This
model consists off, an intellectual framework;m, a methodology for using
the intellectual framework; anda, an area of application (Checkland 1985,
cited in Baskerville & Wood-Harper 1996). Within the analytical reasoning
and sensemaking processes,f would include the analyst’s schemas,mthe
analyst’s tasks andais synonymous with a domain. In summary, the
an-alytical reasoning and sensemaking processes can be abstracted to a more general model. This model is central to action research.
action research brings analytical reasoning and sensemaking, and the de-velopment of visual representations and interactions within the scope of a clear approach to science.
There are three relevant criticisms of action research. Firstly, action re-search may seem unscientific (Baskerville & Wood-Harper 1996). Action research is a collaborative, interventionist approach (Baskerville & Wood-Harper 1996) within which researchers and practitioners follow an iterative cycle of diagnosing the problem situation, planning action, taking action, evaluating action and specifying learning (Susman & Evered 1978, cited in Baskerville & Wood-Harper 1996, Oates 2006). However, collaboration be-tween researchers and practitioners is common in the visualization liter-ature. Lloyd & Dykes (2011) describe a collaborative, interventionist ap-proach to the geovisualization design process. Not only do Lloyd & Dykes consider this process to be subjective, they also consider that “objectivity is neither possible nor necessary … designs should be developed through discourse” (Lloyd & Dykes 2011, p.2501). Furthermore, van Wijk (2006) suggests user-centred approaches help to bridge the gaps between visual-ization designers (analogous to researchers) and visualvisual-ization users (analo-gous to practitioners). In summary, members of the visualization commu-nity consider that a collaborative, interventionist approach to the develop-ment of visual representations and interactions is acceptable.
and empirical data collection methods, is acceptable.
Thirdly, the outcomes of action research are contingent on f, mand a, as
well as on the researcher, making it hard to generalise (Baskerville & Wood-Harper 1996). However, whilst reliability (repeatability) is the foundation of generalisation, validity—“the degree to which the research accomplished its intended goals within its scientific paradigm”—is acceptable (Baskerville & Wood-Harper 1996, p.243). Munzner (2009) proposes a similar approach, although without an explicit scientific paradigm, in her model of visual-ization validation. The ‘domain characterisation’ stage within this model describes the ‘intended goals’ as problems (domain tasks) and data. Mun-zner (2009) argues that the success of this level should be validated using ‘grounded evaluation’, an approach that attempts to situate the evaluation process within a visualization’s context of use (Isenberg et al. 2008). To further address the problem of generalisation, Baskerville & Wood-Harper (1996, p.243) suggest action researchers “must exercise restraint in their con-clusions” and circulate their findings amongst the scientific community. This is clearly the case in visual analytics, where good research, such as Meyer et al. (2010), Meyer et al. (2009), Nielsen et al. (2009) and Weaver et al. (2007), is clearly scoped. In summary, members of the visualization community accept that the development of visual representations and in-teractions is contingent. However, approaches have been developed to ad-dress the problem of generalisation.
5.2.2 Implementation
The current research proposes a visual analytical approach to evaluate
un-certainty and bias in crowdsourced crisis information that isinformed by
ac-tion research. To summarise the raac-tionale:
1. Rigorous action research strongly resembles visual analytics. In other words, the visualization community is aligned with the tenets of ac-tion research.
2. Action research applies both to the analytical reasoning process and to the development of visual representations and interactions. This distinction, between analysis and development, is an important one, although it is noted that both process and techniques are closely in-terrelated.
intellec-tual framework (f), the methodology for using the intellectual
frame-work (m) and the area of application (a) (Checkland 1985, cited in
Baskerville & Wood-Harper 1996). The second model, which Oates (2006) suggests instantiates the first model as the research process, specifies an iterative cycle of diagnosing the problem situation, plan-ning action, taking action, evaluating action and specifying learplan-ning (Susman & Evered 1978, cited in Baskerville & Wood-Harper 1996, Oates 2006). These models will be used to validate and verify the visual representations and interactions that will be developed to
ad-dress the working hypotheses, where “validationis about whether one
has built the right product, andverificationis about whether one has
built the product right” (Munzner 2009, p.923, original emphasis). This is especially important as the current research is not based on a partnership between domain experts and experts in visual analytics; it exemplifies the ‘curiosity-driven’ approach to a problem suggested by van Wijk (2006).
The intellectual framework (f) consists of the characteristics of uncertainty,
the nature of crisis information and the literature on visual representations
and interactions (seeLiterature). The methodology for using the intellectual
framework (m) draws on scenario-based design and the model of
visualiza-tion validavisualiza-tion proposed by Munzner (2009). The area of applicavisualiza-tion (a) is
crisis information.
The research process instantiates thef, manda as an iterative cycle of
di-agnosing the problem situation, planning action, taking action, evaluating
action and specifying learning. The first iteration involvesdiagnosing the
problem situationandplanning action, where working hypotheses, scenarios and claims are generated. The working hypotheses frame the analytical reasoning process; the scenarios and claims frame the development of the visual representations and interactions to address the working hypotheses. The scenarios and claims allow a context of use to be envisioned before it exists (Carroll 2000).
Carroll & Rosson (1992) describe claims as ‘causal schemas’ in the form: [artifact feature or technique] CAUSES [desirable psychological consequence] BUT MAY ALSO CAUSE [undesirable psycholog-ical consequence]
The scenarios and claims act as the basis fortaking action, where visual rep-resentations and interactions are developed based on ‘domain data’ (Lloyd & Dykes 2011). These visual representations and interactions need not be in software; they may consist of paper sketches that are developed into dig-ital sketches in subsequent iterations. Concurrently, these visual represen-tations and interactions are used to reason analytically about domain data. The continuous ‘internal dialogue’ (Duncan 2004) of development and anal-ysis is documented using ethnographic methods.
The outcomes of taking action are reflected upon whenevaluating action.
The degree to which the analytical reasoning, facilitated by the visual rep-resentations and interactions, have led to insight is assessed; where this is not the case, it may be because the domain characterisation (analogous to scenarios) and domain abstractions (analogous to claims) are misaligned (Munzner 2009). An assessment is made of the degree to which the claims have ‘held’. This claims assessment is a precursor to a design study; a form of principled justification and appropriate immediate validation of visual encodings and interactions (Munzner 2009).
Finally, the first iteration concludes withspecifying learning. This learning is
in the form of practice (action) and knowledge (research) and should be di-rected ‘inwards’ (to the next iteration) and ‘outwards’ (to the scientific com-munity) (Susman & Evered 1978, cited in Baskerville & Wood-Harper 1996, Oates 2006). After several iterations, the insight and claims assessment are brought together in a design study, where a design study demonstrates that a design solves a problem in a domain (Munzner 2008).
6 Work plan
os in g/ pl an ni ng d ev el op m en t ng act io n ch r ep res en tat io ns /in ter act io ns o n pap er /in P ro ces si ng uat in g act io n ys e cl ai m s fyi ng lear ni ng os in g/ pl an ni ng d ev el op m en t ng act io n ev el op r ep res en tat io ns /in ter act io ns o n pap er /in P ro ces si ng ocu m en t ' in ter nal d ial ogu e' uat in g act io n ocu m en t evi den ce th at s up po rt s/ co nt rad ict s w or ki ng hyp ot hes es ys e cl ai m s fyi ng lear ni ng ocu m en t p ract ice an d kn ow led ge os in g/ pl an ni ng od ify w or ki ng hyp ot hes es od ify scen ar io s an d cl ai m s d ev el op m en t ng act io n ev el op r ep res en tat io ns /in ter act io ns in P ro ces si ng ocu m en t ' in ter nal d ial ogu e' uat in g act io n ocu m en t evi den ce th at s up po rt s/ co nt rad ict s w or ki ng hyp ot hes es ys e cl ai m s fyi ng lear ni ng ng in si gh t an d cl ai m s an al ys is to get her in a des ign s tu dy en er at e w or ki ng hyp ot hes es en er at e scen ar io an d cl ai m s ocu m en t ' in ter nal d ial ogu e' ocu m en t evi den ce th at s up po rt s/ co nt rad ict s w or ki ng hyp ot hes es ocu m en t p ract ice an d kn ow led ge od ify exi st in g/ gen er at e new w or ki ng hyp ot hes es od ify exi st in g/ gen er at e new s cen ar io an d cl ai m s 201 3 Ja nua ry 201 3 F ebr uar y 201 3 M arc h 201 3 A pri l 201 3 M ay 201 3 Ju ne 201 3 Ju ly 201 3 A ugu st 201 3 S ept em ber 201 3 O cto ber 201 3 N ove mbe r 201 2 D ece mbe r 1 1 1 1
1 1 1 1 1 1 1 1 1 1 1
7 Completed work
In my first 18 months as a PhD student I have had one paper and two peer-reviewed posters and extended abstracts accepted by national and inter-national conferences. In addition, I have developed the skills necessary to
complete the current research in the allotted time period (seeWork plan).
7.1 Publications
A paper has been accepted by the Geographic Information Science Research UK 20th Annual Conference, which will take place in April 2012 (Dilling-ham et al. 2012). This paper combines the classifications developed by
Wiec-zorek et al. (2004) and Guo et al. (2008) (seeLiterature), applies this
com-bined classification to locations from the Haiti Crisis Map (Ushahidi 2009)
(see Data) and compares the proportions of locations in each category to
those in a similar dataset from MaNIS, theMammal Networked Information
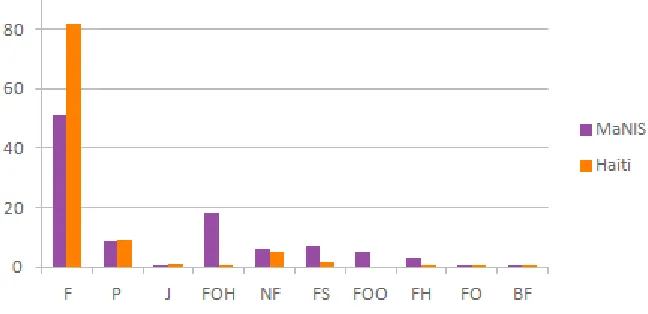
System. It concludes that whilst there are similarities between the datasets (see Figure 1), crowdsourced crisis information presents significant chal-lenges with respect to vagueness, ambiguity and precision.
Comments from the reviewers include:
“This is a fascinating and well referenced paper … This work has the potential to make a significant contribution to humanitarian aid activities during and after disasters and should make a very good GISRUK presentation.”
“[This is an] Interesting paper, addressing a pertinent and con-textual question of location inaccuracy…”
A peer-reviewed poster and extended abstract were presented to the IEEE Conference on Visual Analytics Science and Technology, which took place in October 2011 (Dillingham, Dykes & Wood 2011). These documents out-line the current research and discuss an interactive software prototype (see
Figures 2 and 3). This prototype, calledIncidentExplorer, allows the visual
exploration of a dataset containing crowdsourced crisis information that re-lates to the 2011 armed conflict in Libya (OCHA 2011) and exemplifies some of the visual representations and interactions that will be developed to ad-dress the working hypotheses during the current research.
Figure 1: Category distributions (Dillingham et al. 2012)
“…the proposed project in this poster is very well situated and should generate some interesting discussions…”
A peer-reviewed poster and extended abstract related to an earlier project were presented to the Geographic Information Science Research UK 19th Annual Conference (Dillingham, Mills & Dykes 2011). These documents describe the evaluation of four software prototypes using the model of visu-alization validation proposed by Munzner (2009). Each software prototype used ‘heat mapping’ to explore road incident data. The project can be seen as an introduction to many aspects of the current research, such as develop-ing and evaluatdevelop-ing visual representations and interactions and undertakdevelop-ing the analytical reasoning process.
Figure 2:IncidentExplorer, overview (Dillingham, Dykes & Wood 2011)
[image:29.612.125.490.446.634.2]Characterising Locality Descriptions in Crowdsourced Crisis Information
Iain Dillingham, Jason Dykes and Jo Wood
giCentre, School of Informatics, City University London, EC1V 0HB Tel. +44 (0)20 7040 295, Fax +44 (0)20 7040 8584
[email protected], [email protected], [email protected]
Summary: Humanitarian organisations are reluctant to use information from social media when responding to crises or conflicts, identifying trust and accuracy as principal concerns. However, the Geographic Information Science literature contains significant research into uncertainty, research we draw upon here to characterise locality descriptions in incident reports related to the 2010 earthquake in Haiti. We do so using a classification developed to georeference locality descriptions in MaNIS, the Mammal Networked Information System. We found that although there are similarities between the datasets, crowdsourced crisis information presents significant challenges with respect to vagueness, ambiguity and precision (resolution).
KEYWORDS: Uncertainty, Locality Descriptions, Crowdsourced Crisis Information, Ushahidi
1. Introduction
People affected by crisis or conflict events are turning to social media to communicate with the ‘outside’ and the ‘inside’ world (Coyle and Meier, 2009). On the one hand, humanitarian organisations are reluctant to use information from social media in the response effort (Tapia et al., 2011) because the risks of using untrustworthy and inaccurate information are considerable (Coyle and Meier, 2009). On the other hand, organisations such as Ushahidi have sought to mitigate these risks by developing software to gather, augment and verify crisis information (Ushahidi, 2011c). However, unlike similar organisations such as MapAction (MapAction, 2012), within Ushahidi these tasks are crowdsourced, or completed by a heterogeneous group in response to an open call (Howe, 2009).
Accuracy and trust (credibility) are characteristics of uncertainty (MacEachren et al., 2005). Geographic Information Science (GISc) has made considerable progress in evaluating and communicating the uncertainty associated with geographic information (Devillers et al., 2010) and uncertainty is a familiar topic in the GISc literature (MacEachren et al., 2005). Consequently, GISc is well placed to help evaluate the uncertainty associated with crowdsourced crisis information. As a first step towards this evaluation, we consider accuracy. We address two research questions: (1) What types of locality descriptions are present in crowdsourced crisis information? (2) Are the proportions of these types different to those present in related datasets? To do so, we adapt an existing classification of locality descriptions present in MaNIS, the Mammal Networked Information System, and apply it to crowdsourced crisis information.
2. Literature review
Where geographic objects are well defined, uncertainty is caused by error (Fisher, 1999). Accuracy is well researched in GISc (Fisher, 1999) and techniques have been developed to evaluate the error associated with point, line and polygon objects (Devillers et al., 2010). However, these techniques involve comparing lower accuracy representations to higher accuracy representations (see Goodchild and Hunter, 1997). Consequently, whilst Haklay (2010) is able to evaluate the accuracy of crowdsourced geographic information by comparing an OpenStreetMap dataset to an Ordnance Survey dataset, it is considerably harder to evaluate the accuracy of crowdsourced crisis information because no higher accuracy representations exist.
Wieczorek et al. (2004) present a solution to the problem of evaluating uncertainty without relying on higher accuracy representations—the ‘point-radius’ georeferencing method. They use this method to georeference records in MaNIS, where the spatial component of each record is a description of the location where the specimen was collected. In addition, the point-radius method has been used to georeference historical search and rescue records (Doherty et al., 2011).
[image:31.612.89.539.49.714.2]Table 1: Combined classification of locality descriptions (following Wieczorek et al., 2004 and Guo et al., 2008)
Code Category Example U Unsure
C Coordinates
F Feature “Springfield”
P Path “Hwy. 1”
J Junction “Confluence of Labarge Creek and South Labarge Creek”
FOH Offset from a feature or path at a heading “10km N of Kuala Lumpur” NF Near a feature or path “Big Bay vicinity” FS Subdivision of a feature or path “N part of Mono Lake”
FOO Orthogonal offsets from a feature “1 miles N, 3 miles W of Fairview” FH Heading from a feature, no offset “W of Tucson”
FO Offset from a feature or path, no heading “5km outside Calgary”
BF Between features or paths “Between Point Reyes and Inverness”
Table 2: Combined classification of locality descriptions compared to Wieczorek et al. (2004) and Guo et al. (2008)
Code Wieczorek et al. (2004) Guo et al. (2008) U Dubious, Cannot be located, Demonstrably
inaccurate C Coordinates
F Named place Feature
P Path or linear feature
J Junction
FOH Offset at a heading Offset from a feature (or a path) at a heading NF Near a feature or a path
3. Data
[image:33.612.87.532.67.722.2]The Haiti Crisis Map (Ushahidi, 2009) is an Ushahidi deployment—an instance of the Ushahidi software platform—that was set up in response to the 2010 earthquake in Haiti. All 3,606 incident reports that comprise the Haiti Crisis Map were downloaded as a comma-separated values file. Table 3 contains one example.
Table 3: Example incident report from the Haiti Crisis Map (Ushahidi, 2009)
Attribute Example value
id 3923
title IDP camp of 250 families has no aid, Cite Soleil date 2010-03-28 22:00:00
location Pois Congo, Cite Soleil
description IDP camp of 250 families in Pois Congo in Cite Soleil ... category 2b. Penurie d’ eau | Water shortage, ...
latitude 18.607433 longitude -72.319667 approved YES verified YES
Whilst people can report incidents based on their own knowledge or experience, they can also do so based on secondary sources such as SMSs, emails and social media. Consequently, when an incident is reported, several of the attributes in Table 3 may not have values. Typically, one team of volunteers will georeference the ‘location’ and populate the ‘latitude’ and ‘longitude’ attributes (Ushahidi, 2011a), whilst another will approve and verify the incident report (Ushahidi, 2011b). However, incident reports are not versioned, so it is impossible to determine how an incident report changes— and who made those changes—over time.
4. Methodology
The lead author and two additional participants (P1, P2 and P3) independently classified the locality descriptions in the Haiti dataset. Although not experts in the geography of Haiti, all have undergraduate geography degrees, two have postgraduate geographic information systems degrees and all are research students who routinely work with geographic information. In this respect, each participant performed a role that Goodchild (2009) argues is central to academic geography; providing ‘quality control’ in situations where individuals whose ‘activity space’ intersects with the study area are unavailable.
To avoid bias, each participant was given a spreadsheet within which row order was randomised and the ‘id’ attribute was hidden. In addition, each participant was given the information in Table 1 to guide the classification process. In cases where participants were unsure about which category a textual location belonged, they were instructed to select ‘Unsure’ and comment on their rationale. This captured some of the uncertainty associated with the classification process.
5. Results
For all participants, the most frequent category in the Haiti dataset is ‘Feature’. ‘Path’ is second for P1 and P2, and third for P3; ‘Unsure’ is second for P3, third for P1 and fifth for P2 (Figure 1). Overall, participants were in agreement in 63.8% of cases (2302), partial agreement in 26.3% of cases (947) and disagreement in 9.9% of cases (357).
[image:34.612.89.527.49.734.2]To allow a like-for-like comparison between the Haiti and the MaNIS datasets, partial agreement cases were classed by simple majority vote and disagreement cases were classed as ‘Uncertain’. All 385 ‘Uncertain’ cases (357 disagreement cases plus 28 ‘Uncertain’ cases) and 19 ‘Coordinates’ cases were then removed. Figure 2 illustrates that in both datasets, the largest proportion of cases are categorised ‘F’ (51.0% MaNIS, 81.6% Haiti).
Figure 1: Category frequencies by participant, Haiti dataset
Figure 2: Category distributions, MaNIS and Haiti datasets
6. Discussion
The similarities between the datasets suggest that the point-radius georeferencing method could be applied to the Haiti dataset. However, the results suggest this process would be far from straightforward.
therefore, a locality description describes a single, unambiguous location. However, participants identified several cases in the Haiti dataset where target objects were ambiguous and referenced objects were vague (for example “Rue Christ-Roi, this is near Hospital Christ-Roi”). Following the instructions, participants classified locality description as ‘Unsure’ and commented on their rationale. However, the ability to evaluate accuracy by exploring differences within, as well as between, locality descriptions requires further analysis. Certainly the vagueness and ambiguity (Fisher, 1999) and precision (resolution) (Veregin, 1999) associated with locality descriptions present interesting research directions.
Although participants attempted to classify locality descriptions consistently, they were uncertain as to whether they did so accurately. Participants related their uncertainty to limited local knowledge: Not being accustomed to the conventions by which, for example, addresses are recorded in Haiti meant they had difficulty distinguishing road names from district names, or road numbers from address numbers. This uncertainty is evident in the 9.9% of cases (357) where participants were in disagreement and questions the assertion that individuals are able to recognise city or street names easily, even when those names are unfamiliar (Gelernter and Mushegian, 2011). However, we argue that such uncertainty is typical in humanitarian response scenarios, especially when the response effort is crowdsourced.
7. Conclusions
This research is a first step towards evaluating the uncertainty associated with crowdsourced crisis information. Results suggest that locality descriptions in the Haiti dataset are predominantly features and that the distribution of locality descriptions across categories is similar to the MaNIS dataset. In turn, this suggests suitable georeferencing methods exist to allow accuracy to be evaluated.
Nevertheless, this conclusion is partial and hides the complexities present in crowdsourced crisis information. To address these complexities we plan to investigate whether alternative sources of information such as OpenStreetMap can be used to overcome limited local knowledge and explore differences within locality descriptions. We also plan to extend our research to a similar dataset related to the recent conflict in Libya (OCHA, 2011).
8. Acknowledgements
We thank Roger Beecham and Sarah Goodwin for classifying the Haiti dataset and those behind the Haiti Crisis Map for making their data publicly available. The bars in Figures 1 and 2 are elements A to E in ColorBrewer Set 1 (Harrower and Brewer, 2003). This qualitative scheme is well suited to categorical data. These five elements are effective on screen and in print.
9. References
Coyle, D. and Meier, P., 2009. New Technologies in Emergencies and Conflicts: The Role of Information and Social Networks, Washington DC and London: UN Foundation-Vodafone Foundation Partnership. Available at: http://www.unfoundation.org/press-center/publications/new-technologies-emergencies-conflicts.html [Accessed June 2, 2011].
Doherty, P., Guo, Q., Liu, Y., Wieczorek, J. and Doke, J., 2011. Georeferencing Incidents from Locality Descriptions and its Applications: a Case Study from Yosemite National Park Search and Rescue. Transactions in GIS, 15(6), pp.775-793.
Fisher, P., 1999. Models of uncertainty in spatial data. In P.A. Longley, M.F. Goodchild, D.J. Maguire, D.W. Rhind and P. Fisher, eds. Geographical Information Systems, Principles and Technical Issues. Chichester: John Wiley and Sons, pp. 191-205.
Gelernter, J. and Mushegian, N., 2011. Geo-parsing Messages from Microtext. Transactions in GIS, 15(6), pp.753-773.
Goodchild, M., 2009. NeoGeography and the nature of geographic expertise. Journal of Location Based Services, 3(2), pp.82-96.
Goodchild, M.F. and Hunter, G.J., 1997. A simple positional accuracy measure for linear features.
International Journal of Geographical Information Science, 11(3), pp.299-306.
Guo, Q., Liu, Y. and Wieczorek, J., 2008. Georeferencing locality descriptions and computing associated uncertainty using a probabilistic approach. International Journal of Geographical Information Science, 22(10), pp.1067-1090.
Haklay, M., 2010. How good is volunteered geographical information? A comparative study of OpenStreetMap and Ordnance Survey datasets. Environment and Planning B: Planning and Design, 37(4), pp.682-703.
Harrower, M. and Brewer, C., 2003. ColorBrewer.org: An Online Tool for Selecting Colour Schemes for Maps. The Cartographic Journal, 40(1), pp.27-37.
Howe, J., 2009. Crowdsourcing: How the Power of the Crowd is Driving the Future of Business, London: Random House Business Books.
MacEachren, A.M., Robinson, A., Hopper, S., Gardner, S., Murray, R., Gahegan, M. and Hetzler, E., 2005. Visualizing Geospatial Information Uncertainty: What We Know and What We Need to Know.
Cartography and Geographic Information Science, 32(3), pp.139-160.
MapAction, 2012. MapAction: About us. Available at: http://www.mapaction.org/about/about-us.html [Accessed February 8, 2012].
OCHA, 2011. Libya Crisis Map. Available at: http://libyacrisismap.net/ [Accessed October 18, 2011].
Tapia, A.H., Bajpai, K., Jansen, J., Yen, J. and Giles, L., 2011. Seeking the Trustworthy Tweet: Can Microblogged Data Fit the Information Needs of Disaster Response and Humanitarian Relief Organizations. In Proceedings of the 8th International Conference on Information Systems for Crisis Response and Management (ISCRAM). The 8th International Conference on Information Systems for Crisis Response and Management (ISCRAM). Lisbon, Portugal.
Ushahidi, 2009. Haiti Crisis Map. Available at: http://haiti.ushahidi.com/ [Accessed October 18, 2011].
Ushahidi, 2011a. How To Map SMS Messages. Available at:
Ushahidi, 2011b. Ushahidi Guide To Verification. Available at:
http://community.ushahidi.com/uploads/documents/c_Ushahidi-Verification-Guide.pdf [Accessed October 20, 2011].
Ushahidi, 2011c. Ushahidi: About us. Available at: http://www.ushahidi.com/about-us [Accessed October 19, 2011].
Veregin, H., 1999. Data quality parameters. In P.A. Longley, M.F. Goodchild, D.J. Maguire, D.W. Rhind and P. Fisher, eds. Geographical Information Systems, Principles and Technical Issues. Chichester, United Kingdom: John Wiley and Sons, pp. 177-189.
Vieweg, S., Hughes, A.L., Starbird, K. and Palen, L., 2010. Microblogging during two natural hazards events: what Twitter may contribute to situational awareness. In Proceedings of the 28th international conference on human factors in computing systems. The 28th international conference on human factors in computing systems. Atlanta, GA, pp. 1079–1088.
Wieczorek, J., Guo, Q. and Hijmans, R., 2004. The point-radius method for georeferencing locality descriptions and calculating associated uncertainty. International Journal of Geographical Information Science, 18(8), pp.745-767.
10.Biography
Iain Dillingham is a research student at the giCentre, City University London, applying visual and analytical approaches to user-generated content gathered in the wake of crisis or conflict events.
Dr Jason Dykes is Professor of Visualization at the giCentre, City University London, undertaking applied and theoretical research in, around and between information visualization, interactive analytical cartography and human-centred design.
Visual Analytical Approaches to Evaluating Uncertainty and Bias in Crowdsourced Crisis Information
Iain Dillingham∗ Jason Dykes† Jo Wood,Member, IEEE‡
giCentre, School of Informatics City University London
ABSTRACT
Concerns about verification mean the humanitarian community are reluctant to use information collected during crisis events, even though such information could potentially enhance the response ef-fort. Consequently, a program of research is presented that aims to evaluate the degree to which uncertainty and bias are found in public collections of incident reports gathered during crisis events. These datasets exemplify a class whose members have spatial and temporal attributes, are gathered from heterogeneous sources, and do not have readily available attribution information. An interactive software prototype, and existing software, are applied to a dataset related to the current armed conflict in Libya to identify ‘intrinsic’ characteristics against which uncertainty and bias can be evaluated. Requirements on the prototype are identified, which in time will be expanded into full research objectives.
1 INTRODUCTION
Crowdsourcing describes the process by which tasks are completed by a heterogeneous group in response to an open call [5]. Whilst examples of crowdsourcing are generally business-focused [4, 5], recently the process has been used outside the business commu-nity to gather reports about populations directly affected by crisis events, such as the 2010 earthquake in Haiti, or the current armed conflict in Libya. However, whilst it is argued that formal responses to crisis events should accommodate crowdsourced information [8], verifying information collected during a crisis event is problematic [1]. Indeed, verification is the principal obstacle to humanitarian or-ganisations using crowdsourced information to make decisions ‘in the field’ [10].
Verification, in this context, is associated with accuracy—“the inverse of error” [13, p.178]—and credibility [1]. Accuracy and credibility, alongside precision, completeness, consistency, lineage, currency, subjectivity, and interrelatedness, are components of un-certainty [7]. Many of these components have spatial, temporal, and thematic aspects [13]. Bias, by extension, can be defined as systematic error [13].
In our research, visual analytical approaches are used to evaluate the degree to which uncertainty and bias are found in public collec-tions of incident reports gathered during crisis events. We use visual analytical approaches because they have been effective in studies with similar datasets [14], or with similar aims [16]. Our datasets relate to the 2010 earthquake in Haiti, and the current armed con-flict in Libya, and were exported from the Haiti1and Libya2crisis
∗e-mail:[email protected] †e-mail:[email protected] ‡e-mail:[email protected]
1http://haiti.ushahidi.com/ 2http://libyacrisismap.net/
Figure 1: IncidentExplorer, Libya dataset
maps; both are instances of Ushahidi,3an open source software
platform that was built to gather information from ‘tweets,’ SMS messages, emails, and the web. Ushahidi allows anyone to report an incident, and incident reports are generally reviewed (‘approved’ and ‘verified’) by a restricted group before being made public. Con-sequently, two forms of crowdsourcing characterise Ushahidi: The first applies to reporting incidents and is consistent with the def-inition given above; the second applies to reviewing incident re-ports and is a form of moderation. However, it is important to note that not all of the information contained in each incident report is made public—the reporter’s Twitter account, telephone number, and email address are not disclosed, for example—and that our re-search encompasses only the publicly available information.
Although there are compelling reasons to use the Haiti and Libya datasets specifically, they exemplify a class whose members have spatial and temporal attributes, are gathered from heterogeneous sources, and do not have readily available attribution information (i.e. information about the report, reporter, or reviewer). Visual analytical approaches are well placed to “detect the expected and discover the unexpected” in such circumstances [11, p.10]. Fur-thermore, exploring the relationships between the components that characterise uncertainty in different domains is a recognised re-search challenge in geographic information science [7]. Indeed, addressing data quality issues such as uncertainty could also bene-fit the wider research community [6].
In the following sections we state our aim, and describe how we have addressed our first objective using existing and new software. We describe the nature of the Haiti and Libya datasets, and conclude with possible directions for future research.
2 EXPOSITION
The aim of our research is to evaluate the degree to which uncer-tainty and bias are found in public collections of incident reports gathered during crisis events. Whilst previous research used the
contribution frequency of users to evaluate bias in collections of user-generated content [9], the Haiti and Libya datasets lack attri-bution information. However, it should be possible to identify simi-lar ‘intrinsic’ characteristics against which uncertainty and bias can be evaluated. Our first objective is to identify these characteristics. Achieving our first objective necessitates ‘getting to know’ the data, a crucial component in effective data analysis [12]. Explor-ing the Libya dataset with existExplor-ing software told us that it con-tains 2283 incident reports, each with two spatial (a coordinate pair and a location string), one temporal, and five ‘thematic’ attributes that describe and categorise each incident. The location strings are ‘messy’ in that they contain toponyms (“Ajdabiya Central Hospi-tal”), coordinate pairs at different levels of precision, ‘vernacular geographies’ [3] (“Between Sharia as-Sayiti Street [and] Az Za-wiyah Street, Tripoli, Libya”), and in some cases additional ex-planatory information (“Cyrinacia – older regional term meaning eastern coastal region of Libya.”). Furthermore, 94% of reports in the Libya dataset are categorised as ‘Geo-Located’ (Ushahidi cate-gories are similar to social media ‘tags’ in that they are not mutually exclusive), suggesting they are spatially accurate.
We developed an interactive software prototype called IncidentExplorer (Figure 1) to explore the Libya dataset in linked spatial (upper-left), temporal (bottom-left), and thematic (right) views. Using this tool, we see that:
• Most incidents were reported on or near to the coast, with concentrations on the north-west border with Tunisia, and in the north-east coast (Ras Lanuf to Benghazi).
• The temporal distribution of incident reports has a positive skew, with a peak on 4th March 2011 (day 10 of 102).
• Just over 80% of incident reports were ‘verified.’ Although on most days the proportion of ‘verified’ reports exceeds ‘unver-ified’ reports, the reverse is true at the ‘ends’ of the dataset. (All incident reports were ‘approved.’)
We identified several requirements on IncidentExplorer when ex-ploring the Libya dataset. The first concerns the relationship be-tween the coordinate pair, which locates the incident report on the spatial view, and the location string. Although roughly 78% of latitude and 75% of longitude values have six decimal places of precision, this precision does not appear to be reflected in the lo-cation strings: There are 86 “Tripoli, Libya” lolo-cation strings (or similar), and 85 “Benghazi, Libya” location strings (or similar), for example. Given the desire to reach populations directly affected by crisis events, we would expect to see more location strings with greater precision (i.e. more location strings with finer spatial res-olution). To explore the precision of location strings further, we wish to (1) display the location strings of the incident reports se-lected in the spatial and temporal views; and (2) use the location strings to classify the precision of incident reports, and represent this in IncidentExplorer. Both would allow us to assess whether the spatial precision of incident reports varies in space and time; any systematic variation would suggest bias.
Similarly, we wish to determine whether the coordinate pairs are accurate. Two published methods warrant further investigation; the point-radius method [15] and the probability distribution method [2]. The former would result in an object, and the latter a field within which the incident report is likely to be located.
Further requirements on the software prototype include extend-ing the thematic view to include categorical and descriptive infor-mation about each incident report. The latter will require further analysis, as the Libya dataset contains 123 categories, some of which are synonymous (e.g. “Water and Sanitation” and “WAT-SAN”).
3 CONCLUSION
We present a program of research on uncertainty and bias in crowd-sourced crisis information. Having developed a software proto-type to address our first objective, we identify several requirements which in time will be expanded into full research objectives. Al-though these full objectives concern precision and accuracy, the po-tential exists to explore other components of uncertainty in future work.
ACKNOWLEDGEMENTS
We thank those individuals behind the Haiti and Libya crisis maps for making their data publicly available.
REFERENCES
[1] D. Coyle and P. Meier. New technologies in emergencies and con-flicts: The role of information and social networks. Technical report, UN Foundation–Vodafone Foundation Partnership, Washington DC and London, 2009.
[2] Q. Guo, Y. Liu, and J. Wieczorek. Georeferencing locality descrip-tions and computing associated uncertainty using a probabilistic ap-proach.International Journal of Geographical Information Science, 22(10):1067–1090, 2008.
[3] L. Hollenstein and R. Purves. Exploring place through user-generated content: Using Flickr tags to describe city cores.Journal of Spatial Information Science, (1):21–48, 2010.
[4] J. Howe. The rise of crowdsourcing.Wired, 14(6):176–183, 2006. [5] J. Howe.Crowdsourcing: How the Power of the Crowd is Driving the
Future of Business. Random House, London, 2009.
[6] D. A. Keim, F. Mansmann, J. Schneidewind, and H. Ziegler. Chal-lenges in visual data analysis. InInformation Visualization, pages 9–16, 2006. The 10th International Conference on Information Visu-alization, London, 5–7 July 2006.
[7] A. M. MacEachren, A. Robinson, S. Hopper, S. Gardner, R. Murray, M. Gahegan, and E. Hetzler. Visualizing geospatial information un-certainty: What we know and what we need to know.Cartography and Geographic Information Science, 32(3):139–160, 2005. [8] L. Palen and S. B. Liu. Citizen communications in crisis: Anticipating
a future of ICT-supported public participation. InProceedings of the SIGCHI Conference on Human Factors in Computing Systems, pages 727–736, 2007. San Jose, CA, 30 April–3 May 2007.
[9] R. S. Purves, A. J. Edwardes, and J. Wood. Describing place through user generated content: Comparing two georeferenced image collec-tions in the British Isles. In press.
[10] A. H. Tapia, K. Bajpai, J. Jansen, J. Yen, and L. Giles. Seeking the trustworthy tweet: Can microblogged data fit the information needs of disaster response and humanitarian relief organizations. In Proceed-ings of the 8th International Conference on Information Systems for Crisis Response and Management (ISCRAM), 2011. Lisbon, Portugal, 8–11 May 2011.
[11] J. J. Thomas and K. A. Cook. A visual analytics agenda.IEEE Com-puter Graphics and Applications, 26(1):10–13, 2006.
[12] A. Unwin, M. Theus, and W. Härdle. Exploratory graphics of a finan-cial dataset. In C. Chen, W. Härdle, and A. Unwin, editors,Handbook of Data Visualization, Springer Handbooks of Computational Statis-tics, pages 831–852. Springer, 2008.
[13] H. Veregin. Data quality parameters. In P. A. Longley, M. F. Good-child, D. J. Maguire, and D. W. Rhind, editors,Geographical Informa-tion Systems, Principles and Technical Issues, volume 1, pages 177– 189. John Wiley and Sons, Chichester, 2nd edition, 1999. [14] J. White and R. Roth. TwitterHitter: Geovisual analytics for
harvest-ing insight from volunteered geographic information. InGIScience 2010, 2010. Zurich, Switzerland, 14–17 September 2010. [15] J. Wieczorek, Q. Guo, and R. Hijmans. The point-radius method for
georeferencing locality descriptions and calculating associated uncer-tainty. International Journal of Geographical Information Science, 18(8):745–767, 2004.
Exploring Road Incident Data with Heat Maps
Iain Dillingham,1Bryn Mills2and Jason Dykes3
1,3the giCentre, School of Informatics, City University London, EC1V 0HB 2Trafficlink, 91 Charterhouse Street, London, EC1M 6HR
1Tel. +44 (0)20 7040 295, Fax +44 (0)20 7040 8584
Email:1[email protected],2[email protected],3[email protected]
ABSTRACT:This research seeks to determine whether heat mapping is an effective technique for the visual exploration of road incident data. Four software prototypes, which adopted map, treemap and spatial treemap layouts, were developed using open source software. Whilst the visualization process described by Fry (2007) informed the development effort, the evaluation methodology was based on the Nested Process Model (Munzner, 2009). The results of two evaluation methods – a design study and the presentation and discussion of results with domain experts – confirm heat mapping’s validity and provide requirements for further software development.
KEYWORDS:heat map, visualization, evaluation, open source software
1. Introduction
Every day, thousands of journeys are made on Britain’s road network. To avoid congestion, many drivers seek traffic updates on the web, radio and television. Ultimately, these updates are produced
by companies such as Trafficlink,1who analyse road incident data. Unwin et al. (2008) assert that the
first stage of analysis involves getting to know the data, a process where graphical representations play an important role in assessing data quality, cleaning data and highlighting structure and outliers, for example. This research seeks to determine whether one such graphical representation, the heat map, is an effective technique for the visual exploration of road incident data.
Previous work undertaken within Trafficlink suggested that heat mapping could be used to represent and
predict congestion. However, the termheat mapis loosely defined and may refer to the representation of
geographic or non-geographic data. In cartography, for example, a heat map is an unclassed isarithmic map used to represent smooth, continuous phenomena (Slocum et al., 2009); in statistics, a cluster heat map is a permutable grid of cells, where each cell is coloured by value (Wilkinson and Friendly, 2009). Ultimately, both approaches informed the software development effort.
Four software prototypes were developed to explore the road incident data, reflecting the requirements of the target domain. The prototypes explored the number and severity of road incidents at multiple spatial and temporal resolutions; compared observed to expected number of road incidents; and represented the number of road incidents and length of road network across three road categories (‘A’, ‘B’ and motorways). Three prototypes adopted a map layout, whilst one adopted treemap (Shneiderman, 1992) and spatial treemap (Slingsby et al., 2008) layouts.
The importance of evaluation when developing techniques to visualize geographic information is noted elsewhere (Slocum et al., 2001). Consequently, to determine whether heat mapping is an effective tech-nique, an evaluation methodology based on the Nested Process Model (Munzner, 2009) was used. This
model consists of four nested levels, where threats to a visualization’s validity, alongside appropriate evaluation methods, are identified at each level (Munzner, 2009).
The structure of this paper is as follows: section two describes the software development effort, situat-ing it within the visualization process described by Fry (2007). Section three describes the evaluation methodology, maps the visualization process described by Fry (2007) to the Nested Process Model (Munzner, 2009) and reports the results of immediate and downstream validation. Section four con-cludes and offers directions for future research.
2. The visualization process
[image:41.612.87.530.51.717.2]Visualization can be viewed as a seven stage process, where the initial four stages – acquiring the data, parsing (structuring and ordering the data), filtering (obtaining only the data of interest) and mining (dis-cerning patterns in the data or setting the mathematical context) (Fry, 2007) – involve data processing, or the mapping of concrete data to abstract data-types (Munzner, 2009). This visualization process has been successfully used to explore library loans data, for example (Radburn et al., 2010) and structures the following discussion.
Figure 1:Severity of road incidents, map layout
The road incident data archive was supplied as
a single 4.7G tab-separated-values file. The
archive contained 14.5 million records, describ-ing 2.5 million road incidents which occurred in Britain between September 2002 and September
2009. Each road incident was described over
multiple contiguous lines, leading to consider-able data redundancy.
The road incident data archive was parsed and
loaded into MySQL2 using standard Unix and
MySQL command-line tools. Although large
in size, performing these operations took under 15 minutes. Using MySQL permitted more ef-fective filtering of the road incident data, espe-cially when the command-line interface was used
within MySQL Workbench,3a graphical tool for
interacting with MySQL databases. With appro-priate indices, a simple query returning rows relating to a road incident executed in under a second, whilst a more complex query involving a temporal filter executed in under 13 seconds. Although rela-tively slow, querying the database was quicker than extracting rows directly from the archive.
Querying the database also permitted more effective mining and led to the discovery of several anoma-lies concerning road incident start and end times. These anomaanoma-lies illustrated how the problem of characterising a road incident was non-trivial: not only could a road incident change over time but because of errors in the archival process, temporal change was not recorded accurately.
To conclude the data mining stage, a subset of road incidents occurring in February and August 2008
were exported from the database. The OGR Simple Feature Library4was then used to perform a
co-ordinate transform operation on the geographic location of each road incident to ensure consistency with the boundary data used in the data representation stage. This library, released by the Open Source Geospatial Foundation, uses an abstract data model to access geographic data stored in standard and
2http://www.mysql.com/
3http://wb.mysql.com/