Efficient Process Optimization
R. I. Whitfield,1,* A. H. B. Duffy,1G. Coates2and W. Hills2
1CAD Centre, James Weir Building, University of Strathclyde, Glasgow, G1 1XJ, United Kingdom
2Engineering Design Centre, Armstrong Building, University of Newcastle, Newcastle upon Tyne, NE1 7RU, United Kingdom
Abstract:A computer-based system for modelling and optimizing processes is presented. The Design Structure Matrix (DSM) process representation was used to model the processes due to its compact,generic and easily quantifiable nature. The system is capable of calculating a number of process performance metrics that are focussed towards determining the degree of iteration and concurrency within the process,however,the system is easily extendible to include other process performance measurements. The paper describes the use of a Genetic Algorithm (GA) to optimise the sequence of activities with the focus of reducing the amount of iteration by reducing the number of feedback loops and hence reducing the number of initial guesses that are needed in order to undertake highly dependent tasks. Previous investigations have attempted to define a generic structure for combinatorial optimisation using GAs [Todd,D. (1997). Multiple Criteria Genetic Algorithms in Engineering Design and Operation,Ph.D. Thesis,Engineering Design Centre,University of Newcastle upon Tyne,UK.],however this paper demonstrates that the structure of the GA is intrinsically tied to the domain. The focus of this paper was an investigation to determine the most efficient and timely structure for the GA with respect to process optimisation. Additional criteria are included within the system and it is has been demonstrated that the structure is applicable for these criteria. It is therefore assumed that if the criteria are dependent upon the matrix representation,in particular,the sequence of the activities and dependencies,then the GA structure will remain applicable. This assumption was demonstrated to be correct when the DSM and GA were used with the same GA structure to optimise component modularity using different optimisation criteria [Whitfield R.I.,Smith J.S. and Duffy A.H.B. (2002). Identifying Component Modules,Seventh International Conference on Artificial Intelligence in Design AID’02,Cambridge,UK,15–17 July 2002.]. The results indicated that the independent position based crossover and shift mutation operators with 60 and 20% probabilities respectively was the most successful structure for the GA. A relationship between the number of activities and the number of evaluations was determined and may be used to eliminate unnecessary computation in future investigations.
Key Words:design structure matrix,genetic algorithm,process optimisation.
1. Introduction
Design of made-to-order products invariably involves a large number of resources performing a large number of activities in order to achieve a particular goal in a timely and appropriate manner with the overall objective of being faster and better than competitors. The associated processes throughout each of the product life-phases are often well established, since the product is frequently a variant of a previous design, and have evolved as the business has developed and adapted to address new technologies. In some instances the processes may be documented where they are considered to be important, in others they may be ad hoc, in both cases however, they are rarely optimized or streamlined in any formal way. Indeed Prasad [23] suggests that: ‘‘process improvement is often perceived as an after-thought – a functional service to be called upon periodically for productivity improvement’’. In addition, ‘‘Process restructuring is
often targeted toward piece-wise or one-at-a-time improvements due to incremental or add-on approach of continuous improvement in manufacturing process, product quality, etc.’’ Optimisation on the basis of time alone may realize significant improvements with respect to the original process [3], however, consideration of the process as a multi-dimensional space using as diverse a range of criteria as possible, increases the usefulness of process-modelling techniques beyond that of operational management allowing all levels of industrial activity to be optimized.
Various different process-modelling techniques are available such as: the Structured Analysis and Design Technique (SADT) [24], Programme Evaluation and Review Technique/Critical Path Method (PERT/CPM) for determining critical paths [34], and, the Design Structure Matrix (DSM) [27]. However, in each case, the structure of the process is represented as a series of activities and dependencies. Each modelling technique has certain applicability and benefits and restrictions for use [17,21] that need to be addressed when deciding upon the objectives of the investigation. The methods are *Author to whom correspondence should be addressed.
E-mail: [email protected]
generic in nature and allow investigation at multiple levels of abstraction and are equally applicable within the design, production, maintenance and other life-phases.
A number of algorithms exist which may be applied to process optimisation including simulated annealing [14], genetic algorithms (GA) [13] and Tabu search [6]. The optimisation problem is extremely difficult however since the objective is to achieve the optimum sequence of a number of activities, often on the basis of conflicting criteria, whilst being constrained by the resource allocation. The optimisation algorithms tend to have a ‘‘structure’’, for example, the annealing schedule for simulated annealing, which governs the effectiveness of the algorithm at solving a particular type of problem.
This paper demonstrates the application of a GA to process optimisation where the objective was to determine the optimum sequence of activities within a number of different process models. The Design Structure Matrix (DSM) was used as the process modelling technique due to its generic applicability, ease of representation within a computer-based system, and its quantifiable nature. The DSM modelling technique and system are described within Section 2. A multi-criteria genetic algorithm was developed and adapted for application to this particular type of problem and is described within Section 3. A number of different process models were used to test the performance of both the process modelling representa-tion and of the optimisation algorithms. These models, and the results of the optimisation for a single criterion solution are described within Section 4. Having identified the most efficient structure for the GA, a multi-criteria optimisation problem is undertaken to demonstrate the trade-off between criteria in Section 5. Finally, conclusions are made within Section 6.
2. Design Structure Matrix
The Design Structure Matrix (DSM), also known as the Dependency Structure Matrix, has been extensively used to represent activities and their dependencies. The DSM like most other process modelling techniques, is generic in nature, but due to its compactness, easily quantifiable nature, and ability to represent most design activity relationships, has seen considerable use in the analysis and management of the product development process [3,5,15,27].
The DSM consists of a sequence of activities that are represented in the same order in both the row and column of the matrix. The central part of the matrix represents the dependencies between the activities. Steward [27] originally represented the dependencies in a binary form: 0 to indicate no dependency, and, 1 to indicate a dependency, however, the modelling techni-que has evolved to consider the weight of the
dependencies, as well as consideration of the dependen-cies as representing concepts other than the flow of information [5].
A DSM modelling and analysis system was con-structed with the focus of providing mechanisms to enable the optimisation of processes with respect to any number of pre-determined performance metrics – Figure 1.
The system allows the creation of processes contain-ing any number of activities with the matrix changcontain-ing size automatically as activities are added or removed. The dependencies between activities may be defined for any number of single perspectives (mechanical, electrical etc.) as well as for combinations of perspectives to view the trade-offs between the perspectives. Clicking a dependency within the matrix will change the state of the dependency from either dependent or independent. The user may also change the weight (or importance) of the dependency to represent activities that may in some situations be started prior to the preceding activities to facilitate concurrency. The weight of the dependency is represented by its colour.
The system is intended to be an aid to the designer or manager to improve their understanding of the relation-ships within the process and enable ‘‘what-if’’ scenarios to be investigated with respect to reordering the activities both manually and automatically using optimisation. The system provides a representation of a process that requires knowledge and experience of that representation to interpret the results. For example, the extent of the amount of feedback iteration is quite apparent, however it is difficult, without experience, to determine the activities that may be undertaken concurrently. Work is currently underway to extend the system to provide the user with feedback that is more directly related to process characteristics rather than matrix characteristics such as the determination of design-cycles and design concurrency. The system provides the fundamental mechanism in order to include process knowledge-based techniques in order to further aid the designer in the identification of improved processes.
The sequence of activities may be managed manually by dragging either of the rows or columns into a new position whilst simultaneously re-calculating the process performance metrics, assisting the user in the determina-tion of an improved sequence. Alternatively, the process may be optimised using one of the optimisation algorithms available within the optimisation module. The system can simultaneously manage the optimisation of multiple processes although this will obviously take longer on a computer with a single processor.
3. Efficient Combinatorial Optimisation
domains that the ‘best’ structure of optimisation algorithms may be dependent upon the application [30,32]. The structure for an optimisation algorithm is defined here as both the types of operators and the parameter settings used during operation. The differ-ences observed may be linked to the nature of the problem, the type of fitness function, of the depth or breadth of the problem under investigation.
Todd [32] applied a GA to the Travelling Salesman Problem (TSP) in an attempt to determine an effective combinatorial structure which was not domain specific, and which may hence be applied to other similar problems. The TSPis similar in nature to the DSM problem where the objective is to determine an opti-mum sequence in order to either minimize or maximize some criteria. In the case of the TSP, the objective is to find the shortest route through a number of cities, whilst visiting each city only once. The difficulty in both of these problems lies in the number of combinations of possible sequences. Within the DSM problem, for example, a process containing 30 activities has 6.6521032 possible combinations.
An exhaustive search for this type of problem is clearly inappropriate.
The TSPis perhaps more difficult to solve since the relative position of each city within the sequence is critical in determining an optimum sequence, whereas the difficulty with optimizing the DSM problem appears to be focussed towards selecting particular groups of activities and the relative position does not appear to be so critical. Todd believed that it would be possible to determine a structure for a genetic algorithm that would be generally efficient throughout all combinatorial problems, however this research indicates that the structure of the optimisation algorithm is intrinsically linked to the problem domain. Consequently, within the application to the DSM problem, it is essential that the most effective optimisation structure is utilized in order to efficiently achieve an optimum sequence of activities.
3.1 Genetic Algorithms
[image:3.612.91.505.56.435.2]Within this research, the general procedure for GAs developed by Goldberg [10] has been used to enable
the evolution of optimal sequences of activities. The objective of the GA in this particular application is to minimize a number of criteria that represent various aspects of the performance of the process.
The GA developed within this system is generic in nature using object-oriented design techniques and allows the encoding of a sequence of any type of information. Within this application, the chromosome is encoded as a random sequence of activities, however this may be changed without modifying any aspect of the GA to represent a sequence of cities within the TSPfor example. Randomizing the sequence of activities within the chromosome attempts to ensure that the chromosome represents a unique point in the solution space, such that a group of chromosomes are randomly distributed throughout. In the case of the DSM problem, the group of chromosomes, or initial population, generally represent sequences of activities that have poor process performance criteria.
The chromosomes are then evaluated within the DSM with respect to the process performance criteria that has been selected.
A Roulette-wheel type selection procedure is used where each chromosome is given a portion of the wheel that is proportional to its performance [10]. The wheel is spun and the winning chromosome is passed through to the next stage. Chromosomes with higher performance characteristics therefore have a greater chance of surviving, although it is possible for lower performance chromosomes to be passed through.
Crossover and mutation operations are then per-formed upon the selected chromosomes to produce the next generation. Two parent chromosomes are selected at random and removed from the population. The two parents are then crossed based upon a probability of crossover to produce two children containing genetic information from both parents. Mutation works in a similar manner on a single chromosome to produce a small change in the parent. The crossover and mutation operations encoded within this GA are listed within Tables 1 and 2.
The new population is then re-evaluated with respect to the process performance criteria. A check is made to determine whether the GA has completed a certain number of generations, finishing if it has, otherwise repeating this evaluation, selection, crossover and mutation processes.
Criteria may be selected for the basis of optimisation using the Criteria Set-up area. The optimisation may be either single criteria or multi-criteria where the indivi-dual objectives are: minimization, maximization, target value, or any combination.
After completion of the optimisation, a list of optimal sequences is displayed within the solution table. The table displays the sequence, the values for the criteria selected, the fitness and the rank for each of the
solutions. For single criteria problems, the genetic algorithm will produce solutions that have a near-optimal value for the selected criterion, whereas for multi-criteria problems, the genetic algorithm will produce a number of solutions that represent the trade-off between the criteria. Clicking on one of the optimum solutions within the solution table will change and display the sequence of activities within the DSM.
A number of criteria have been included for evaluation within the DSM model that represent partitioning (iteration) and concurrency performance measurements for the process – Equations (1)–(5). The DSM model may however have any number of performance criteria included to increase the diversity of the optimisation. Work is currently ongoing to determine additional metrics and their applicability to process performance [12].
Kusiak triangularisation [15,16] – Equation (1) represents the summation of the dependencies above the leading-diagonal on the basis of their weight. No consideration is given for the dependency’s distance from the diagonal and consequently has no effect upon the size of iterative blocks. Minimisation of this criterion will reduce the number of iterative blocks.
[image:4.612.292.532.71.249.2]Gebala partitioning [7] – Equation (2) represents the summation of the dependencies above the diagonal multiplied by their distance from the leading-diagonal on the basis of their weight. The focus of Gebala partitioning is therefore to get as many dependencies either: below the leading diagonal, or, as
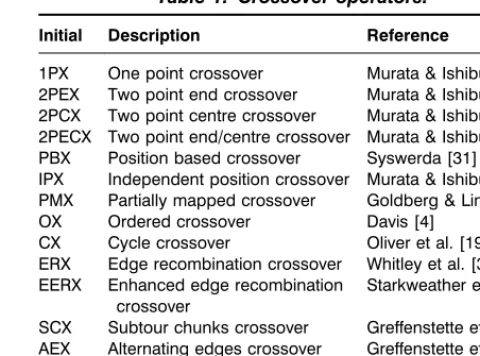
Table 1. Crossover operators.
Initial Description Reference
1PX One point crossover Murata & Ishibuchi [18] 2PEX Two point end crossover Murata & Ishibuchi [18] 2PCX Two point centre crossover Murata & Ishibuchi [18] 2PECX Two point end/centre crossover Murata & Ishibuchi [18] PBX Position based crossover Syswerda [31] IPX Independent position crossover Murata & Ishibuchi [18] PMX Partially mapped crossover Goldberg & Lingle [8] OX Ordered crossover Davis [4]
CX Cycle crossover Oliver et al. [19] ERX Edge recombination crossover Whitley et al. [37] EERX Enhanced edge recombination
crossover
Starkweather et al. [26]
SCX Subtour chunks crossover Greffenstette et al. [11] AEX Alternating edges crossover Greffenstette et al. [11] IX Inversion crossover Goldberg [9]
Table 2. Mutation Operations.
Initial Description Reference
close to the leading diagonal as possible. Minimization of this criterion will reduce the size and number of the iterative blocks.
Scott partitioning [25] – Equation (3) is similar to Gebala partitioning except that each dependency is weighted with respect to its distance from the bottom left-hand corner. The weighting is also greater for dependencies above the leading-diagonal. Minimization of this criterion will primarily reduce the size and number of iterative blocks, as well as attempt to move to the dependencies into the bottom left-hand corner.
Kusiak Triangularisation¼Xn
i¼1
Xn
j¼iþ1 wi,j
ð1Þ
Gebala Partitioning¼Xn
i¼1
Xn
j¼iþ1 ðjiÞ wi,j
ð2Þ
Scott Partitioning¼Xn
i¼1
Xn
j¼1 i,jwi,j
ð3Þ
Todd Concurrency 1ð Þ ¼Xn
i¼1
Xn
j¼1 jwi,j
ð4Þ
Todd Concurrency 2ð Þ ¼Xn
i¼1
Xn
j¼1 ðniÞ wi,j
ð5Þ
where,n is the number of activities in the DSM,iandj are the row and column indices,wi,jare the dependency
weights, and,
i,j ¼ 1½jþðn1Þ2
forj<i
i,j¼ 100½jþðn1Þ2
fori<j
Minimization of the Todd concurrency criteria [32] – Equations (4) and (5) will result with dependencies on the left and bottom respectively. This has an impact upon the level of parallelization that is possible.
The criteria are automatically updated when new activities are added to the matrix, or when activity dependencies are changed, and are displayed within the criteria dialog.
4. Results
A number of investigations were undertaken to determine the most efficient structure for the gene-tic algorithm with respect to optimizing the DSM. The structure for the GA is defined here as the settings
for: the crossover operator; the mutation operator; the crossover probability; the mutation probability; the population size, and, the number of generations. A number of assumptions were made to limit the size of the problem:
. Interactions may exist between the crossover and mutation operators. If this assumption is correct, variation within the efficiency of the mutation operators with respect to the crossover operators, and vice versa should be observed.
. The interactions between the crossover and mutation operators, and the crossover and mutation probabil-ities are weak, and hence may be neglected. Neglecting interactions between the crossover and mutation operators and their probabilities assumes that varying the probabilities of the operators has the same effect on each operator combination.
. No interactions exist between the operators, their probabilities, and the population size and number of generations. It was assumed that the operators and probabilities are specific to the particular application, whilst the population size and number of generations are linked to the size of the optimisation problem (number of activities within the process).
These three assumptions enabled the investigation to be undertaken in three stages. Firstly, given a suitable matrix, determine the most efficient combination of crossover and mutation operators. Secondly, using these operators, determine the most efficient crossover and mutation probabilities. Finally, using a range of different sized matrices and the operators and pro-babilities, determine the relationship between the problem size and the population size and number of generations.
4.1 Crossover and Mutation Operators
Table 3 indicates the mean results for each crossover and mutation operator. The range of results was used to determine three regions: effective combination (white); reasonable combination (grey), and, ineffective combi-nation (black). What is immediately obvious is that the assumptions made by Todd: that generic combinatorial operators may be determined using the TSPand applied to the DSM are incorrect. More importantly, the operators selected by Todd (EERX and 2ORS) are amongst the worst for this particular application. The results indicated that the IPX operator outperformed the other crossover operators, with the best combination
being for the IPX crossover and SOM mutation operators.
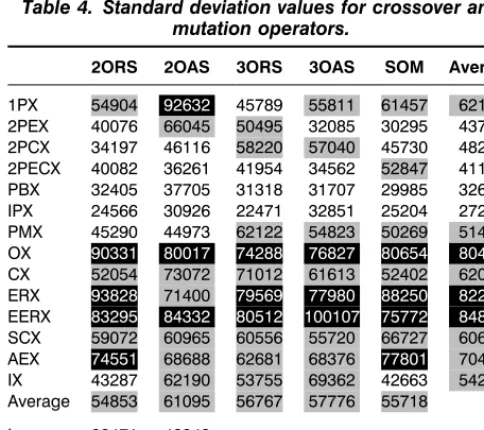
It is also important, although rarely undertaken, to consider the variation from the mean to ensure consistency within future investigations. Table 4 repre-sents the standard deviation of the Scott partitioning criterion using the same representation as Table 3.
It would have been possible to present both Tables 3 and 4 within a single table using a Signal-to-Noise (SN) ratio, however it was considered that a separate investigation would prove more enlightening. Table 4 suggests that the standard deviation has a similar degree of variability across the combinations of operators as that for the mean. It can be seen from Table 4 that the IPX crossover operator again gives the best performance with respect to the standard deviation, however the IPX–3ORS combination has the lowest value for the standard deviation. Priority was however given towards the combination selected from the mean analysis, which also had a relatively small standard deviation, hence the independent position based crossover and shift mutation operators were selected as being the most effective.
Tables 3 and 4 indicate that the interaction between the crossover and mutation operators is relatively weak.
4.2 Crossover and Mutation Probability
Given the PBX-SOM operator combination, the probabilities of crossover and mutation were varied to determine the most efficient values. The investigation was conducted in a similar manner as that used to determine the operators. The crossover and mutation probabilities were varied between 0 and 100% in 20% intervals. The results for 0% crossover – 0% mutation, and 20% crossover – 0% mutation were found to perform extremely poorly and were omitted from the table. Previous investigations of the mutation probability have provided conflicting results [22,32].
The results indicated that having either no crossover or mutation, or having high values for the mutation probability are to be avoided when using a genetic algorithm to optimize the DSM. It also indicates that higher values for the mutation operator than those previously suggested for the probabilities yield further improvements than those obtained from the operator investigation. The investigation demonstrated that 60% crossover and 20% mutation probabilities result with both a low mean and standard deviation, although lower combinations do exist for the standard deviation.
[image:6.612.28.269.79.295.2]Using these probability values, the mean has been reduced further compared to previously recommended values [22,32], whereas the standard deviation has reduced considerably.
Table 3. Mean values for crossover and mutation operators.
2ORS 2OAS 3ORS 3OAS SOM Average
1PX 424595 498427 426575 433840 405402 437768 2PEX 374397 422115 407489 399138 362398 393107 2PCX 365555 373827 389266 383751 359898 374460 2PECX 356132 369063 370028 353402 354381 360601 PBX 357865 363566 351037 355036 354525 356406 IPX 344410 339825 346305 346199 331332 341614 PMX 442376 451874 457672 394614 377442 424795 OX 580836 591569 595205 604902 601308 594764
CX 475593 498764 511608 470901 428258 477025 ERX 584045 592868 578235 604014 558114 583455
EERX 564150 622321 556985 584913 534098 572493
SCX 457707 438500 480287 418604 480056 455031 AEX 502735 529132 533262 517548 522284 520992 IX 435613 483759 432953 462721 409439 444897 Average 447572 469686 459779 452113 434210
[image:6.612.28.270.345.560.2]Low 331332 428328 Medium 428328 525325 High 525325 622321
Table 4. Standard deviation values for crossover and mutation operators.
2ORS 2OAS 3ORS 3OAS SOM Average
1PX 54904 92632 45789 55811 61457 62119 2PEX 40076 66045 50495 32085 30295 43799 2PCX 34197 46116 58220 57040 45730 48261 2PECX 40082 36261 41954 34562 52847 41141 PBX 32405 37705 31318 31707 29985 32624 IPX 24566 30926 22471 32851 25204 27204 PMX 45290 44973 62122 54823 50269 51495 OX 90331 80017 74288 76827 80654 80424
CX 52054 73072 71012 61613 52402 62030 ERX 93828 71400 79569 77980 88250 82205
EERX 83295 84332 80512 100107 75772 84804
SCX 59072 60965 60556 55720 66727 60608 AEX 74551 68688 62681 68376 77801 70419 IX 43287 62190 53755 69362 42663 54251 Average 54853 61095 56767 57776 55718
Additional tests have been undertaken using different operator combinations producing similar results for the IPX-SOM combination [35]. These tests indicate that there is little interaction between the selection of the operators and the selection of the probabilities.
4.3 Population Size and Number of Generations
A number of different matrices were used to determine the relationship between the number of activities within the DSM and the population size and number of generations required to produce a near-optimal solution without unnecessary computa-tion. These matrices and the results from the investiga-tion are presented within Table 5. The IPX-SOM operator combination was used throughout the investi-gation, and the crossover and mutation probabilities were held constant at 60 and 20% respectively. Each matrix was tested at a number of different population/ generation sizes with both the population size and number of generations given the same value. This investigation was conducted in a similar manner as the previous two investigations by repeating the analysis 30 times to determine the mean and standard deviation.
The results from the investigation for the 34 activity Steward matrix indicated that the mean value for the Scott partitioning criterion asymptotically approached a near-optimum value of approximately 3,420,000. The GA performed well for a population size and generation count of 120, with the standard deviation for the Scott partitioning criterion asymptotically approaching a value of approximately 70,000. If a value of 120 was selected for both the population size and number of generations, the GA will have performed a search of approximately 4.881035
% of the possible number of activity sequences.
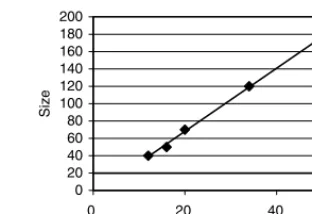
This process was repeated for the other matrices and the required population size and number of generations determined. This information can be seen within Figure 2 representing the relationship between the number of activities within the process and the population size and number of generations required to produce a near-optimal solution without unnecessary computation. The relationship can be seen to follow a linear trend, indicating that approximate values for the population
size and number of generations may be determined using Equation (6).
Size¼3:63n4:67 ð6Þ
where size represents both the value for the population size and the number of generations.
5. Multi-criteria Optimisation Results
The test case used to demonstrate multi-criteria optimisation is taken from Steward [28] and consists of 16 activities. Two criteria were selected from the optimisation dialog: Scott Partitioning – Equation (3), and, Todd concurrency (2) – Equation (5). The two criteria represent an interesting trade-off since minimis-ing the Scott Partitionminimis-ing criteria will attempt to move the dependencies below the leading diagonal, whereas minimizing the Todd concurrency criteria will attempt to move the dependencies towards the bottom of the matrix. In theory, it should be possible to minimize both criteria simultaneously and produce one solution which has all of the dependencies towards the bottom of the lower triangle, however in practice, processes are not that well-behaved, and it was apparent that a weak trade-off existed between the two criteria.
The optimisation was undertaken using the struc-ture determined within Section 4, producing 15 Pareto-optimal sequences. The original sequence quoted in [28] is given as a reference point (Sequence 1) and all other sequences are compared against it to deter-mine the percentage reduction in the two criteria selected. Sequence 8 represented the greatest reduction in the Scott partitioning criteria (61.9%), whilst Sequence 13 represented the greatest reduction in the Todd concurrency criteria (36.6%). It is interesting to note from the solutions that certain sub-sequences are prevalent (6,1,13,8,10) and (15,4,14,16) with various combinations, suggesting that these sub-sequences are significant with respect to reducing these criteria, and attempts should be made to maintain the sub-sequences if the sequence needs to be changed.
0 20 40 60 80 100 120 140 160 180 200
0 20 40 60
Activities
[image:7.612.351.507.58.165.2]Size
Figure 2. Relationship between number of activities and population size and number of generations.
Table 5. Matrices used for investigation.
Matrix N Activities Size % Search
Gebala [7] 12 40 3.34106
Steward [28] 16 50 1.191010
Steward [28] 20 70 2.011015
Steward [29] 34 120 4.881035
[image:7.612.45.285.74.149.2]6. Conclusions
The paper demonstrates the application of a GA to the optimisation of the sequence of activities using the DSM process modelling technique. A system was developed using the Java programming language to enable processes to be created, managed and optimized using the DSM technique. The focus of this paper was the determination of the most efficient structure for the GA, such that near-optimal activity sequences may be obtained consis-tently and without unnecessary computation. The structure is defined here as the crossover and mutation operators, the crossover and mutation probabilities, and, the population size and number of generations. Previous work has demonstrated that the structure of the GA is implicitly linked to the particular application [35], hence knowledge and understand-ing of the GA structure with respect to process optimisation is essential in ensuring that inefficient structures are not used to optimize these difficult types of problems.
The results indicate that the independent position crossover operator [31] and the shift mutation operator [18] was the most successful combination of operators. The most efficient crossover and mutation probabilities were found to be approximately 60 and 20% respectively. A relationship was determined to enable the estimation of the population size and number of generations based upon the number of activities within the process. This relationship is useful in determining the size of the search space required to ensure a near-optimal solution for problems larger than those considered within this investigation.
The objective of the investigation was to reorder the activities in order to minimize the optimisation criteria without either removing or de-coupling activities to produce a near optimum result with the information provided. Further improvements may however be achieved using techniques such as tearing [27] where dependencies that are estimated are removed from the matrix such that when the activities are reordered, the number of dependencies above the diagonal are mini-mized. Such techniques however required a knowledge and understanding of the process that is not represented within the DSM.
Acknowledgements
The authors gratefully acknowledge the support given by the Engineering and Physical Science Research Council who provided the grant RES/4741/0929 that enabled this work to be undertaken.
References
1. Austin, S.A., Baldwin, A.N., Hassan, T. and Newton, A.J. (1989). Techniques for the Management of Information Flow in Building Design, Information Technology in Civil and Structural Engineering Design ITCSED96, pp. 119–124, Glasgow, UK.
3. Coates, G., Duffy, A.H.B., Hills, W. and Whitfield, R.I. (2000). A Generic Coordination Approach Applied to a Manufacturing Environment, Journal of Materials Processing Technology,107: 404–411.
4. Davis, L. (1985). Job Shop Scheduling and Genetic Algori-thms, In:Proceedings of the First International Conference on Genetic Algorithms and their Applications, pp. 136–140, Lawrence Erlbaum Associates, Hillsdale, NJ, USA. 5. Eppinger, S.D., Whitney, D.E., Smith, R.P. and Gebala,
D.A. (1994). A Model-Based Method for Organizing Tasks in Product Development, Research in Engineering Design,6: 1–13.
6. Glover, F. and Laguna, M. (1993). Tabu Search, In: Reeves, C.R. (ed.), Modern Heuristic Techniques for Combinatorial Problems, pp. 70–150, Blackwell Scientific Publications, Oxford, UK.
7. Gebala, D.A. and Eppinger, S.D. (1991). Methods for Analysing Design Procedures,ASME Transactions, Design Theory and Methodology,31: 227–233.
8. Goldberg, D.E. and Lingle, R. (1985). Alleles, Loci and the Travelling Salesman Problem, In:Proceedings of the First International Conference on Genetic Algorithms and Their Applications, pp. 154–159, Lawrence Erlbaum Associates, Hillsdale, NJ, USA.
9. Goldberg, D.E. (1989). Sizing Populations for Serial and Parallel Genetic Algorithms, In:Proceedings of the Third International Conference on Genetic Algorithms, pp. 70–79, Morgan Kaufmann Publishers, CA, USA.
10. Goldberg, D.E. (1989). Genetic Algorithms in Search, Optimisation and Machine Learning, Addison-Wesley, Massachusetts, USA.
11. Greffenstette, J.J., Gopal, R., Rosmaita, B. and VanGucht, D. (1985). Genetic Algorithms for the Travelling Salesman Problem, In:Proceedings of the First International Conference on Genetic Algorithms and Their Applications, pp. 160–168, Lawrence Erlbaum Associates, Hillsdale, NJ, USA.
12. Haffey, M.K.D. and Duffy, A.H.B. (2001). Process Performance Measurement Support: A Critical Analysis,
International Conference on Engineering Design, ICED01 Glasgow, UK.
13. Holland, J.H. (1962). Outline for a Logical Theory of Adaptive Systems, Joint Association of Computing Machinery,9: 297–314.
14. Kirkpatrick, S., Gelatt, C.D. and Vecchi, M.P. (1983). Optimisation by Simulated Annealing,Science,220(4598): 671–680.
15. Kusiak, A. and Park, K. (1990). Concurrent Engineering: Decomposition and Scheduling of Design Activities,
International Journal of Production Research, 28(10): 1883–1900.
17. Malmstro¨m, J., Pikosz, P. and Malmqvist, J. (1998). The Complementary Roles of IDEF0 and DSM for the Modelling on Information Management Processes, In: Proceedings of the Fifth ISPE International Conference on Concurrent Engineering: Research and Applications, pp. 261–270, Tokyo, Japan.
18. Murata, T. and Ishibuchi, H. (1994). Performance Evaluation of Genetic Algorithms for Flow Shop Scheduling Problems, In: Proceedings of the First IEEE Conference on Evolutionary Computation,2: 812–817. 19. Oliver, I.M., Smith, C.J. and Holland, J.R.C. (1987). A
Study of Permutation Crossovers on the Travelling Salesman Problem, In: Proceedings of the Second International Conference on Genetic Algorithms and their Applications, pp. 225–230.
21. Park, H. and Cutkosky, M.R. (1999). Framework for Modelling Dependencies in Collaborative Engineer-ing Processes,Research in Engineering Design,11: 84–102. 22. Pongcharoen, P., Hicks, C. and Braiden, P.M. (1999). The Development of Bi-Criteria Genetic Algorithms for the Finite Capacity Scheduling of Complex Products, with Multiple Levels of Product Structure,European Journal of Operational Research.
23. Prasad, B. (1996). Concurrent Engineering Fundamentals, Integrated Product and Process Organization, Vol. 1, Prentice Hall, USA.
24. Ross, D.T. (1977). Structured Analysis (SA): A Language for Communicating Ideas, IEEE Trans. Software Engineering,3(1): 16–34.
25. Scott, J.A. (1998). A Strategy for Modelling the Design-Development Phase of a Product, Ph.D. Thesis, Department of Marine Technology, University of Newcastle upon Tyne, UK.
26. Starkweather, T., McDaniel, S., Mathias, K., Whitley, D. and Whitley, C. (1991). A Comparison of Genetic Sequencing Operators, In: Proceedings of the Fourth International Conference on Genetic Algorithms, pp. 69–76, San Mateo, CA, USA.
27. Steward, D.V. (1981). The Design Structure System: A Method for Managing the Design of Complex Systems,IEEE Trans. Engineering Management,28: 71–74. 28. Steward, D.V. (1981).Systems Analysis and Management – Structure Strategy and Design, Petrocelli Books Inc., USA. 29. Steward, D.V. (1991). Planning and Managing the Design
of Systems, In: Proceedings of Portland International Conference on Management of Engineering and Technology, pp.189–193, Portland, Oregon, USA. 30. Stewardson, D.J., Whitfield, R.I., Hicks, C., Pongcharoen, P.
and Braiden, P.M. (2001). Sparse Experimental Design: An Effective and Efficient Way of Discovering Better Genetic Algorithm Structures, 2nd European Conference on Intelligent Management Systems in Operations, Salford, UK. 31. Syswerda, G. (1991). Scheduling Optimisation Using Genetic Algorithms, In: Davis, L. (ed.), Handbook of Genetic Algorithms, pp. 332–349, Van Nostrand Reinhold.
32. Todd, D. (1997). Multiple Criteria Genetic Algorithms in Engineering Design and Operation, Ph.D. Thesis, Engineering Design Centre, University of Newcastle upon Tyne, UK.
34. Weist, J.D. and Levy, F.K. (1977). A Management Guide to PERT/CPM, Prentice-Hall, Englewood Cliffs, NJ, USA. 35. Whitfield, R.I. (2001). Effective Combinatorial
Optimisation,CAD Centre Internal Report, CADC/01-06/ R/03, DMEM, University of Strathclyde, Glasgow, UK.
36. Whitfield R.I., Smith J.S. and Duffy A.H.B. (2002). Identifying Component Modules, Seventh International Conference on Artificial Intelligence in Design AID’02, Cambridge, UK, 15–17 July 2002.
37. Whitley, D., Starkweather, T. and Fuquay, D. (1989). Scheduling Problems and the Travelling Salesman: The Genetic Edge Recombination Operator, In: Proceedings of the Third International Conference on Genetic Algorithms, pp.133–140. Morgan Kaufmann Publishers, CA, USA.
Robert Ian Whitfield
Robert Ian Whitfield is a Research Fellow at the CAD Centre at the University of Strath-clyde. In 1991 he gained a B.Eng. (Honours) degree in Mechanical Engineering from Newcastle upon Tyne Polytechnic. Following gra-duation he then carried out a Ph.D. research project investigat-ing modes of operation of turbo-generator rotor bearings. He then continued working within the fields of hydrodynamics and rotor-dynamics for a further 18 months at Parsons Power Generation Systems. He then worked at the Engineering Design Centre at the University of New-castle upon Tyne for three years, before being seconded to the CAD Centre on a project investigating design co-ordination. Currently he is working on a virtual reality ship design project at the University of Strathclyde.
Alex Duffy
Dr Graham Coates
Dr Graham Coates is pre-sently employed as a Senior Research Associate in the Engineering Design Centre at the University of Newcastle. He is currently conducting research in the areas of robust and dynamic scheduling, and design co-ordination. Prior to his work in academia he was employed in the aerospace industry for seven years. At British Aerospace he worked on aerodynamic and structural engineering aspects of aircraft development. At Aerospace Systems & Technologies he worked on a European consortium project on laminar flow technology for commercial aircraft.
Bill Hills