Int. J. Electrochem. Sci., 12 (2017) 5012 – 5022, doi: 10.20964/2017.06.64
International Journal of
ELECTROCHEMICAL
SCIENCE
www.electrochemsci.org
Application of Graphene and Pyridine in Anode Modification
for Enhanced Performance of Microbial Fuel Cells
Kun Cao
Department of Chemistry & Chemical Engineering, Neijiang Normal University, Neijiang, Sichuan, 641112, PR China
E-mail: [email protected]
Received: 28 June 2016 / Accepted: 23 March 2017 / Published: 12 May 2017
Carbon cloth was modified by graphene oxide, and then electropolymerized 2,6-Pyridinedicarboxylic acid (PDC) on the treated carbon cloth, which was as anode for microbial fuel cells. The power density of the modified carbon cloth reaches 1035 mW·m-2, which was 3.2 times larger than that of the MFCs with the unmodified carbon cloth anode. BET, scanning electron microscopy (SEM) and Raman spectroscopy were employed to detect the surface characteristics of the carbon cloth. CV and electrochemical impedance spectroscopy (EIS) were used to confirm the electrochemical characteristics. The results showed that graphene oxide and PDC could improve the charge transfer performance and bacterial reproduction.
Keywords: Microbial fuel cells, electropolymerized, Electrochemically reducing graphene oxide, Pyridinedicarboxylic
1. INTRODUCTION
transfer by determining the actual access area for microbe to anchor. Hence, a high-performance anode material is critical to improve the power output of MFCs.
The characteristics of the anode surface, such as surface area, surface potential, surface biocompatibility and surface roughness, significantly affect the anodic reaction’s performance. As a matter of fact, many laboratory studies reported that nanostructured materials have been proven to be a very suitable matrix for modifying the electrode. It has been proved that after the use of carbon nanotube [19,20], polyaniline [21] and polypyrrole [22], the energy loss of modified MFCs electrodes decreased the and the output of modified MFCs increased significantly. Pyridine’s use as biosensors [23] was much focused and studied because of its excellent stability and biocapability, while reports or studies on MFCs electrode with pyridine had hardly aroused enough attention. This is one of reasons that motivate the author to create.
Graphene is the basic unit of all graphitic carbons with a single-atom-thick sheet consisting of sp2 hybridized carbon atoms. As graphene has unique nanostructure, high surface area [27], and outstanding advantages in conductivity [28], mechanical strength [29] and electrocatalytic activities, it has showed great potentials in applications in extensive fields, such as lithium ion batteries [24], solar cells [25] and electrochemical super-capacitors [26]. Two methods can be taken to modify the electrodes by graphene. The first is directly deposition, which is to drop chemical reduction of graphene oxide (CRGNO) solution onto a conductive substrate [30,31]. The second way to reduce the GNO is electrochemical method (ERGNO), in this case, the thickness of the ERGNO films can be controllable as well as nontoxic .
In the present work, ERGNO/CC anode was fabricated by cyclic voltammetry (CV) method, the scanning potential from 0 to -1.6 V vs. a saturated calomel electrode (SCE) in phosphate buffer solution (PBS), and then, 2,6-Pyridinedicarboxylic acid (PDC) was electropolymerized on the surface of ERGNO/CC, and later adopted as MFCs anode. In order to verify the performance of PDC-ERGNO/CC and PDC-ERGNO/CC anodes, the properties of the modified anodes were examined by EIS and CV. Meanwhile, the surface characteristic was detected by Raman spectroscopy and SEM. In addition, the power output and the maximum power density were obtained as well.
2. EXPERIMENTAL
2.1. Chemicals and materials
2.2. Electrode fabrication
Prior to use, CC was cut into squares of 2 cm× 2 cm and then degreased in acetone for 3 h, later rinsed with the deionized water, and then, immersed in the sulfuric acid and nitric acid mixed solution (Vsulfuric : Vnitric = 3 : 1) for 3 h, then rinsed with deionized water a second time until the pH closes to neutral, finally, it took 12 h to dry the wet CC in a vacuum drying oven. The GNO/CC was prepared by dripping 1 mg·mL-1 GNO dispersion on the CC surface layer by layer, then, dried by airing. Finishing all above, the weight gain of the GNO reached 2 mg [20]. Through CV method, GNO/CC was reduced. In such way, the ERGNO/CC was also prepared. PDC-ERGNO/CC was prepared by pulse electropolymerization in the PDC solution (0.01 mol·L-1 PDC, 0.5 mol·L-1 KCl), pulse voltage was set at 1.8V, pulse time was set at 0.7 s (ton=0.4 s, toff=0.3 s), then rinsed with the deionized water and dried.
2.3. MFCs construction and operation
Two polymethylmethacrylate cylinders (5 cm deep, 30 cm2 of the cross sectional area) were used as MFCs reactor. The two chambers were separated by Nafion 117 membrane, each cell chamber has an effective volume of 150 mL. Original Escherichia coli(JM 109, Hongkong University) was grown at 37 ℃ for 24 h. Before inoculation, anode chamber with anolyte was saturated with nitrogen for 20 min and sterilisation. After that, 5 mL of Escherichia coliculture was inoculated. Anolyte consisted of 1 g·L-1 C6H12O6, 0.3 g·L-1 NH4Cl, 1g·L-1 NaCl, 0.04 g·L-1 CaCl2·2H2O, 0.3 g·L-1 MgSO4, 0.2 g·L-1 NaHCO3, 10.7 g·L-1 K2HPO4, 5.3 g·L-1 KH2PO4, and 1 mL trace elements [20]. CC (2 cm× 2 cm) without treatment was used as the cathode. 50 mmol/L K3[Fe(CN)6] and 100 mmol/L PBS were added in the cathodic chambers. The cell systems were placed in an incubator at 37±0.5℃ and the anolyte was renewed by batch feeding when the potential lower than 50 mV.
2.4. Measurement and analysis
3. RESULTS AND DISCUSSION
3.1. Modification process of anode
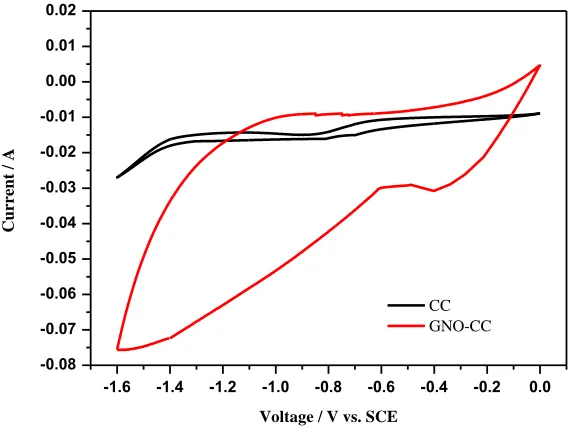
Fig. 1 shows the CV curves of the electrochemical reduction of GNO/CC. The cathodic reduction peak from -0.58 to -1.5 V owing to the formation of ERGNO on the CC surface. The result is in accordance with the previous literature [33,34,35].
-1.6 -1.4 -1.2 -1.0 -0.8 -0.6 -0.4 -0.2 0.0 -0.08
-0.07 -0.06 -0.05 -0.04 -0.03 -0.02 -0.01 0.00 0.01 0.02
C
urre
nt
/
A
Voltage / V vs. SCE
[image:4.596.141.426.217.430.2]CC GNO-CC
Figure 1. CV curves of CC and GNO/CC in PBS
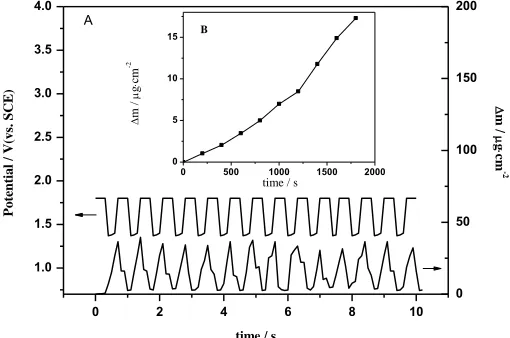
Fig. 2 shows the current-time curves during pulse electropolymerization of PDC film from 0.01 mol·L-1 PDC monomer and 0.5 mol·L-1 KCI mixed solution. The first pulse from this figure, the current increases to 0.102 A within 0.4 s. In the pulse-on time (ton=0.4 s), the PDC monomer around the working electrode is oxidized into active monomer and some of active monomers electropolymerized into large molecules, which attached to the surface of ERGNO/CC through chemical bonds. The current becomes smaller, due to the decreasing concentration of monomer around the surface. In pulse-off time (toff=0.3 s), the active PDC monomers are polymerized and soak into the working electrode [36,37].
30.09 μg·cm-2
instantly. Fig. 3(B) shows that, the quality increases with increasing polymerization time. The quality increases slowly at the beginning, due to the rate of macromolecules connecting to the surface lower than the polymerization rate. The activities connecting to the surface increase with increasing polymerization time, so the number of macromolecules connecting to the surface increases. After polymerization, the increased quality of the film is 16.96 μg·cm-2.
0 5 10 15 20
0.00 0.02 0.04 0.06 0.08 0.10 C urre nt / A
[image:5.596.162.411.194.376.2]Time / s
Figure 2. Current-time curves during unipolar pulse electropolymerization of PDC films
0 2 4 6 8 10
1.0 1.5 2.0 2.5 3.0 3.5 4.0
0 500 1000 1500 2000
0 5 10 15 m / g cm -2 m / g cm -2 Po tent ia l / V (v s. SC E )
time / s time / s
A 0 50 100 150 200 B
Figure 3. A: Potential-time and mass-time curves during pulse electropolymerization of PDC films. B: apparent mass of PDC films vs. time during pulse electropolymerization of PDC films.
3.2. Morphology analysis
[image:5.596.176.431.437.606.2]
Table 1.BET surface area of different electrodes
Electrode BET surface area (m2/g)
CC 2.87
ERGNO/CC 647
PDC-ERGNO/CC 863
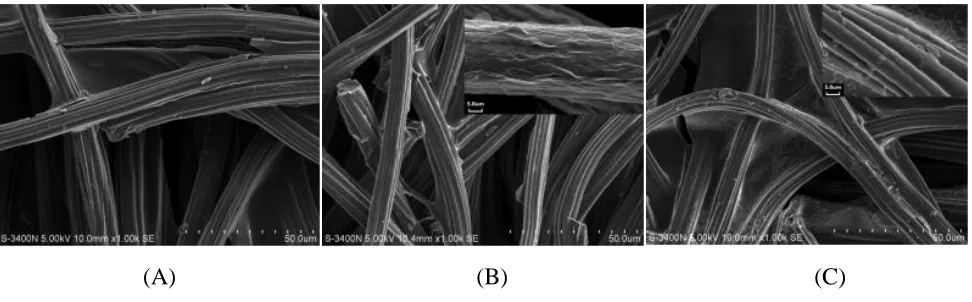
Fig. 4 is the SEM morphology of PDC-ERGNO/CC, ERGNO/CC and unmodified CC to examine the differences of anode surfaces after different treatments. From Fig. 4(a), the unmodified CC shows relatively smooth surface. Compared with Fig. 4(a), Fig. 4(b) (c) appears a large amount of micro structures, such as thin wrinkled and crumpled structures, that are typical structures of ERGNO, proving and responding to those results agreeably [34,38,39]. Fig. 4(c) also shows the film and particles between the carbon fiber. Obviously, it further proves that the PDC-ERGNO hybrid coating was formed on CC.
[image:6.596.51.537.333.484.2]
(A) (B) (C)
Figure 4. SEM images of CC (a), ERGNO/CC (b), and PDC-ERGNO/CC (c)
Figure 5. Raman spectrum of CC, GNO/CC, ERGNO/CC, PDC/CC and PDC-ERGNO/CC
3.3. Electrochemical analysis
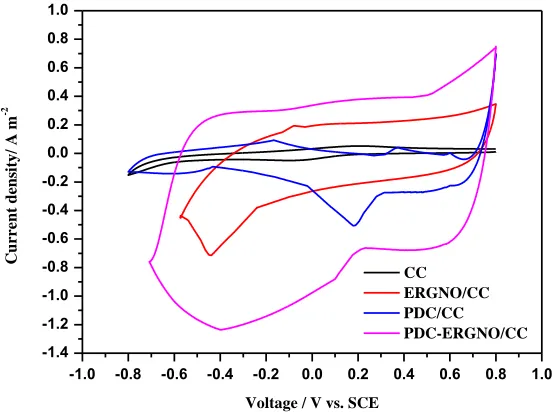
Fig. 6 shows the CV test to indicate the electrochemical properties of the anode materials. From Fig. 6, the increase in the currents reflex that more surface area is involved for E. Coli attachment [30,31].
-1.0 -0.8 -0.6 -0.4 -0.2 0.0 0.2 0.4 0.6 0.8 1.0 -1.4
-1.2 -1.0 -0.8 -0.6 -0.4 -0.2 0.0 0.2 0.4 0.6 0.8 1.0
C
urre
nt
dens
it
y
/
A
m
-2
Voltage / V vs. SCE CC ERGNO/CC PDC/CC
PDC-ERGNO/CC
Figure 6. CVs of PDC-ERGNO/CC, ERGNO/CC, PDC/CC and CC in 100 mM PBS
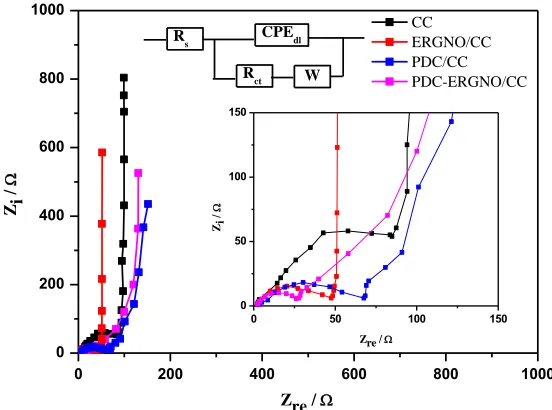
Nyquist plots were employed to understand charge transferring process (Fig. 7). The impedance spectra exhibit similar characteristics as two clear parts: the depressed capacitive loop at the high frequencies and the straight line standing for changes under the environment of low
1000 1500 2000 2500 3000
CC GNO/CC ERGNO/CC PDC/CC PDC-ERGNO/CC
In
tensi
ty
/
a
.u.
[image:7.596.149.426.441.647.2]
frequencies, which indicate the charge transfer and Warburg diffusion limitations, respectively. Considering the charge-transfer kinetic at the higher frequency as well as the diffusion at the lower frequency, the impedance data could be appropriately interpreted using the Randles equivalent circuit, in which Rs represents the solution resistance between the working electrode and the reference electrode, Rct is the charge-transfer resistance, Cdl is the double layer capacitance, W is the Warburg impedance. In comparison with the CC anode, the semicircles of the modified anodes are notably smaller[44]. The Rct of the PDC-ERGNO/CC and ERGNO/CC anodes are 37 Ω and 56 Ω, while it is 152 Ω for the CC anode, due to the reduction of internal resistance for the CC anode by PDC and ERGNO. Thus, the electrochemical performance of CC anode has been improved to a great extent due to treat the anode surface with the PDC-ERGNO.
0 200 400 600 800 1000
0 200 400 600 800 1000
Zre /
0 50 100 150
0 50 100 150
Zi
/
Zre /
Zi /
CC ERGNO/CC PDC/CC PDC-ERGNO/CC
Rs CPEdl
[image:8.596.151.427.280.485.2]Rct W
Figure 7. EIS of PDC-ERGNO/CC, ERGNO/CC, PDC/CC and CC in 100 mM PBS
3.4. Power curve
[image:9.596.156.419.145.337.2]
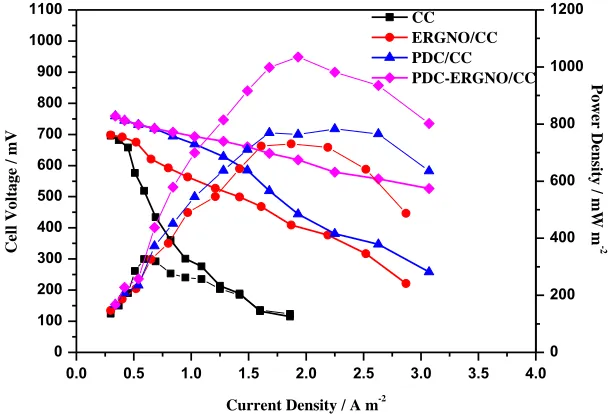
times whereas the maximum power density of unmodified MFCs fixing at only 327 mW·m-2 under similar situation.
Figure 8. Power density output of the MFCs with PDC-ERGNO/CC, ERGNO/CC , PDC/CC and CC
0.0 0.5 1.0 1.5 2.0 2.5 3.0 3.5 4.0
0 100 200 300 400 500 600 700 800 900 1000 1100 CC ERGNO/CC PDC/CC PDC-ERGNO/CC Po w er D ensi ty / mW m -2 C el l V o lt a g e / mV
Current Density / A m-2
0 200 400 600 800 1000 1200
Figure 9. Polarization curves with PDC-ERGNO/CC, ERGNO/CC, PDC/CC and CC as the MFCs anodes
4. CONCLUSIONS
Reduction of graphene oxide in electrochemical ways is controllable and reproducible, the thickness is uniform, and moreover, toxic chemicals can be excluded. The maximum power density of the MFCs with PDC-ERGNO/CC anode achieved 1035 mW·m-2 which is 3.2 times larger than that the MFCs with the CC anode. The PDC-ERGNO modified anode could improve circumstances of the
0 100 200 300 400 500
0 200 400 600 800 Po w er dens it y / mW m -2
Time / h
[image:9.596.152.457.400.607.2]
surface area of the electrode, adhesiveness of microbe and efficiency of charge transferring. These results prove that the method provided within this paper is simple and reliable for fabricating new low-cost, nontoxic and effective anodes for MFCs.
ACKNOWLEDGEMENTS
The author gratefully acknowledges the support of Doctor Founding of Neijiang Normal University (No. 15B13).
References
1. C. Abourached, M. J. English and H. Liu, J. Clean. Prod., 137 (2016) 144.
2. I. M. Jimenez, V. Celorrio, D. J. Fermin, J. Greenman and I. Ieropoulos, Water Res., 109 (2017) 46.
3. Y. H. Li, L. F. Liu and F. L. Yang, J. Membrane Sci., 525 (2017) 202.
4. G. Hernández-Flores, H. M. Poggi-Varaldo, O. Solorza-Feria, Int. J. Hydrogen Energy, 41 (2016) 23354.
5. S. H. Chang, J. S. Liou, J. L. Liu, Y. F. Chiu, C. H. Xu, B. Y. Chen and J. Z. Chen, J. Power Sources, 336 (2016) 99.
6. B. E. Logan and K. Rabaey, Science, 337 (2012) 686.
7. I. S. Chang, J. K. Jang, G. C. Gil, M. Kim, H. J. Kim, B. W. Cho and B. H. Kim, Biosens. Bioelectron., 19 (2004) 607.
8. J. L. Zheng, C. X. Cheng, J. Zhang and X. H. Wu, Int. J. Hydrogen Energy, 41 (2016) 23156. 9. S. Luo and Z. He, Electrochim. Acta, 222 (2016) 338.
10. Z. Baicha, M. J. Salar-Garcia, V. M. Ortiz-Martinez, F. J. Hernandez-Fernandez, A. P. de los Rios, N. Labjar, E. Lotfi and M. Elmahi, Fuel Process. Technol., 154 (2016) 104.
11. C. Y. Zhang, P. Liang, X. F. Yang, Y. Jiang, Y. H. Bian, C. M. Chen, X. Y. Zhang and X. Huang, Biosens. Bioelectron., 81 (2016) 32.
12. S. Srikanth, M. Kumar, D. Singh, M. P. Singh and B. P. Das, Bioresource Technol., 221 (2016) 70. 13. Y. J. Li, L. F. Liu, J. D. Liu, F. L Yang and N. Q. Ren, Desalination, 349 (2014) 94.
14. V. M. Ortiz-Martinez, I. Gajda, M. J. Salar-Garcia, J. Greenman, F. J. Hernandez-Fernandez and I. Ieropoulos, Chem. Eng. J., 291 (2016) 317.
15. J. Y. An, Y. S. Lee, T. Y. Kim and I. S. Chang, J. Power Sources, 323 (2016) 23. 16. D. J. Lee, J. S. Chang and J. Y. Lai, Bioresource Technol., 198 (2015) 891.
17. C. S. He, Z. X. Mu, H. Y. Yang, Y. Z. Wang, Y. Mu and H. Q. Yu, Chemosphere, 140 (2015) 12. 18. Z. Fu, L. T. Yan, K. X. Li, B. C. Ge, L. T. Pu and X. Zhang, Biosens. Bioelectron., 74 (2015) 989. 19. X. Xie, G. H. Yu, N. Liu, Z. A. Bao, C. S. Criddle and Y. Cui, Energy Environ. Sci., 5 (2012)
6862.
20. J. X. Hou, Z. L. Liu and P. Y. Zhang, J. Power Sources, 224 (2013) 139.
21. J. E. Mink, J. P. Rojas, B. E. Logan and M. M. Hussain, Nano Lett., 12 (2012) 791.
22. Z. S. Lv, Y. F. Chen, H. C. Wei, F. S. Li, Y. Hu, C. H. Wei and C. H. Feng, Electrochim. Acta, 111 (2013) 366.
23. T. Yang, W. Zhang, M. Du and K. Jiao, Talanta, 75 (2008) 987.
24. E. J. Yoo, J. Kim, E. Hosono, H. S. Zhou, T. Kudo and I. Honma, Nano Lett., 8 (2008) 2277. 25. U. Mehmood, Org. Electron., 42 (2017) 187.
26. H. Sun, P. She, K. L. Xu, Y. X. Shang, S. Y. Yin and Z. N. Liu, Synthetic Met., 209 (2015) 68. 27. R. Kakarla and B. Min, Int. J. Hydrogen Energy, 39 (2014) 10275.
29. C. Lee, X. D. Wei, J. W. Kysar and J. Hone, Science, 321 (2008) 385.
30. X. M. Zhang, K. Z. Li, H. J. Li, J. H. Lu, Q. G. Fu and Y. H. Chu, Synthetic Met., 193 (2014) 132. 31. S. Cotchim, P. Thavarungkul, P. Kanatharana and W. Limbut, Electrochim. Acta, 184 (2015) 102. 32. W. S. Hummers and R. E. Offeman, J. Am. Chem. Soc., 80 (1958) 1339.
33. B. Silwana, C. van der Horst, E. Iwuoha and V. Somerset, Thin Solid Films, 592 (2015) 124. 34. X. Zhang, Y. C. Zhang and J. W. Zhang, Talanta, 161 (2016) 567.
35. L. Wang, C. K. Chua, B. Khezri, R. D. Webster and M. Pumera, Electrochem. Commun., 62 (2016) 17.
36. V. Pascal, D. Laetitia, L. Joel, S. Marc and P. Serge, Appl. Surf. Sci., 253 (2007) 3263.
37. S. Palacin, C. Bureau, J. Charlier, G. Deniau, B. Mouanda and V. Pascal, Chem. Phys. Chem., 5 (2004) 1468.
38. S. Jampasa, W. Siangproh, K. Duangmal and O. Chailapakul, Talanta, 160 (2016) 113. 39. M. M. Hantel, R. Nesper, A. Wokaun and R. Kotz, Electrochim. Acta, 134 (2014) 459.
40. J. Yan, T. Wei, B. Shao, Z. J. Fan, W. Z. Qian, M. L. Zhang and F. Wei, Carbon, 48 (2010) 487. 41. S. Karna, M. Mahat, T. Y. Choi, R. Shimada, Z. M. Wang and A. Neogi, Sci. Rep., 6 (2016)
36898.
42. K. H. Kim, M. H. Yang, K. M. Cho, Y. S. Jun, S. B. Lee and H. T. Jung, Sci. Rep., 3 (2013) 3251. 43. K. McCann and J. Laane, J. Mol. Struct., 890 (2008) 346.
44. A. J. Bard and L. R. Faulkner, Electrochemical methods: Fundamentals and applications. 2nd ed., John Wiley & Sons Inc, (2001) New York, USA.
45. K. Rabaey and W. Verstraete, Trends Biotechnol., 23 (2005) 291.