Cosmic Noise Absorption Pulsations
J. S. Reid
•Submitted in fulfilment of the
•requirements for the degree of
•
Doctor of Philosophy
University of Tasmania
Hobart.
November, 1972.
approximation formula for relaxation time as a function of height was derived.
Abstract
The fast cosmic noise absorption (a.n.a.) . pulsations observed with fast response riometers at Macquarie Island in the southern auroral zone are discussed in relatipn to the parameters of the lower ionosphere. The pulsations which are similar to and associated. with pulsations in aurora
o
luminosity (at 4278A), Pi2 micropulsations and fast bremmstrahlung X-ray pulsations are unique in that they
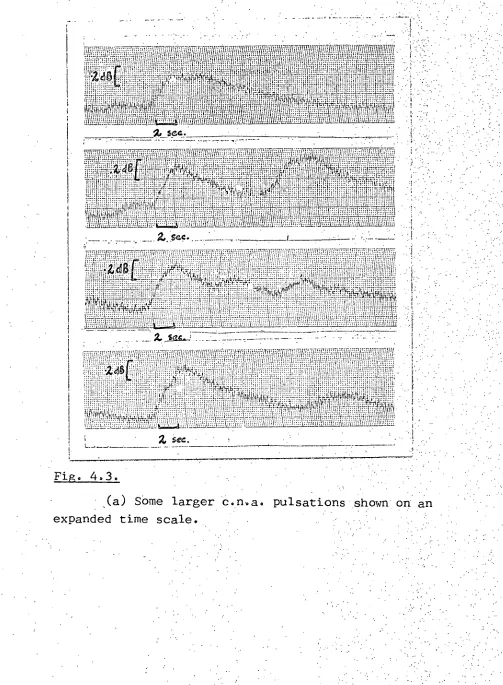
exhibit a time asymmetry or relaxation time which is believe to be a consequence of the relatively slow rate of removal of secondary electrons in the ionosphere. The relaxation time, T is defined as
where A is the atplitude_ofthe,Pulse,above . backgroundl and (A)max is the Maximumf(negative) slOpe..Ofthereiaxation.s. part ofthe pulse. Measured values . Of T varied between 1 and ,30 seconds . and,sqatter:diagrams of .T. veraus ....:AJndicate a
'strong tendency for T to 'increase wittiincreasingpule amplitude.
The properties and anomalies of the D-region of. the
ionosphere are discussed, as is the applicability of the Bates
and Massey rate equations to fluctuations in electrons
density in this region. A computer model was constructed in -
which the rate equations were numerically integrated using .a , variety of values of the parameters involved and for a . variety of primary spectrum e-folding energies in an attempt to
simulate the observed pulsations. Relaxation times as small a s some of those observed were not obtained from the model .'A new
recombine with positive ions of widely differing .reaction rates is discussed and dismissed.
It is concluded that the observed c. n. a. pulsations• are an E-region phenomenon associated with quasi
Contents
Forward.
Introduction.
Section 1 : The D-Region.
Section 2 : A D-Region Model.
7
Section 3 : C.N.A. Pulsations - I.Todel Predictions.
Section 4 C.N.A. Pulsations - Experimental Observations.
•Section 5 : • Conclusion.
• Acknowledgements.
References.
AQ22121.ices
I. Time Lags in the Auroral Zone Ionosphere.:
I. Random Sampling with Low Resolution Detectors.
IV. Ionization Rate Profiles : The Effect of
Forward
.This work was commenced from the standpoint that the bulk of cosmic noise absorption occurs below 100 km
height, that is, in the D -.region . of the atmosphere. This was no doubt a natural assumption and one which is deeply embedded in the literature of riometry. The con elusion of Section 5, that c. n. a. pulsations and the background absorption accompanying them are an E region phenomenon did not become apparent to the author until the thesis was three - quarters written. Consequently Much of the early material is concerned with D - region processes and the reader may perhaps gain an impression of inconsis -tency, as if the author " could not make up his mind.
It should be emphasised that such discussion of D - region processes is essential in order to eliminate this part of the atmosphere as the location of the puls-ations. Indeed the failure of the D region model to
- adequately predict sufficiently short relaxation times
forced the author to the conclusion which was finally reached. This thesis thus has a chronological as well as
legical development and, one hopes, will lead the reader to the same conclusion.
The thesis is structured as a fairly short central argument accompanied by four appendices. The latter, taken together constitute almost, half the wordage. The reasons for this format are twofold:
(i) It was originally intended to publish much
for publication almost as it stands and it is intended' that the body of the thesis be submitted for publication in an abridged form.
INTRODUCTION
The riometer is an instrument devised by C.G.Little and N. Leinbach in <1958 to provide information about the electron content of the ionosphere by monitoring the
ionospheric absorption of cosmic radio noise. It consists of a broad beam antenna, a low rioise receiver at' about 30 MHz and some sort of reference device such as a low noise diode which is often incorporated in a feedback loop with the receiver to give exceptional long term stability. Radiation - from the Galaxy and from discrete radio sources is absorbed
in the upper atmosphere by free electrons. The degree of absorption depends upon the density of the electrons and the rate at which they lose energy by collisions with heavier
Particles. Thus the degree of cosmic noise absorption (c.n.a.) displayed by the instrument provides a measure of the weighted mean of the electron density in the upper atmosphere within the beam of its antenna.
The resolution of the instrument is limited by the statistical nature of the cosmic radio noise detected and this in turn depends upon the bandwidth of the receiver. In order to improve the _resolution while sacrificing such things as stability and freedom from man-made and solar interference, the bandwidth was widened from 20 KHz to 1.4 MHz thus increasing the time resolution by a factor of 7 for the same amplitude sensitivity.
This modified instrument, a "fast-response riometer" was first operated in the auroral zone in December 1?66.
Within the first few days of ,operation a new phenomenon
was observed 3 fast cosmic noise absorption pulsationsthe range of from 2 to 30 seconds. Their amplitudes ranged from about 0.3 dB down to the .02 dB amplitude resolution of the instrument. ;Their most striking characteristic was a tendency to be asymmetric in time with rapid onsets
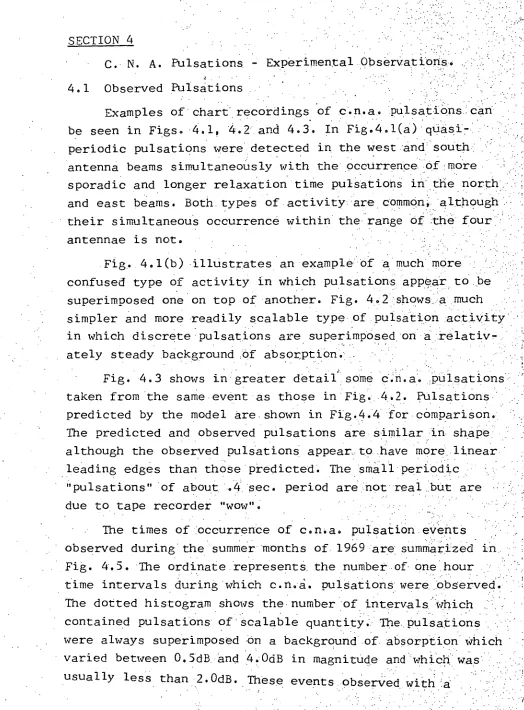
(1 to 4 seconds) and slower decay times (uP to 30 seconds). Some examples of fast c.n.a. Tulsations can be seen in
Figs. 4.1, 4.2, 4.3.
This thesis is concerned with these fast c.n.a.
pulsations, their origin and their possible use as ,a diag-nostic tool in investigating the ionosphere and the magnet-osphere. The pulsations were observed from Macquarie Island
(54.5 °S, 158.9 ° E Geographic, Invariant Latitude 64.5 ° S)
during the Summer months of 1967, 1968 and 1969. Appendix III provides a technical description of the fast response.
riometers used. The relationships observed at this time
SECTION I
The D-region
1.1. The association of fast c. n. a. pulsations and fast
bremrnstrahlung x-ray pulsations (Appendix I) indicates that ' they are caused by pulses of electrons in the energy range of tens of KeV precipitating from the magnetosphere into the iohosphere: Such high energy, "primary", electrons will create many times their number of free low-energy "secondary" electrons and positive ions by collision with air molecules. It is these secondary electrons which are observed by the riorrieter. After the primary pulse has r:
ceased, many secondary electrons will remain, being removed relatively slowly; by mutual: neutralization with positive ions and and by attachment to. neutral Molecules. to forrn negative, ionS.:
The slow decay of the fast c.
n,
a. Pulsations is then, an •atmospheric process, dependant On the chemistry of the'atinOsPhere . •,, . at heights over which the absorption of cosmic noise is ,takig'Place.. The height distribution of the free, absorbing iecondary. electrons will in turn be dependant upon the energy :spectrum Of the primaries: which give rise to them. The atmospheric nature of the asymmetry of the pulsations is borne out by the fact that neither the fast
bremmstrahlung x-ray pulsations nor the X 4278 A° diziO:ral luminosity pulsations with which they have been observed show •• any asymmetry themselves.
It is the purpose of this work to exämmne,in 'detail 'the,
relationship between the observed decay times of the pulsations . and decay times deduced from various Models of the atmosphere
, •
fast response riometer becomes a powerful instrument
for probing the magnetosphere since each pulsation would be " effectively "tagged" with information about the primary pulse which created it. It might, for example, be possible usiiit a
series of riorneters with narrow beam antennas, to obtairi;,ari energy or pitch angle cross section of a single pulse Of
precipitating electrons.
On the other hand if we have some idea of the.
characteristics of the primary particle spectrum and hence of the. height distribution in ion pair :production rate, it Would be possible to verify or disprove some of the currently accepted values of the various parameters of ionospheric processes.
In order to fulfill this purpose it will be necessary to. construct a mathematical model of the electrical behaviour of the lower ionosphere.
D-region Problems .
. 1.2. The region of the atmosphere between 60 and 10.0
which the bulk of cosmic noise absorption occurs during aurcrial zone activity, is perhaps the most complex region of the
atmosphere. It is the region in which most of the ionizing radiation impinging upon the earth is absorbed. Despite the: fact that a variety of techniques have been used .for'a number of years in probing this region, its behaviour both electrically ancl chemically is still by no means fully understood; a nurnber ,of anomalies remain. Indeed 'the more information that be&aneS: available the more complex the region appears to be.
Most of the problems hinge upon the chemical composition of the D-region atmosphere since this must determine its electrical, behaviour; the rate. at which free electrons are created and.
--
icinizing radiation which includes energetic particles xra,ys and hard and soft ultraviolet radiation from the sun, frorn stellar and galactic sources and from the environs of the earth itself. can now be experimentally measured outside theatmosphere. Their effects on the atmosphere can be computed. Electron density profiles of the upper atmosphere can be
obtained with a high degree of accuracy by means of rockets and in recent years the concentrations of the various positive and negative ion species present have been measured with rocket borne instruments.
The problems concern these observed electron densities and their relationship to the computed production and loss rates. 1.3. The Ionospheric Rate Equations
The ionospheric rate equations (Bates and Massey, 1946) describe the rates at which electrons and ions are produced and lost in an ionized gas.
,dN dt
They are
and
dN-
13N - YN w• -N+ dt
where q is the ion pair production rate,
cc is the electron - ion recombination coefficient ) is the attachment rate of electrons
to neutral mol,ecules to form negative ions
y is the ion-ion recombination coefficient ,
Diffusion terms and thermodynamic terms have been omitted from (1. 1). The omission of diffusion terms may not be: justified in the Vicinity of large height gradients. such as those
mentioned below. Nevertheless these equations describe the gross .:features of the ionosphere.. Numerous complex chemical
reaction schemes have been put forward to explain and predict the concentration of various ion species and neutral reactants. , It should be noted that the form of (110 is independant of Suah. reaction schemes while the values of the parameters r , • , y depend on the ionic composition of the atmosphere at the given height and are Weighted means of perhaps a number of reaction: rates. For example
Z
. I N+where a ; is the reaction rate of electrons with theith species :
of positive ion with number density N The term "macroscopic' or "effective" is used to distinguish the mean parameters o
equation (1.1) from the'.actual rate parameters of the individual reactions.
It is immediately obvious that the `macroscopic parameter8 . are likely to be not only functions Of height in the atmosphere but also of-tirrik; the atinosiphere may welt behasie : , differently to sudden changes in ion pair production rate :frOrri.
• .
the way in which it reacts to quasi-Steady ;- state changes since the positive and negative ion corriPosition May differ. in.:the two. cases. For the Same reason the.rate'eqUation pa:rameters may , also depend on the production rate 0 andon the types of positive ions that are produced by the ionizing source.
recombin'ation + xy is called the "effective
(1 If =
which yields the continuity equation for positive ions. Adding (1.1a) and (1.1b)
dN+
dt =q -
For simplicity 1
= N-/ N
Then
and
t• us introduce a further,
_Then (1.1)'becomes,:
dN q= - 2
The assumption is frequently made . that
dt whence
dN dt i.e.
dN = dt where
coefficient" (see, for example, Whitten & Poppoff, 1965 page 143). The assumption (1.5) is not justified and will be
discussed again in a later section. Equation (1.6) is not,: a valid approximation to equations (1.1).
. e . q
Where V = (1 + X) (m + Ay) is termed the electron loss rate. Its value determines the steady state electron density at any height in terms of the ion pair production rate. When
x <<1. then From equation . have
N . =
from 1.7 and
from which
where
dp=
(1 +A)/(a _ _/y 0
is a slowly varying function ofk
lying between 1 and y/a.1.4. The Rate Equation Parameters 1.4.1 . Attatchment Processes
One process is thought to predominate in the formation _ _ of negative ions from electrons:
0 2 + 0 2 + e -* 0 - 2 + 0 2
. There is' little disagreement over the ra.e. coefficient
for this process. Laboratory measurements have conSistentTY,
yielded a value of between 10 -3° ' and .3 x).0' 30 Cmsec. 7 1
,
(Ohanin et al, 1959, Pack and Phelps, 1966). We will use theAnother possibility for electron attachment is e + 0
2 -4- 0 2 +hv
-17 which has a reaction rate coefficient of 9 x 10 at
375 ° K (Pack and Phelps, 1966). Assuming that neither rate coefficient is a strong function of temperature, the process
(1.12) will predominate over (1.11) only for 0 2 concentrat-ions of less than 6 x 10 13 cm." 3 i.e. above 82 Km. At such heights X is likely to be much less than unity, there are
few negative ions and attachment -'detatchment processes are of little importance. We can therefore neglect process
(1.12) and write
where m is the concentration of molecular oxygen.
1.4.2 Detachment Processes
That radio-wave absorption, increases during the daytime has been known since the days of the first radio transmissions. A striking example of such daytime enhance- , ment of absorption is demonstrated by riometer observations of polar cap absorption (PCA) events. During these events cosmic noise absorption at polar cap stations at 30MHz increases markedly for periods of up to two or three days due to the bombardment of the polar cap ionosphere by solar protons. The absorption is typically about 3 dB at night compared with 9 dB or so during the day.
-
. Molecular oxygen ions, 0 2 are readily dissociated .
into molecular oxygen and free electrons by the action of visible light' and for many years this process was invoked
to explain day-night differences in D-region absorption. The
parameter 6 was written
= + yn
Wherefi is the photodetatchment rate for molecular oxygen ions with a value of . 3 to .4 set and y IS the collisional detatchment rate for these ions and was believed
-16
to have a value as small as 10 to 10 cm Sec
(Bailey, 1959; Phelps and Pack, 1961; Whitten et al. , 1965).. Here n is the number density of neutral .species at the .given height. In equation (1.10) X Will be strongly dependant or the
value of/0 ; during the day, will be the dominant term while - at night io falls to zero with a consequent increase in X : for similar values. of q . This will result in an increase in )if and decrease in N the electron density and hence in absorption. That is,photo`detatchment of 0 during the day keepsthe electron density high While at night electrons are removed, by attachinent.
The inaidequaCy of this picture was demonstrated by G. C. Reid (1961) who examined changes in C:n. a. occuring.'at dawn at Fort Churchill during a PCA event. A fairly sudden
.change would be expected as the visible light shadow of the .
earth crosses he absorbing region and photodissociation:.of ions commences.'Instead the observed change was slower.and later than predicted (or earlier in the case of the sunset effect) indicating that the shadow of the ozone layer was the inipOrtant factor not the visible light terminator: This implies-that Ultra- violet radiation rather than visible light is ne6essary to diseciciate whatever negative ions are present.
More recent work has changed the simple photodetatchrnent , model completely. Associative detatchment of negative ions in
by Fehsenfeld et al (1966,1967) and by Moruzzi and Phelps (1966). These experiments showed that the rate is so fast that with more than 1010 oxygen atoms per cm. above 40 Km 3
, -
during the daytime, the 0 2 destruction rate by associative detachment is ten times faster than by photodetachment.
Various reaction schemes (Le Levier and Branscombi, 1968; G.C.Reid 1970; Arnold and Krankowski,1971; Ferguson,1971) , indicate that 02 is not the dominant negative ion but that it
should react rapidly to form 03 - 1 NO3 - and
,c04
-
which
are much more stable. Furthermore direct rocket measurements of negative ions densities have shown that ions as heavy as these do indeed make up the bulk of negative ions in the lower ionosphere (Narcisi et al, 1971; Arnold et a1,1971).The strong day night variation in absorption during events now becomes explicable in terms of the day-night variation in molecular oxygen concentration. This is
.Controlled by the photo-dissociation of 02 and 0 3 during the day and the reaction of atomic oxygen back to ozone at
Negative ions other than 0 - , 0 2 , and 03 are believed
to
be stable with regard to photodetachment and colliSional and associative detachment and are rem:wed only by mutualneutralization with positive ions. Therefore the removal rate of negative ions will depend largely on the concentrat-ions of these three concentrat-ions and on the concentration of atomic oxygen i.e.
6
N-
=
( /° i kl
CC) )
i=1
ssihere i .is the photodetachment rate arid.k:the
or associative detachmentrate of the species Oi
Thus
3
where
and 6 is dependant on the proportion of negative ions which are 0 - , 02 - , and 0 3 and on the neutral molecular oxygen concentration.
1.4.3 Recombination Processes
The ion-ion recombination coefficient, y, is , generally
- 3 1 '
assumed to have a value of about 10 . cm .sec.7 - . The value chosen was found to have little effect on the behaviour 0 rate equations (1.1). The reasons for this are ' disbilssed by Le Levier and BranScomb (1968).
The electron-ion recombination coefficient on the 'Other hand is perhaps the most .illIpOrtant single parameter of the rate equations. It was believed that dissociative recombin-ation
proceeded much faster than other electron-ion recombination processes and so it is frequently called the "dissociative recombination .coefficient". Since the discovery that heavy Positive ions ) Predominate below 90 Km this term may prove to be a misnomer.
The recombination coefficient occurs in three forms in the literature, as d, in 10 and in d eff . a eff has been
estimated from the time varying behaviour of the ionosphere
and 4.5 from steady state 'conditions. Estimates of these parameters are summarised graphically by Atm (1968) and . by Jacobs et al (1969).
Estimates : of d 'can
pe
made by examining t][1:e, hi altitude trend of 'their figures... They .V.arT over a range:1 •
• - . • .• -• -
two orders at magnitude; from 10 8 . . cm. 3 sea. . -1
-3 -1 .
to 7 x 10• More recent estimates have placed a at greater than
10 -6 cm. 3 sec.. and Shaw, 1965).
Thus the controlling parameter of the lower ionosphere is among those for which estimates are least reliable.
Estimates of its value are intimately related to estimates of ion pair production rate and are discussed again in section 1.5.2.
1.5 Ion Pair Production
1.5.1. The Nitric Oxide Problem.
The direct sources of ionization in the daytime are solar x-rays, solar ultraviolet radiation and, at latitudes. Particles from 'the magnetosphere.
The bulk of the ultraviolet radiation from the in the form of Lyman -a radiation (X 1215.7 A) from hydrogen. The flux contained in the Lyman -a line is
comparable with the integrated flux of the remainder of the - solar ultraviolet spectrum. The absorption cross Section of
N2 in the u.v. region is very small and so 0 2 is the main absorber of solar u.v. in the earth's atmosphere. By coinc-idence, 02 has an exceptionally small cross section at
almost exactly the frequency of Lyman -a forming a "window" which allows Lyman -
a
radiation to penetrate deep into theatmosphere i.e. down to
70
Km or so.Nitric oxide is present
in
this region of the atmosphereand has a high ionization cross section at X1215.7 A. Thus trace quantities of this Molecule can give rise to relatively - Varge
numbers of electrons and NO+
ions. The altitude profile
of NO between 70 and 80 KM and the flux of Lyman -a radiation are crucial in determining the ion pair production rate in this region of the mid-latitude daytime ionosphere.Early estimates of NO concentration derived from hypo- thetical D-region reaction schemes using laboratory
-
5
rate coefficients implied concentrations of 10 to 10 cm which in turn implied ion pair production rates of the order o
-3 -1
ion pair cm sec (Mitra, 1968). However rocket measur-e- ments at NO dayglow by Barth (1966) and Pearce (1969) gave
- much higher values ranging from 4 x 107 cm-3 to 1.7 x 10 8 cm Which should give rise to ion pair production rates, q,of the order
-3
of 10 cm sec '.
These more recent estimates of q place a further strain
on a . If attachment processes are neglected, a is required -5
to be as high as 5 x 10 cm3. sec in order to explain the observed electron density profiles (G. C. Reid, 1970). Even if these more recent values of NO concentration prove to be in error, our estimates of the ion-pair production rate profile would be unlikely to be restored to its old value. It has recently been shown (Hunten and McElroy, 1968) that excited 0 2 in the 1,6,g
state can be 'ionized by Lyman -a. Measured concentrations of 02, ( 1 A6. 0 indicate that the production rate of electrons from this source alone is of the same order as that derived from the
higher NO concentrations;
1.5.2. The 90 Km. Ledge and Water Cluster Ions
G. C. Reid (1970) has pointed out the frequent occurrence, in rocket electron density profiles, of a 'ledge" between 80 and
-
90 Km in altitude. The ledge consists of an increase in electron density by about an order of magnitude with changes in height of one or two kilometres.- Such a sharp gradient is difficult to
explain in terms of ionizing electromagnetic radiation since the production rate profile must fall off with decreasing height at , a rate determined solely by the scale heights of the ionizing
and absorbing species.. Molecular and eddy diffusion seem to
— In the same height interval Narcisi and 13ailey using . rocket borne mass spectrometers found a similar ledge in the positive ion composition of the ionosphere. Significant: in their findings was the unexpected predominance of positive: ions.
of high molecular weight below the ledge believed to be water cluster ions, H. (H 2 0)+. G. C. Reid (1970) explains the n
existence of the electron density ledge and of the anomolously.
low electron concentrations below the ledge in terms of an enhanced ability of the more complex water cluster ions to recombine with electrons. Cons , equently a will be higher than previously supposed at these levels. Reid uses the empirical rocket data for electron density and an ion pair production rate profile computed from the high NO figures of Barth to compute an height profile for . He finds 0, to be 5 x10 '7
-5 -
above 87 Km and about 5 x 10 cm 3 sec 1 below this height. He excludes the possibility of attatchMent processes
contributing significantly to electron loss near 80 Km. this assumption is based on a negative ion reaction Model derived from that of LeLevier and Branscomb (1968) in which 0 2 is the dominant negative ion at this height and is destroyed by
associative detatchment with 0 almost as soon as it is formed. He does not seek to explain the abrupt change in positive ion composition at the ledge.
Hunt (1971) has constructed a model based on the reaction scheme of Ferguson and Fehsenfeld (1969) which predicts height variations in H
30
+ and H 0 2
similar to those observed by +
5
Narcisi and Bailey. He does not take diffusion into account. On
the other hand Hesstvedt (1968) and Bowman et al (1970) using H20 and 02 reaction schemes (they ignore ions and NO completely) have shown that ledges in neutral constituent concentration
profiles predicted by multiple reaction schemes are altered but
1.5.3 Ionization by Particle 'Precipitation ,
There is a growing body of evidence that electrons precipitated from the magnetosphere provide a significant source of ionization in the quiet Mid-latitude D-region (O'Brien, -1962; 1964; Q'Brien.and..Laughlin, 1963; Hultquist, 1964; O'Brien et al. , 165;1 Paulikas et al,
Tulinov 1967; Fritz, 1968; Tulinov et al, .1969; Poterrira',and. Zmuda, 1970; Manson and Merry, 1970); Figures are
available for total particle fluxes at energies above 40 KeV and upper limits can be placed on the ionization rates from . this source from N
2 night airglow measurements.
However the spectra of the precipitating electrons 'are more uncertain. Manson and Merry (1970) consider a spectrum with e-folding energy of 15 KeV and particle fluxes of the
3 -2 - 1
order of 5 x 10 cm sec (for E KeV). Such
.4
spectrturr. would create a peak in the ionization rate near 90 Km and a. ledge near 80. Km. Potemra and Zmuda on the other hand consider power law spectra with exponents around 3.3. Such particles would penetrate deep into the D-region, down to 60 KM, without creating any ledges in the production rate profile.Precipitating electrons With spectra slightly softer than that used by Manson and Merry, i. e. with about 5 to 10 KeV e-folding energy, would be capable of giving rise to a ledge in ion pair production rate at similar heights to the one distussed above.
1.6 Relevance to High Latitudes,
It may be asked : what is the relevance of the discussion in this section of mid latitude phenomena when high latitude
fact that nearly all that is known about the D-region is _
known only for mid and low latitudes and must be extrapolated to higher latitudes; many of the processes must be the same. Of greater significance is the possibility that the sudden decrease in cluster ion concentration at 88Km may be brought about by an increase in precipitating electron flux above this altitude and by the increased proportion of N 2 ions' which would be produced. The reactions which lead from the
formation of simple positive ions such as 0 2 and NO to
water cluster ions are not fully understood and thePossibil-ity exists that such reactions might be suppressed or
SECTION 2.
D-region Model
2. 1 Small Perturbations
Hitherto there seems to have been little-discussiori i.n the literature of the response of the ionosphere to small, rapid. perturbations in q, the ion pair production rate. The various proposed negative ion reaction schemes have usually been dealt with under steady-state or quasi steady-state conditions an time rates of change of ion densities have been nearly always equated to zero.
The discovery of c.n. a. pulsations exhibiting a time asymmetry adds a new dimension, a new parameter to our • empirical knowledge of the D-region. Here we have small
perturbations in cosmic noise absorption for which a relaxation time can be read directly from a pen recorder chart. The c.n. a. pulsations observed with fast response riorneters are fast; their rise times vary from 1 to 5 seconds. They are also small, their measured amplitudes are less than .4dB. Superimposed on
backgrounds of greater than .5 dB. of absorption.
To what extent are observed c. n. a. pulsations consistent • with know D-region processes? Can they be utilised as a dia,gnostic
tool to glean additional information about this most complex region of the atmosphere? It is the purpose of this thesis to attempt to answer these questions.
The obvious way to go about this is to construct a
• . ,
which give rise.to unrealistic results can thenbe eliminated
and some of the uncertainties in our estimates.ofD-region-parameters and processes can perhaps be reduced:.:
2.2 .Complete'ReactiOn'SChemes
Any complete reaction scheme would involve one differential equation for each species of positive or negative ion present. Many of these d.e.s. would be non-linear (even for small perturbations) and would need to be
solved numerically. The number of parameters needing to be
varied in order to gain an insight into the dependence of the output pulse on them is likely to be large.
For this reason it seems more reasonable to use a simplified model which includes fewer parameters. A model
was constructed based on the Bates and Massey equations (1.1), as discussed in the previous section. These equations were solved numerically for N as a function of time for a number of discrete heights in the atmosphere using a suitable
driving fUnctionq.7-q
The resulting abSorption, pulse was then computed from N(t) using the Seri-Wyller .(1960)formuIafOrnon-:deViatiVe absorption.
The question now arises: to what extent can the
pulsat-ions in q and N be regarded as small perturbations in that
the rate parameters, a0,y,t5 can be regarded as constant during the course of a Pulsation ? The attachment rate
-coefficient 0 is a property of the atmosphere and predicted
absorption pulses are almost completely independant of-the
value of y used in the model. The electron-ion recombination coefficient and the electron detachment coefficient remains to be discussed.
2.3 Negative
'Ion Reaction Schemes
:
The .Charge 'Transfer: Matrix:::-dNi
dt = K N - rixi - Kb °3 =
P3 x3 -
(m103+ [021 2 )),etc.
where X. is the ratio N.
IN
where N. is the number .density of the ith species and
ri
is the loss 'rate for this spedies: Multiplying each equation by N, the electron density, we have- Kbo3N =0
r2
N2 - 1(30
N3 - K ON5 - Ka(02)2 =0etc.
These equations describe the quasi-steady-state situation. The dynamic situation is arrived at by simply replacing the zeros on the right hand sides by -dNi/dt.
= Ka (02 )2N 1(3
dt
etc.
N3. K50N5
-r
2
NA complete model representing the behaviour of the , ionosphere in the presence of pulses in q would incorporate the
, differential equations appropriate to each ion species,
neutrality condition positive ions.
Since the
r
i
include a recombination term,the equations (2.3) are nonlinear and, in general, would have to be solved numerically. •They can however be written as
matrix equation.
where N1 is here the number density of electrons,
(1 < i Em) is the number density of the i th negative ion species and Oij is the loss rate of the i th species in the
reaction + X —› Nj -
Y'
i.e.
where K-is'the reactiorCi-ate. -.+ •
For small pulses where: changes.irON can be ignored
all the elements of are constant and isaproperty'
of the atmosphere at any height Equation.(0•Can . then be solved for 1. 1\11
The solution is
:and it can be ' form
Here the matrix e B t can be given a precise definition - shown that its elements can be written in the
where the k k are the eigen-values of the matrix i, d(see Apostol (1969),Chapter 7.)
Thus ultimately the negative-ion dynamic behaviour of the "ionosphere depends on the eigen-values of the charge trnasfer matrix
In practice it is scarcely worthwhile computing the eigen-values of ,133 since all of the elements of iBl are not known with any degree of certainty and most are, of course, strongly dependant on height
2.3.2 DetachmentCoefficient Variability
As mentioned in 1.4.2. only. 0, :0 2 and O 3 ions.are , likely to suffer collisional detachment Or photo detachment
at a rate expressed by .equation (1.14). The reaction schemes of Le Levier
and'
E0
2
>>
and Branscomb (1969) and of G. C. Reid (1970) indicate that
at all heights for both day and night equilibrium conditions. Following LeLevier and Branscombt-in (1.15) -
• k 1 = 2 x 10⁻¹⁰ cm3 sec = 1.4 sec. -1
0 -1
k2 = 3.3 x 10 sec. /02 = 0.4
-10 -1.
k3 = 10 ° cm3 sec /0 3 = 0.01
Hence K 2 [0 2
3
is easily the-dominant term in the expression for 61N
-
(1.14).
Hence
=K [0] [
Since the factor K [0] is a property of the atmosphere the way in which 6 varies with time and with q is entirely'
•:dependant on how the ratio
L0 2
7.1IN
.varies_.dependant on the detail of all of the reactions involving negative ions expressed by equation (Z. 4),.above.
with to experience direct detatchment of electrons by collisions atomic oxygen. Let their number density be N'a
Attatclunent - detatchment species, OT and 02
These ions are the only ones likely to be formed by direct
attatchment of electrons to neutral molecules and the major ones
-
ii) Storage species, 03-1 CO 3 and C04 aze. formed directly from 0- and 02- and can be converted back into 0- and 0
2-* Lei their number density be N:s
iii) terminal species, NO2 and NO3 . These are highly stable ions which are only removed by mutual neutralization. Let their number density be Nt.
Let us assume that loss by neutralization is only
significant compared with change interchange processes in the case of electrons and terminal ions.
The system is described by the four differential equations
- ct N+ - 5N + Na
5N - dt
= N - AN - s
dt a
dNt Ns
dt
in matrix form
d- NS "dt
Where =
0
,
0
0 0f)
We have assumed that direct conversion of attachment.
,
to terminal ions is small compared with other' processes.
Equating the derivatives (2.8) through (2.11) to zero
for steady state conditions we find
Thus N
a
/N
-
The variation of•the
.
' ration in (2.13), (2.14),(2.15)
with height in the quiet mid-latitude daytime ionosphere can
oF
be seen in figures (6)and(8) G.' C. Reid's (1970)
PaPer,- .For
small values of
Subs tituting(2.. 13) through( 2. equation
we have
where A and B are independant of q. Thus Nt varies
as the square root or cube root of q. the detatchment coefficient
Thus s will not be al strong function of q for Small quasi equilibrium variations in q.
For the non-steady-state case, where there is a pulse in.. q the time behaviour of N, N, N and N is dependant on the a s t eigen values of the matrix (.13) in equation (2.12). It Can be:
shown that these are real and negative implying that the 'behaviour of the pulse as it passes from one ion species :to another is
2. 4 Recombination Coefficient Variation
The macroscopic electron-ion recombination coefficient, rt,.
is a function of the positive ion composition of the atmosphere l and -a weighted mean of the individual recombination coefficients of each positive ion species. A large coefficient for recombination of electrons with water cluster ions has been postulated in order to account for the anomolously low electron content of the day,tirrie, mid-latitude D-region (see 1.5. 2.). The' question now arises as'to how strongly dependant is the proportion of water cluster ions,,:
and.hence x, on the ion pair Production rate q and on rapid
variations in q.
The rate of formation of cluster ions would be expected to be proportional to the ambient positive ion density at any height. Let KN+ be the rate of formation of cluster ions with narriber .
+
density C from such ions as NO , 02 , N2 with concentration N. Let rtcandaD he the electron-ion recombination coefficients of the cluster ions and of the more slowly reacting ions respectively.
The parameters K, r andaD are perhaps weighted means of
' various reaction rates but this does not greatly affect what foliows. The following equation's describe the Steady state balance of
electrons, cluster' ions and slowly recombining ions.. -positive ions balance
0 =. q
cluster ion balance 0 . ' =
..where r = ry N+ + a C+ )/N. c ,
N< a ac C
where q is the ion pair production rate and N(= N + .+ . 0 ) is the electron density. Attachment processes are ignored for simplicity. Equation (2. 23) can be written:
0 = q (11\1 2
is the effective recombination coefficient. From (2.22) we have
0= K(N-C+ ) - c C+N
= KN c. N) C+
Thus
a+
= KNRK + aeN)and C has a maximum value of Kia however large . the electron C,- ,
density may be. For small electron densities i.e. : for N << KAI C+ N i.e. nearly all the positive ions will be in the form Of water Cluster ions.. '
Substituting (2.25) in (2. 24)•
a =,a (1 - C+ /N) + .rt•
i.e.
thus when
and when
Equation (2.25) can be rewritten K N C+ N(N - =
hence we can estimate K irt .by examination of the ion
species density profiles obtained by Narcisi and Bailey (1965). At 85 Km the only known slowly recombining 'species is NO which makes up about ten per cent of the total positiveion .
content of 6 x 10 cm-3 If we 'assume that all the other species are rapidly recombining we have at 85 km.
rcd = 5x 04 .cm. -3
Similarly at 70 Km K/ = 1.6 x 10⁴ com Electron -3 densities of this order at these heights could give riseto n.
a.
of about 1 dB, e. in the range of the observed absorptionbackground for c. n. a. pulsation events. That is for real events the condition
K/( D N >K/c is likely to
apply, in which case according to equation LZ. 26) (twill be strongly dependant on N and therefore on q.
In a non-steady-state situation (2.2.1), become
dN+
dt dC
dt
dN
dt
+ '+ such intermediate SpeCie,s as:0 , s'.
(Ferguson, 1971). •To a large extent the production Of cluster ions
in the course of a pulse will be decoupled:from the pulse in .N . For fast pulses S • will be almost constant and an increase in N
will result in a negative value of dC /dt, a decrease inC and hence a decrease in CC. If G. C. Reid's high a cluster ion theory is correct rt is likely to be not only strongly q dependant but:alsO time dependant.
For the moment however in order to develop the simple model based on the Bates and Massey rate equationS(L....1 .)...vi will assume that ct, can be regarded as constant
the atmosphere. 'We will return to this topic in experimental results in section 4.
Z. 5 The Ion Pair Production Rate Z. 5.1. The Primary Spectrum
The absorption of cosmic noise by free electrons in the •:
ionosphere is dependant on the collision frequency, the rate at: which electrons lose energy by collisions with neutral moIeCules. The collision frequency is strongly dependant on height. Above 60 Km the absorption of cosmic noise at 32.1-KHz for a given
electron density falls off by 1/e, for each 61 Krri increase in height. Thus in computing the absorption as seen from. the groun.d.
brought about by a pulse of ionizing radiation entering the top of the atmosphere, the height at which the absorbing electrons are created is of crucial importance.
Equations (1.1) are non-linear which implies that the shape of a pulse in N will, in general, depend on the backgroun,d.value
of N itself. Furthermore at least one of the parameters of (1.1), 13 is strongly dependent on the height. These features indicate that the size and shape of a pulse in absorption computed from a pulse in q will be strongly dependent on the height distribution of the pulse in q and on the height distribution of the background ionization profile on whioh the pulse in ci is superimposed.
The association of c. n. a. pulsations with fast bremmstrahling x-ray pulsations and with luminosity pulsations in the IBC 1-2
range (Appendix I) indicates that electrons precipitated from the magnetosphere over quite large regions (Appendix II) are
responsible for pulsations in ion pair production rate, q ( h, t , which in turn yield the observed absorption pulsations.. The height distribution of q ( h a t) will be a function of the energy
spectrum and angular distribution of these dumped electrons. Observation of preCipitating electrons during both active and quiet auroras by means of rocket borne electrostatic
analyzers (Chase, 1970) indicate that their spectrum consists of two parts which are almost unrelated viz. (i) a region fromiKeV to 10 or 20 KeV which is flat during a quiet aurora and develops a strong peak when the aurora becomes active and (ii) an
exponental tail above 20 KeV with an e-folding.energy of from 3 to 5 KeV which, is relatively unchanged during large changes'
in the flux in the low energy component...
Since c. n, a. pulsations or associated phenomena were
not reported during this particular experiment these spectra can in no way be taken as representative of the electrons responsible for c. n..a. pulsations . Since c., n. a. pulsations are. observed largely in the mid-morning hours when the spectra of
Bewersdorff et a1,1967) their e-folding energies maY'be much larger than this. Nevertheless we will adopt thecOncePt 0 a two component spectrum i.e. one that is flat from 1 to KeV with an exponential tail above 10 KeV. The e-folding energy of this tail and the total flux of electrons will be the only variables associated with the spectra used in the model. The precipitating patricles are assumed to be iso-tropic over the downward hemisphere.
2.5.2 Bremmstrahlung Ionization
A number of workers have investigated the transport and energy deposition of electrons in the atmosphere (e g.
Chamberlain, 1961, Rees,1963,1964; Kamiyama,1967; Walt et a 1967; Berger et a1,1970; Catchpoole,1970). Their orientation has been largely towards the computation of auroral luminosity profiles and intensity ratios. At the time of commencing this project only Fees (1964). and Kamiyama (1967) had paid much attention to ,ion-pair production below 80 Km where photo-ionization of airby the bremmstrahlung x-rays created by the precipitating electrons becomes predominant. Both of
these authors' computed iOnization profiles for an exponential spectrum of primary electrons with e-folding energy of 5
kaw
and their results should be directly comparable (i.e. compare Fig.5(b) of Rees (1964) and Fig. 4 of Kamiyama (1967).Unfortunately their profiles for bremmstrahlung ionization are quite different. Kamiyama's profile has a peak at 90 Km while- that of Rees peaks at 50 Km. This may be explicable
in that Rees uses a spectrum of the form
f (E ) dE o —E. exp (- 0 /a) dE 0
while Kamiyama's has the form
f( £ 0)d E 0 exp (- E 0/a) .d E 0
we are concerned here with pulses. The equations (1.1) imply- that for sufficiently short pulses in with arn.plitudeAq , the corresponding s, increase in electron densityANrnay be approximated by'
r
q dt q At— o
Despite this, the two spectra should yield similar .
bremmstrahlung ionization rates deep in the atmosphere Whence only the higher energy x-rays can penetrate because of the high photoelectric absorption cross-section of air below 10 KeV.. At a height of 50 Km Rees predicts an ionization rate three orders of magnitude less than the peak rate due to impact ionization while Kamiyama predicts a bremmstrahlung ionization rate a this height which is six orders of magnitude less than his impact
:ionization peak.
This discrepancy in estimates of bremmstrahlung ion pair production rates at 50 Km is of some significance. For a 'given electron density, N, the absorption of cosmic noise,at 32 MHz is about three orders of magnitude greater at 50 Km than at 105 Km where the impact ionization maxima lie. Thus if the electron density were to be proportional to ion pair production rate the situation described by Rees would imply a degree of cosmic noise absorption at 50 Km greater than that at 105 Km due to impact ionization, while Kamiyama's curves imply a degree of c. n. a. due to bremmstrahlung which is n.egligably small. For Steady state conditions the electron density is certainly,nOtproportional to the ion pair production rate since we have
etp
Thus for transient phenomena there is a degree of proportionality holding between N and q which makes the discrepancy between the bremmstrahlung ion-pair production rates of Rees and of Kamiyama of utmost importance. If the former is correct the bulk of cosmic noise absorption
occurring during a pulse of 5 Key primaries takes place at a height of about 50 Km, while if the latter's profile is correct, for the same conditions the bulk of the pulse absorption will occur at over 100 Km in height.
Neither Rees nor Kamiyama take multiple compton
scattering into account and both treat the compton scattering cross-section as if it were a simple absorption cross-section.
For these reasons the ionization rate profiles produced by a variety of precipitating electron spectra were calcul-ated afresh taking multiple compton scattered bremmstrahlung into account. The computor program for doing this is descr ibed in Appendix IV. The resulting 5 KeV profile resembles Kamiyama's profile much more closely than that of Rees at lower heights.
The impact ionization part of the profiles were
computed in a similar manner to those of Rees (1963). The height distribution of ion-pair production rate produced by spectra with e-folding energies of 5,10 20 40 and
80
KeV are shown in Fig. 2.1.5 10
20 40 _ 80
1 II 1 1111 1 1 •1..4.4.1•1
1 1 1 1111 •
Fig. 2.1.
Ion - pair production rates calculated for unit fluxes of electrons in the energy range 1 keV to . 510.8k6V incident on the top of the atmosphere. Each flux was taken as isotropic over the downward hemisphere and as
having-a.
differential energy spectrum flat from 1 to 10 keV . and falling off exponentially with increasing energy 'forand should have been written
Ph (k) dk = f omax
D(so'
Eomin
since the cross-sections (E,,k) is given in Table 1 of the paper and computed from the empirical formulae of Kirkpatrick and Weidmann(1945) must be differential energy cross-sections not number cross-sections which diverge at zero. The
bremmstrahlung flux computed using the energy cross-section incorrectly in this way will be spuriously high at highe energies yielding a much greater degree of ionization much lower down in the atmosphere than would otherwise be the case.
2.5.3 Some Reservations
The assumptions made about ., the nature of the precip-itating particle spectra and pitch angle distributions
should not perhaps, be taken too seriously. The complexity and wide variability of spectra and pitch angle distribut-ions observed in actual precipitation events have been demonstrated by O'Brien and Reasoner (1971). Discrepancies between predicted and observed ion pair production rates, as measured with rocket borne instruments, have been ,observed by Ulwick et al (1967) and attributed by them to the effects of auroral electric fields on the range of precipitatin
particles. Catchpoole (1970) has demonstrated that quite small electric fields parallel to 13 can have a significant effect on depths of penetration, particularly for the lower energy particles. Nevertheless some assumptions must be
made; the e-folding energies associated with the rate profiles of Fig. 2.1 can, at worst, be regarded merely as numbers
2.6 The Computor Model
A computor program was written in Elliot 503 Algol to solve equations (1.1) numerically for N, for a pulse in q at various heights in the atmosphere from 50 to 160 Km for an assortment of values at the parameters
a, f,
y and 6, and then to evaluate the resulting riometer absorption as a function of time Since the equations are non-linear and the observed pulses are superimposed on a relativelysteady background of absorption, some sort
ofsteady
back-ground must be incorporated into the =del. The imizEmicm rate profile q(h,t) was taken .asq(h,t) 7 q0(h) aq(h) p(t)
where h
iS
the height in the ionosphere in Km., t is the time in seconds,q is the rate of background ionization, r due to electromagnetic radiation and to cosmic rays,
Fb is the flux at
the top
of the atmosphere the steady background of Primary electrons with e-folding energy Eob,q(h,E0b0 in the ion pair Production rate at height h, due to incident, electron flux at the top of the atmosphere with e-folding energy ;313,
F is the peak top-of-the-atmosphere flux pulse of primary electrons with e-folding energy Eop,
p(t) is a function which describes the time variation: of the pulse in primary, electron precipitation and, provided it is symmetric and almost zero outside a certain range of t its shape is fairly arbitrary. For computing reasons, the following' function was Used:
1.111111
13(t) - o.111111
2 2
1 w t
when
and p(t) = 0 when Iti 31w
where l/w approximates the half width at half maximPm of the pulse in seconds.
The qr profile of Ogawa and Tohmatsu,(1966) to represent night conditions and the (low NO) profile of Mitra (1968) t
:
represent daytime conditions at intermediate heights. - The daytime profile of Watanabe and Hinteregger (1962)'was used above 110 Km and Webbers (1961) cosmic ray ipnization profile was used below 70 Km. For some runs the (high NO) profile of G. C. Reid (1970) was used at intermediate heights. It turns out that for even moderate absorption events i.e. for quite small values of Fb ' the q profile has very little effect on the r predicted pulse shapes and amplitudes.
Programming q in the fo'rrn (2.32) made it possible examine the situation where pulses of precipitating electrons
the steady-state cosmic noise absorption after subtraction Of the qr component was equal to a predetermined level. This level of background c. n. a. was intended to typify that of the SVIA events during which c. n. a. _pulsations are observed: It was usually chosen to be either .5 dB or 2.0 dB of absorption.
For each run a qo (h) profile corresponding to particular values of Eob ' Fb and q ( h) was specified together with values of a , , y and 6. The parameter 0. was taken as 1.6 x 10⁻³°
t
°2]2 icm73, sec:1 throughout. The parameters.a
and 6., usually height independant Were,: for some runs Made functions of height utilizing an Algol edit facility to insert . suitable procedures. The parameter F was varied for each successive integration across three or four orders of magnitude,. so as to adequately span the . range in which realistic absorption pulse amplitudes reSulted.. This was done for values ofcorresponding to each of the five profiles shown in Fig..2.2.. (These profiles were also used to determine q (h, E ) of coUrse).
Equations (1.1) were integrated over a 10 'second iriterva using a fourth order Runge-Kutta process.whidh.has the
advantage of either converging satisfactorily or diverging rapidly when it does diverge. A step length of 0.1 sec was usually
sufficiently small. The integration Was carried out for heights between 50 and 160 Km, the height being incremented in 2'Kria steps. The variation in behaviour of equations (1.1) between'„ one value of h and the next was sufficiently small for the
integration at one height to serve as a check on its neighbours against divergence and round-off errors.
At each height the absorption resulting from the computed electron density was calculated at 0.1 sec intervals using the
expression for longitudinal propogation of. Sen and Wyller (1960).
using this expression for propagation paths which are not parallel to the magnetic field will be less than four per cent for three of the four antenna orientations used at Macquarie Island in 1969. Since the cosmic noise is randomly polarized and since the gyrofrequency is small compared with the operating frequency of 32MHz we may also safely ignore the gyrofrequency term in the Sen-Wyller expression. Thus the absorption in dB,a(h,t) at f MHz which takes-place in a 2 Km slab in which the electron density is N(h,t)cm -3 , and the collision frequency
(h)sec. -1 will be given by
.1153 x 10 6 (.11)
C5(77)7(H)
f -
The function
C5/2(c) =-r(7/2) - 4a E5
is tabulated by Dingle, Arndt and Roy(1957). The collision frequency was taken as
v(h) = 108 exp (50-h)/6.47
which fits reasonably well the observations of Kane(1960) and Phelps and Pack(1959).
The absorption values computed for each value of h and t in this way were summed over the entire height range and the background absorption subtracted to yield the absorption
pulse, a(t), which would be observed by a fast response
riometer.
Curves of "specific absorption" i.e. of the function .1153 x 10 6
(h) =
>' (h) '5 C (dBKm -1 /(elect
"/2 ° are given by Lerfald et a
(1969).
The background absorption, A o , isgivenI by
Ao
N (h)
p.(h) dh 2.38)where No is the steady background of electron
'denSit
Equation (1.9) . was solved l'or:k.which:wassubStitUt .e
'(1.8) toobtainNo (h). :'.- The:.Value-
OfHqusedgiven by the term
in parenthesis in (2.32)..
The computed absorption pulsea(t) was thus
anapproximation
to the functibng(t) where .'a ( )
SECTION 3
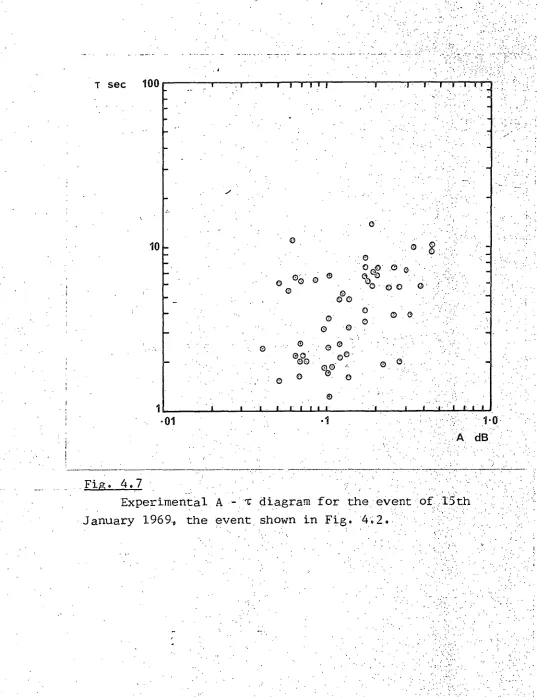
C. N: A. Pulsations - Model Prediction's 3. 1 The A-t. Diagram
3. 1. 1 Rationale
The integration of equations (1. 1) was carried out in. the , manner described in the previous section. There are a
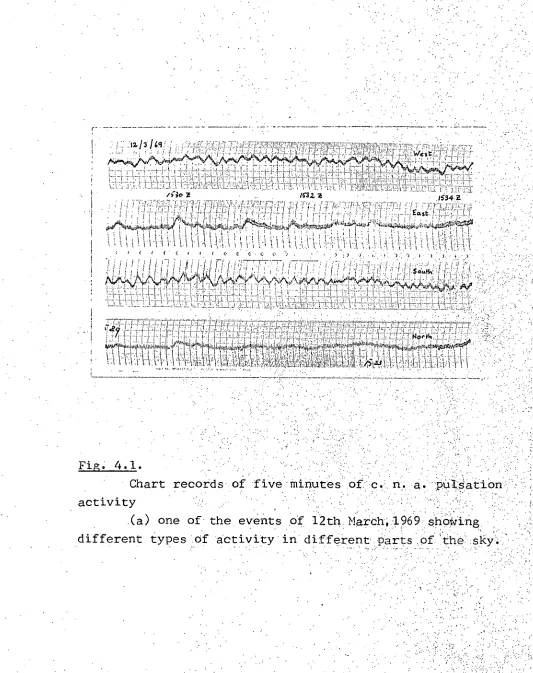
considerable number of Possible combinations Of parameters Which were used, leading to an almost unmanageable number of predicted absorption pulsations. Some of these are shown in Fig. 44:
for comparison with observed c. n. a. pulsations. It can be seen that the pulsations obtained from different combinations of
parameters are quite similar in appearance; the only features , , which vary to any extent and the .amplitude of the pulsation aid the slope of the relaxation part of the pulsation. The
characteristics Of the pulsations obtained by integrating (1: 1) can, : then, be surn.marised and displayed•in terms of two 'quantities:
If the .equations (1. 1) were linear the shape of the absorption pulse would be independant of its magnitude. Large• pulses would have proportionately steeper slopes. Where the pulse in q is
short compared with the decay time, the shape of the relaxation part of the absorption pulse would be exponentialand a time - constant could be calculated by merely dividing the relative absorption a(t) at tithe t by the negative slope at that time
= -a(t) /
L. (t)
a(t) i,. e.
(3:1
:
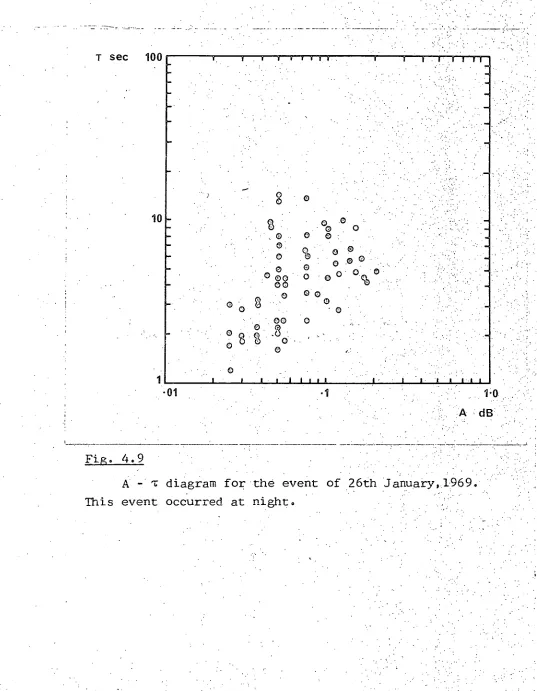
In practice the observed pulses are usually too noisy, to make detailed measurements Worthwhile and it is simpler' td define a "relaxation time", 't , as
i.e. the amplitude of the pulse above . background, A, divided by the maximum slope. T has the advantage of being a
quantity which is.independant of system sensitivity.
Owing to the non-linear terms aNN and N_ N+. in (1.1 T will only be constant with pulse amplitude for small perturbations. in N and will decrease with increases in N.- and hence in A. The most convenient way of summarising the characteristics of both the predicted and observed c.n.a. pulsations is to plot relaxation time, T, versus pulse
amplitude, A. Of particular interest in the theoretical case are the graphs of vs. A for
(i) Pulse precipitation spectra of constant e-folding energy and varying top-of-the-atmosphere flux(i:e. constant E and varying F in (2.31).) op
and (ii) pulse precipitation spectra of constant flux and varying precipitation energy (i.e.constant Fp and varying E in (2.31)). op
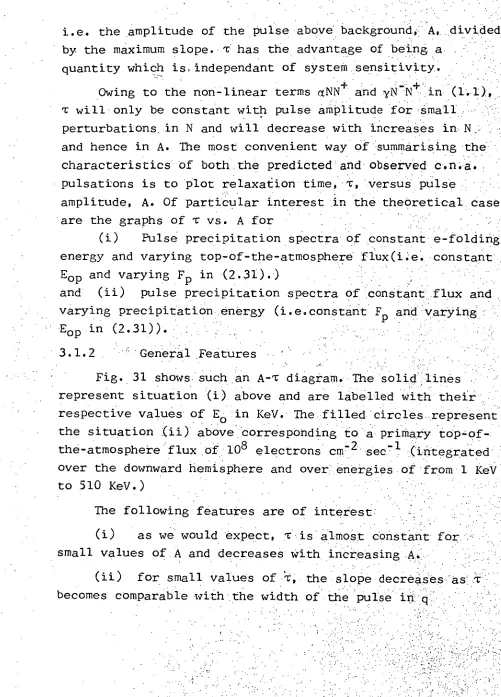
[image:50.549.38.539.13.710.2]3.1.2 General Features
Fig. 31 shows such an A-T diagram. The solid . lines represent situation (i) above and are labelled with their respective values of E0 in KeV. The filled circles represent the situation (ii) above corresponding to a primary top of -the-atmosphere flux of 10 8 electrons cm- sec2 - . 1 (integrated over the downward hemisphere and over energies of from 'l KeV to 510 Key.)
The following features are of interest
(i) as we would expect, is almost constant for
small values of A and decreases with increasing
A,
iii) in the region of interest i. e. between. 04 and .0.4 dB T is almost independant of A i.e. the equations can in fact be
regarded as linear,
) for constant flux, pulse.absorption A increases With - increasing e-folding energy, as the More energetic spectra . create more secondaries and create them lower doWn in:the . .,=atmosphere where the collision frequency is; higher..
v), for constant flux, increases and then decreases.With increasing e-folding energy. As the primaries become:
penetrating they achieve atmospheric depths.of increasingly longer relaxation time until a turnOver point is reached and
This subject. relaxation time decreases with decreasing height.
will be discussed further in section 3.2
3. 1.3 Effect of Background
Comparison of Figs. 3. 1., 3. ,and 3.3 reveals the effect of absorption background on the A curves. ' The 80 Key curve . is almost unaffected while the effect of background variation
on the softer spectrum curves is quite large.
-c is reduced by a factor of about 5 as the baCkground increased from zero to 0.5 dB and by a factor of:about 2.5 as it increases from 0.5 to 2.0 dB. Most of the observed
e.
pulsation are superimposed on backgrounds which lie in the • latter range.
Only the relaxation time is affected; A/F , the
01 01 1.0
Fig. 3.1.
A-T diagram for c.n.a. following parameters:
recombination coefficient, attachment coefficient,
ion-ion recombination coeff. detachment coefficient
e-folding energy of background event background absorption
= 2 x 10 - cm3 .sec - 7
-3 -1
0 =1.6 x 10 m2 sec "
3 -1
y = 10 cm .sec .) -1
6 = 0.4 sec •) 5 k.eV., Eob =
Ao = 0 dB.
The curves are labelled with the e-foldink.energy of the pulse spectrum,E0p.The filled circles indicate the.
-8 - -1
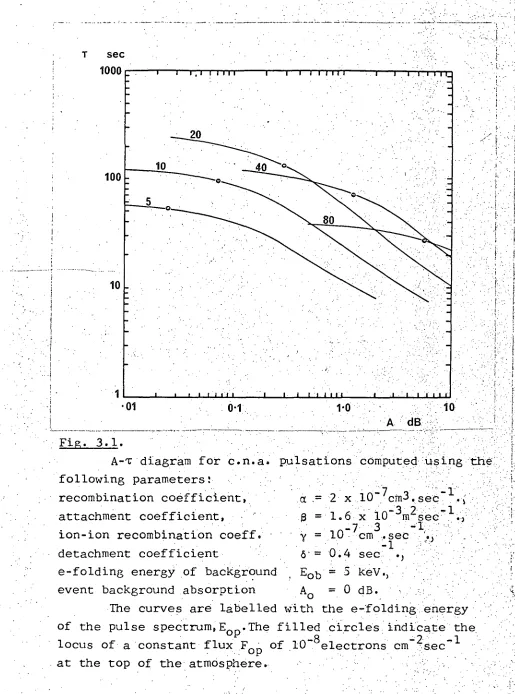
01
Fig. 3.2.
As for figure
• background,A 0 = 0.5dB
a = 2 x 10 -7
0 = 1.6 x 10 -3° m 2
y = 10-7
T sec
Fig. 3.3
01
.Fig. 3.4
Fig. 3.5.
Computed A - T diagram showing the effect of a height
•• •
dependant a, i.e.
= 5 x 10 -7 for h > 87 km. a = 5 x 10 -5 for h < 87 km.
T sec
Computed A-T diagram showing the effect of a harder background spectrum (E = 20 key) and a dissociation co-
efficient, -
efficient, 8, which is a function of height.. Parameters are • -7
a =
s
x
10 above 87 Km• a = 5 x 10⁻⁵ below 87 Km = 1.6 x 10⁻³⁰ m2
= 10-7
• = 10 [0 2 [ N- ]
where {0 21 and [N1 ae. the concent‘ration of 0.. .
and of • ' negative ion respectively and are taken from G. C. Reid 1970. Eob = 20 keV.
T sec 1000
10
1 01
• 0.1
Fig. 3.7
affect the absorption-flux sensitivity are the e'-folding energy of the spectrum (i. e the shape of the q (h) profile) and the' half width of the pulse..
3.1.4 Effect of changes in and :o
Figures 3.2, 3.4 and 3.5 show the effect that variations in a; have on the A - T :curves. Increasing ct by an order bf magnitude decreases "C by a:factor of 3 or 4 for soft parent
spectra but does not greatly affect the curves for harder
parent spectra. If a. is made a function of height in a manner which approximates Reid)s (1970) profile of a' then the
resulting curves are quite complicated (Fig. 3.5). Note i;
there is a considerable reduction in the spread in S which now only varies between about 7 and 14 seconds for a wide spread in parent spectral hardness: Fig. 36 shows what happens when the background spectrum e .-folding energy is increased from 5 KeV to 20 KeV and the detatchment coefficient is made a. function of height in accordance with a colliSional detatch.Ment ' model of the atmosphere. The relaxation time has become a decreasing function of spectral hardness and the spread in is still small.
An A - T diagram for nighttime conditions when
collisonal and photodetatchi-nent are almost inoperative is shown in Fig. 3.7 for which 6i,was taken as zero. Comparison with Fig. 3.2 reveals that, this time, the soft parent spectra curves are unaffectedbut the harder spectra curves have been lowered.
T has been reduced by a factor of 3 for the "80 K V" curve. 3. 1. 5 Effect of other Parameters
;-
production rate, i. e. whether a high or low snitric oxide profile is used. It was found that an order of magnitude increase'in from 10 -7 to 10 -6 Cm 3 sec-1 caused at most a fiVe per cent' increase, in ¶,, while changing the background radiative
ionization component, q (h) , from a low to a high nitric oxide profile had no discernible effect on the relaxation times of pulses
superimposed on 'a .5 dB background.
Before we can discuss these features of the A - diagrams further we need to devise an approximation formula for the
relaxation time.
3.2 An Approximation Formula for 3.2.1. Existing Formulas
The numerical integration of equation 1.1 for small short , pulses in q makes it possible to check the validity of the various
approximation formulae for 'r which have appeared in the literature.
Appleton (1953) derived the expression •
e- 1/2qN (3.3
whereat is the lag between the pulse in electron density N and the pulse in ion pair production rate q. The formula 'Which is usually used to estimate Tis
1
T
2 a N elf
or = •
eff N•
wherect ef .s the effective recombination cpefficient"J .
a + Xy )
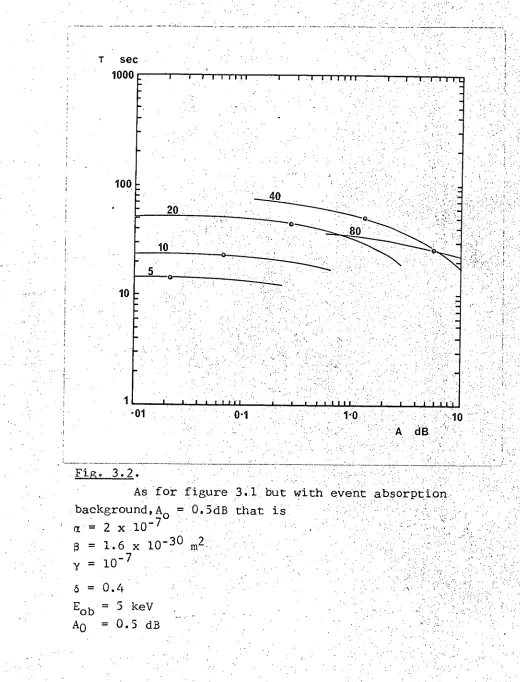
Relaxation time as 'a furiCtibri of height for a sr-hall Pulse
" • can be obtained directly from the CornputOr program used to compute the a - ¶ diagrams of .Figures 3. 1: to 3. 7: : In practice.: the background conditions and parameter valiies:pertainink.•id: '
[image:61.548.15.548.0.715.2]. ,
Fig. 3.2 were used and the q- pulse used was
that
•Corres4Oiiding':7 •;-2
to a peak flux of 10 electrons . cm 'sec at the top of the
atmosphere with spectral e-folding energy of 80 keV.' The relaxation time at any height was taken as
T(h) = . - N(t)) /( d dNt L0 -
by analogy with equation (3. 1). Here
4,
N is the .variable . component of the pulse in N and to was taken „as thedN was a maxi
-- mum.
• dt
Fig. 3. 8 shows the profile of T(h) obtained in this Wa (circles) compared with the profile of T using equation (3'. 5):
•
Values of background electron density, N, and negative ion- , o electron ratio X used to derive the latter are also shown.
3. 2. 2' Unwarranted Approximation
It is obvious that the expression in 3. 5 for T is quite :
inadequate. The maximum Value occurs 20 Km too low and is more than an order of magnitude too large.
The reason for this inadequacy is the inaccuracy of an approximation often used in connection with the rate equations (1. 1) . The substitution X = N IN is made and the equations become
.... ...
... ... ...
Fig. 3.8
A comparison of pulse. relaxation .time, T, a function
of height derived during the integration of the rate equations
(1.1)
(circles) and that calculated: from the currently
accepted approximation formula
= 1/2 et;
ff
. N
.
(continuous
Km
As for Fig. 3.8 but-tusing the improved formu a for Ty viz:
T = I/ 't(le N+0) ie-ate •
^, I/ (2 a N o 4- •34)
The approximation is then made
dX
0 dt
and the last term is dropped from the equation for dN/cit.
small pulses where N is almost constant', the coefficient of N,
(a, +Xy ) N, will determine the time constant.
However numerical integration of a pulse under the
conditions outlined above reveals that dX/dt has a value' at
-1 -1
70 Km which varies between -.14 sec and ,.+077 sec
during the course of the pulse. Since the background vajties. of N and•
at this height are 540 cm-3 and .127 cm sec -3 respectively
term N(dX/dt)'. is certainly not small_compared witb::cf,r and the approximation is by no means valid.
3.2.3 A Height Profile of Relaxation Time
In order to arrive at a, better formula fort let us consider
what happens after the cessation of a pulse when .q has resumed
its background, value of q. Let N , N N be the background o o
(steady state) values of electron, negative ion and positive ion
density respectively. Consider the "relative slope", tu, -the
•reciproCalof . T,: at time:t.o . when q 0 0
dN
= .(aNN+ ON - - 6N 7 ' go )146IN
t
(riNN+• •I\I :7 6N-) - (alloNo+- + rt(NN+7 NE741
-
1_
, .201. • AN:
•
•Ehe,