Effects of Geometry Variations on the Performance of Podded
Propulsors
Mohammed F. Islam,
(SM), Brian Veitch,
(M), Susan Molloy,
(SM), Neil Bose,
(FL), and Pengfei Liu,
(M)This paper presents results and analyses of an experimental study into the effe cts of geometric parameters on the propulsive characteristics of puller and pusher podded propulsors in straight course open water conditions. Five geometric parameters were chosen for the current study and a design of experiment technique was used to desi gn a series of 16 pods that combined the parameters. Tests on the 16 different pod -strut-propeller combinations in puller and pusher configurations were completed using a custom designed podded propeller test rig. The dynamometry consisted of a six-component global dynamometer and a three -six-component pod dynamometer. The test rig was used to measure the thrust and torque of the propellers, and forces and moments on the whole unit in the three orthogonal directions. The design of experiment analysis technique was then used to identify the most significant geometric parameters and interaction of parameters that affect propeller thrust, torque and efficiency as well as unit thrust and efficiency in both the puller and pusher configurations. An uncertainty analysi s of the measurements is also presented.
KEY WORDS:
Podded propulsors; puller and pusher propulsors; pod geometry variation; propulsive performance; design of experiments;INTRODUCTION
Podded propulsors have become attractive to the cruise, ferry and other shipping sectors. The geometry variations of the pod that encases the motor and shaft of a podded propulsor have been guided primarily by the size of available motors. In their study on podded propulsor optimization, Goubault and Pérrée (2004) concluded that the pod motor parameters are not as influential on the hydrodynamic performance as the geometric parameters. This emphasizes the need for further research on pod-strut shape to better understand the effect of geometry on
podded propulsors’ hydrodynamic performance. Karafiath and Lyons (1998) presented a study on the effect of pod geometry on the performance of podded propulsors. Pod length and strut position were varied using four pods to study their effects on pod drag and pod-propeller interactions.
As motor design becomes more flexible, the relationship between various geometric parameters and performance becomes an important design consideration. The determination of the geometric parameters needs to be supported by detailed investigations into their individual and their combined (interaction) effects on the hydrodynamic performance of the propulsor. There are a number of geometric parameters that can be used to optimize the design of a pod and five were chosen for the current study, specifi cally, pod diameter, pod length and taper length, strut distance from the propeller plane, and propeller hub taper angle. Our study focuses on the effects of geometry variations on the hydrodynamic performance of both puller and pusher podded propulsors. I t is important to study the performance of pusher and puller propulsors separately because of the necessary different flow conditions involved.
This research program on podded propellers is being undertaken jointly by the Ocean Engineering Research Centr e (OERC) at
Memorial University of Newfoundland (MUN) and the National
Research Council’s Institute for Ocean Technology (IOT), with
the support of Oceanic Consulting Corporation, and Thordon Bearings Ltd. The program combines parallel developments in numerical prediction methods and experimental evaluation. Amongst the hydrodynamic issues that have been identified are questions regarding the effects of hub taper angle (Islam, 2004; Islam et al., 2004; Islam et al., 2005; Taylor et al., 2005 and Taylor, 2005), pod-strut configuration (Islam, 2004 and Taylor, 2005), pod-strut interactions (He et al., 2005a and He et al., 2005b), gap pressure (MacNeill et al., 2004), and pod-strut
geometry (Molloy et al., 2005) on podded propeller
performance.
THE GEOMETRIC SERIES AND
EXPERIMENTAL APPARATUS
Fig. 1. Geometric parameters used to define pod -strut geometry.
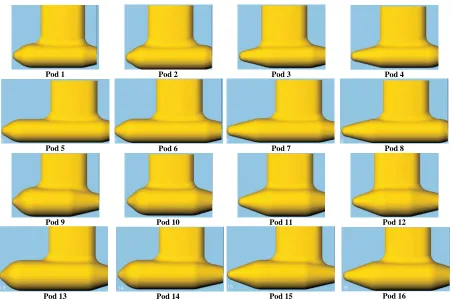
[image:2.612.39.290.41.203.2]For the research work, 16 combinations of dimensions were designed and manufactured as listed in Table 2. The pod combinations were selected to include one combination with all dimensions low and one wi th all dimensions high, denoted as Pod 1 and Pod 16. The list of symbols of the parameters used in the paper is shown in Table 2. The physical models of the 16 pods tested in the geometric series are shown in Fig. 2.
Table 1. High and low values of the g eometric parameters of the pod models.
External Dimensions of
Model Pod
Avg. Values
mm
Low Values
mm
High Values
mm
Propeller Diameter, DProp
270 270 270
Pod Diameter, DPod 139 128 166
Pod Length, LPod 430 430 524
Strut Distance, SDist 100 75 133
Taper Length, TL 110 69 150
Hub Angle, HAngle 15° & 20° 15° 20°
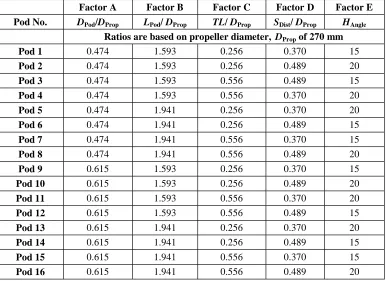
Table 2. Combinations of dimensions of the 16 pods (used in fractional factorial design). Here, A is the ratio of pod diameter to propeller diameter, DPod/DProp, B is the ratio of pod length to propeller diameter, LPod/DProp, C is the ratio of pod taper length to propeller
diameter, TL/DProp, D is the ratio of strut distance to propeller diameter, SDist/DProp, and E is the propeller hub taper angle, HAngle.
Factor A Factor B Factor C Factor D Factor E
Pod No. DPod/DProp LPod/ DProp TL/ DProp SDist/ DProp HAngle
Ratios are based on propeller diameter, DProp of 270 mm
Pod 1 0.474 1.593 0.256 0.370 15
Pod 2 0.474 1.593 0.256 0.489 20
Pod 3 0.474 1.593 0.556 0.489 15
Pod 4 0.474 1.593 0.556 0.370 20
Pod 5 0.474 1.941 0.256 0.370 20
Pod 6 0.474 1.941 0.256 0.489 15
Pod 7 0.474 1.941 0.556 0.370 15
Pod 8 0.474 1.941 0.556 0.489 20
Pod 9 0.615 1.593 0.256 0.370 15
Pod 10 0.615 1.593 0.256 0.489 20
Pod 11 0.615 1.593 0.556 0.370 20
Pod 12 0.615 1.593 0.556 0.489 15
Pod 13 0.615 1.941 0.256 0.370 20
Pod 14 0.615 1.941 0.256 0.489 15
Pod 15 0.615 1.941 0.556 0.370 15
Pod 16 0.615 1.941 0.556 0.489 20
The pod series tests used a fractional factorial design technique, a method of experimentation used to examine the effects of single parameters and interactions between parameters for multifactor experiments. In factorial experiment designs, a factor is a major independent variable. In this method, the
[image:2.612.115.501.368.649.2]experimentation simpler. Some factors or interaction factors are aliased with each other and cannot be differentiated (Montgomery, 2005). The details of the factorial effect aliases in our test series design can be found in (Islam , 2004). The factorial analysis was used to determine which geometric
parameters of a pod-strut-propeller have the most significant effect on the measured performance values (of propeller and unit thrust, propeller torque, propeller and unit efficiency) i n an open water propulsion unit test in puller and pusher configurations.
Pod 1 Pod 2 Pod 3 Pod 4
Pod 5 Pod 6 Pod 7 Pod 8
Pod 9 Pod 10 Pod 11 Pod 12
[image:3.612.82.535.101.400.2]Pod 13 Pod 14 Pod 15 Pod 16
Fig. 2. Geometric models of the pod se ries used in the experiments.
The open water tests of the 16 pods were performed in accordance with the ITTC recommended procedure (2002a) and the description provided in Mewis (2001). A custom-designed dynamometer system was used to measure propeller th rust, torque and unit thrust of the pod series in both puller and pusher configurations. A motor was fitted above the propeller boat to drive the propeller via a belt system. The center of the propeller shaft was 1.5DProp below the water surface. The par t of the shaft
above the strut went through the boat. The propeller boat stayed 3 to 5 mm above the water surface to avoid waves caused by the strut piercing the surface. Water temperature, carriage speed, VA,
and the rotational speed of the propeller, n, were measured. Details of the experimental apparatus can be found in MacNeill et al. (2004).
RESULTS AND ANALYSIS
The dynamometer system measured propeller and pod forces and moments as follows: propeller thrust at the propeller end (TProp), propeller thrust at the pod end (TPod), propeller torque
(Q), unit longitudinal force ( TUnit or FX), unit transverse force
(FY) and unit vertical force ( FZ). Two thrust load cells were used
to measure propeller thrust at the two ends of the propeller shaft (TProp and TPod). The difference between the two measurements
was insignificant taking into account the uncertainty in the system. In the current paper, only the propeller thrust at the
propeller end (TProp) is presented. The experimental results were
analyzed in terms of propeller thrust coefficient, KTProp, propeller
torque coefficient, 10KQ, propulsive efficiency,ŋProp, unit thrust
coefficient, KTUnit, and unit efficiency, ŋUnit, all versus propeller
advance coefficient, J. KTProp, KQ,ŋProp, KTUnit,ŋUnit and J are
defined in equations 1-6, respectively. Additional experiments were conducted to study Reynolds Number effects on the puller
and pusher propulsors’ performance (Islam, 2006a). The study
showed that the Reynolds Number effects became negligible at rotational speeds of 11 (equivalent to Re=6.50×10⁵) and above, as both the propeller thrust and unit thrust stabilized at that rotational speed for all advance coefficient values. In all of the tests for pod geometry effects, a constant shaft rotational speed of 11 rps was used. Equations 1 to 6 were used to present the measurements.
2 4
PropProp T / n D
KT (1)
n2D5
/ Q
KQ (2)
J
/
2
K
TProp/
K
Q
Prop
(3)
2 4
unit unit
T
/
n
D
K
T
(4)
J
/
2
K
TUnit/
K
Q
Unit
(5)
nD
V
EXPERIMENTAL RESULTS
Pod Series in Puller Configuration
The propeller thrust coefficient, KTProp, propeller torque
coefficient, 10KQ and propulsive efficiency,ŋProp values for each
of the 16 pods in the puller pod series experiments (in the range of J=0.0~1.20) are presented in Figs. 3, 4 and 5, respectively. The tests were conducted at 17 different advance coefficients with repeated tests at 4 advance coefficie nts. Tables 1 and A-2 present the KTProp and 10KQ values, respectively, for the pods
in puller configuration.
With reference to the Figures, for the puller propulsors in the series, the KTProp values at J = 0 of the 16 pods ranged from
0.464-0.495, an approximately 7% spread based on the lowest
KTProp given by pod 15. At J = 0.8, the KTProp values covered
0.152-0.179 (approximately 17% spread based on the lowest
KTProp). At J=0.8, the highest KTProp was given by pod 16 and the
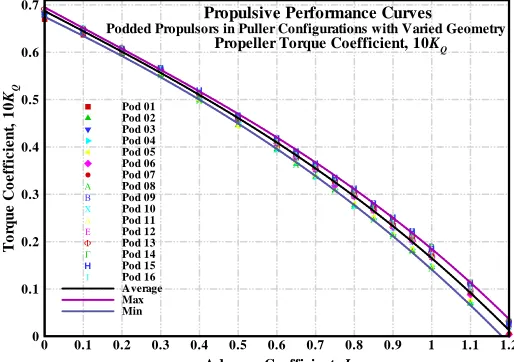
lowest KTProp was given by pod 3. The torque coefficient (10 KQ)
values of the different pods ranged from 0.679 -0.692 (approximately 2% spread based on the lowest 10 KQ given by
pod 3) at J = 0 and 0.275-0.312 (approximately 14% spread based on the lowest 10 KQ given by pod 4) at J = 0.8. TheŋProp
values of the different pods ranged from 0.647 -0.753 at J = 0.8 and 0.625-0.824 at J = 1.0. The trends showed that for puller configuration propulsors, there was significant variation in
KTProp, 10KQ and ŋProp values with the change of the geometric
parameters. At J=0, the thrust coefficients of the pods 1, 3, 6, 7, 12, 14, 15 were lower than those of pod 9 and the thrust coefficients of the remaining pods were higher than those of pod 9. At J=0.8, the propulsive efficiencies of the pods 1, 3, 6, 7, 1 2, 14, 15 were lower than those of pod 9 and the propulsive efficiencies of the remaining pods were higher than those of pod 9. This indicated that the efficiency of the propeller attached to pod 9 was approximately the average of all the other pods. Among the pods, pod 3 had the lowest efficiency (ŋProp =0.647)
and pod 16 had the highest efficiency (ŋProp =0.753) at the
design advance coefficient of J=0.8.
H H H H H H H H H H H H H H H H
Advance Coefficinet, J
P ro p e ll e r T h ru st C o e ff ic ie n t, KT P ro p
0 0.1 0.2 0.3 0.4 0.5 0.6 0.7 0.8 0.9 1 1.1 1.2
0 0.1 0.2 0.3 0.4 0.5 Pod 01 Pod 02 Pod 03 Pod 04 Pod 05 Pod 06 Pod 07 Pod 08 Pod 09 Pod 10 Pod 11 Pod 12 Pod 13 Pod 14 Pod 15 Pod 16 Average Max Min H
Propulsive Performance Curves
Podded Propulsors in Puller Configurations with Varied Geometry
[image:4.612.319.576.40.221.2]Propeller Thrust Coefficient, KTProp
Fig. 3. Experimental results: Propeller thrust coefficient of all 16 puller pods in the series.
H H H H H H H H H H H H H H H H H
Advance Coefficinet, J
T o rq u e C o e ff ic ie n t, 1 0 KQ
0 0.1 0.2 0.3 0.4 0.5 0.6 0.7 0.8 0.9 1 1.1 1.2
0 0.1 0.2 0.3 0.4 0.5 0.6 0.7 Pod 01 Pod 02 Pod 03 Pod 04 Pod 05 Pod 06 Pod 07 Pod 08 Pod 09 Pod 10 Pod 11 Pod 12 Pod 13 Pod 14 Pod 15 Pod 16 Average Max Min H
Propulsive Performance Curves
Podded Propulsors in Puller Configurations with Varied Geometry
[image:4.612.318.578.194.425.2]Propeller Torque Coefficient, 10KQ
Fig. 4. Experimental results: Torque coefficient of all 16 puller pods in the series.
H H H H H H H H H H H H H H H
Advance Coefficinet, J
P ro p u ls iv e E ff ic ie n c y ,
Pro
p
0.1 0.2 0.3 0.4 0.5 0.6 0.7 0.8 0.9 1 1.1 1.2
0.1 0.2 0.3 0.4 0.5 0.6 0.7 0.8 0.9 Pod 01 Pod 02 Pod 03 Pod 04 Pod 05 Pod 06 Pod 07 Pod 08 Pod 09 Pod 10 Pod 11 Pod 12 Pod 13 Pod 14 Pod 15 Pod 16 Average Max Min H
Propulsive Performance Curves
Podded Propulsors in Puller Configurations with Varied Geometry
Propulsive Efficiency,Prop
Fig. 5. Experimental results: Propeller efficiency of all 16 puller pods in the series.
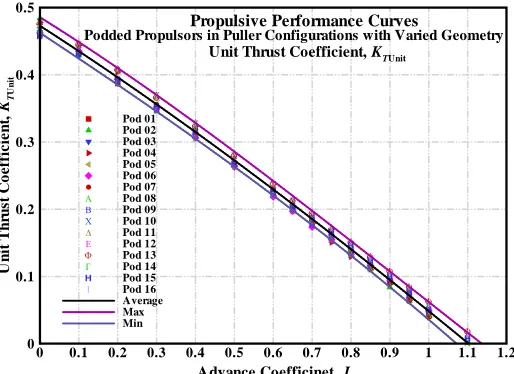
The unit thrust coefficient, KTUnit and unit efficiency, ŋUnit values
for each of the 16 pods in the pod series experiments (in the range of J=0.0~1.20) are presented in Figs. 6 and 7. The unit thrust coefficient values at J = 0 for the different pods ranged from 0.458 to 0.484, an approximately 6% spread based on the lowest KTUnit given by pod 7. At J = 0.8, the KTUnit values
ranged from 0.13 and 0.153, an approximately 18% spread based on the lowest KTUnit given by pod 4. TheŋUnit values of the
different pods ranged from 0.564 to 0.645 at J = 0.8 and from 0.366 to 0.565 at J = 1.0. The trends showed that there is significant variation in KTUnit andŋUnit values with the change of
the geometric parameters. At J=0, the thrust coefficients of the pods 1, 3, 6, 7, 12, 14, 15 were lower than those of pod 9 and the thrust coefficients of the remaining pods were higher than those of pod 9. Among these pods, pod 9 had the lowest unit efficiency (ŋUnit =0.565) and pod 5 had the highest unit
efficiency (ŋUnit =0.645) at the design advance coefficient of J=0.8. Table A-3 presents the KTUnit values for the pods in puller
[image:4.612.34.292.491.678.2] H H H H H H H H H H H H H H H H
Advance Coefficinet, J
U n it T h ru st C o e ff ic ie n t, KT U n it
0 0.1 0.2 0.3 0.4 0.5 0.6 0.7 0.8 0.9 1 1.1 1.2
0 0.1 0.2 0.3 0.4 0.5 Pod 01 Pod 02 Pod 03 Pod 04 Pod 05 Pod 06 Pod 07 Pod 08 Pod 09 Pod 10 Pod 11 Pod 12 Pod 13 Pod 14 Pod 15 Pod 16 Average Max Min H
Propulsive Performance Curves
[image:5.612.36.293.36.223.2]Podded Propulsors in Puller Configurations with Varied Geometry Unit Thrust Coefficient, KTUnit
Fig. 6. Experimental results: Unit thrust coefficient of all 16 puller pods in the series.
H H H H H H H H
H H H
H H H H
Advance Coefficinet, J
U n it E ff ic ie n c y ,
Un
it
0.1 0.2 0.3 0.4 0.5 0.6 0.7 0.8 0.9 1 1.1 1.2
0.1 0.2 0.3 0.4 0.5 0.6 0.7 Pod 01 Pod 02 Pod 03 Pod 04 Pod 05 Pod 06 Pod 07 Pod 08 Pod 09 Pod 10 Pod 11 Pod 12 Pod 13 Pod 14 Pod 15 Pod 16 Average Max Min H
Propulsive Performance Curves
[image:5.612.318.575.243.426.2]Podded Propulsors in Puller Configurations with Varied Geometry Unit Efficiency,Unit
Fig. 7. Experimental results: Unit propulsive efficiency of all 16 puller pods in the series.
Pod Series in Pusher Configuration
The propeller thrust coefficient, KTProp, propeller torque
coefficient, 10KQ and propulsive efficiency,ŋProp values for each
of the 16 pods in the pusher pod series experiments (in the range of J=0.0~1.20) are presented in Figs. 8, 9 and 10, respectively. The tests were conducted at 17 different advance coefficients. Tests were repeated at a minimum of 4 advance coefficients. Table A-4 and A-5 present the KTProp and 10KQ values for the
pods in pusher configurations, respectively.
For the pusher propulsors in the series, the KTPropvalues at J = 0
of the 16 pods ranged from 0.4564 to 0.4715, an approximately 4% spread based on the lowes t KTProp given by pod 7. At J =
0.8, the KTProp values were in a range of 0.1469-0.1724
(approximately 17% spread based on the lowest KTProp). At
J=0.8, the highest KTProp was given by pod 4 and the lowest
KTProp was given by pod 13 . The torque coefficient (10KQ)
values of the different pods ranged from 0.6532 to 0.6852 (approximately 5% spread based on the lowest 10 KQ given by
pod 12) at J = 0, and from 0.275 to 0.312 (approximately 14% spread based on the lowest 10 KQ given by pod 1) at J = 0.8. The
ŋProp values of the different pods ranged from 0.666 -0.712 at J =
0.8 and 0.580-0.702 at J = 1.0. The trends showed that for the pusher configuration propulsors, there was significant variation
in KTProp, 10KQ and ŋProp values with changes of the geometric
parameters. At J=0, the thrust coefficients of the pods 2, 7, 8, 12, 13, 14 were lower than those of pod 9 and the thrust coefficients of the remaining pods were higher than those of pod 9. At J=0.8, the propulsive efficiencies of the pods 5, 7, 9, 13, 14, 15, 16 were lower than those of pod 8 and the propulsive efficiencies of the remaining pods were higher than those of pod 8. This indicated that the efficiency of the propeller attached with pod 8 was approximately the average of all the other pods. Among the pods, pod 13 had the lowest efficiency (ŋProp =0.666)
and pod 12 had the highest efficiency (ŋProp =0.712) at the
design advance coefficient of J=0.8.
H H H H H H H H H H H H H H H H # # # # # # # # # # # # # # # # & & & & & & & & & & & & & & & &
Advance Coefficinet, J
P ro p e ll e r T h ru st C o e ff ic ie n t, KT P ro p
0 0.1 0.2 0.3 0.4 0.5 0.6 0.7 0.8 0.9 1 1.1 1.2
0 0.1 0.2 0.3 0.4 0.5 Pod 01 Pod 02 Pod 03 Pod 04 Pod 05 Pod 06 Pod 07 Pod 08 Pod 09 Pod 10 Pod 11 Pod 12 Pod 13 Pod 14 Pod 15 Pod 16 Average Max Min H # &
Propulsive Performance Curves
Podded Propulsors in Pusher Configurations with Varied Geometry
Propeller Thrust Coefficient, KTProp
Fig. 8. Experimental results: Propeller thrust coefficient of all 16 pusher pods in the series.
H H H H H H H H H H H H H H H H # # # # # # # # # # # # # # # # & & & & & & & & & & & & & & & &
Advance Coefficinet, J
T o rq u e C o e ff ic ie n t, 1 0 KQ
0 0.1 0.2 0.3 0.4 0.5 0.6 0.7 0.8 0.9 1 1.1 1.2
0 0.1 0.2 0.3 0.4 0.5 0.6 0.7 Pod 01 Pod 02 Pod 03 Pod 04 Pod 05 Pod 06 Pod 07 Pod 08 Pod 09 Pod 10 Pod 11 Pod 12 Pod 13 Pod 14 Pod 15 Pod 16 Average Max Min H # &
Propulsive Performance Curves
Podded Propulsors in Pusher Configurations with Varied Geometry
Propeller Torque Coefficient, 10KQ
[image:5.612.35.291.260.445.2] [image:5.612.319.576.464.648.2] H H H H H H H H H H H H H H H # # # # # # # # # # # # # # # & & & & & & & & & & & & & & &
Advance Coefficinet, J
P ro p u ls iv e E ff ic ie n c y ,
Pro
p
0.1 0.2 0.3 0.4 0.5 0.6 0.7 0.8 0.9 1 1.1 1.2
0.1 0.2 0.3 0.4 0.5 0.6 0.7 0.8 Pod 01 Pod 02 Pod 03 Pod 04 Pod 05 Pod 06 Pod 07 Pod 08 Pod 09 Pod 10 Pod 11 Pod 12 Pod 13 Pod 14 Pod 15 Pod 16 Average Max Min H # &
Propulsive Performance Curves
Podded Propulsors in Pusher Configurations with Varied Geometry Propulsive Efficiency,Prop
Fig. 10. Experimental results: Propeller efficiency of all 16 pusher pods in the series.
The KTUnit andŋUnit values for each of the 16 pods in the pusher
pod series experiments (in the range of J=0.0~1.20) are presented in Figs. 11 and 12, respectively. The unit thrust coefficient (KTUnit) values at J = 0 of the different pods ranged
from 0.440-0.462, an approximately 5% spread based on the lowest KTUnit given by pod 1. At J = 0.8, the KTUnit values cover
a ranged of 0.112-0.143 (approximately 18% spread based on the lowest KTUnit given by pod 12). The ŋUnit values of the
different pods ranged from 0.514 -0.634 at J = 0.8 and 0.232-0.415 at J = 1.0. The trends showed that there was significant variation in KTUnit and ŋUnit values with the change of the
geometric parameters. At J=0, the unit thrust coeffic ients of the pods 1, 3, 4, 5, 6, 8, 16 were lower than those of pod 9 and the thrust coefficients of the remaining pods were higher than those of pod 9. Among the pods, pod 4 had the lowest unit efficiency (ŋUnit =0.514) and pod 11 had the highest unit eff iciency (ŋUnit
=0.634) at the design advance coefficient of J=0.8. Table A-6 presents the KTUnit values for the pods in pusher configuration.
H H H H H H H H H H H H H H H # # # # # # # # # # # # # # # & & & & & & & & & & & & & & &
Advance Coefficinet, J
U n it T h ru st C o e ff ic ie n t, KT U n it
0 0.1 0.2 0.3 0.4 0.5 0.6 0.7 0.8 0.9 1 1.1 1.2
0 0.1 0.2 0.3 0.4 0.5 Pod 01 Pod 02 Pod 03 Pod 04 Pod 05 Pod 06 Pod 07 Pod 08 Pod 09 Pod 10 Pod 11 Pod 12 Pod 13 Pod 14 Pod 15 Pod 16 Average Max Min H # &
Propulsive Performance Curves
Podded Propulsors in Pusher Configurations with Varied Geometry Unit Thrust Coefficient, KTUnit
Fig. 11. Experimental results: Unit thrust coefficient of all 16 pusher pods in the series.
H H H H H H H
H H H H
H H H # # # # # # # # # # # # # # & & & & & & & & & & & & & &
Advance Coefficinet, J
P ro p u ls iv e E ff ic ie n c y ,
Un
it
0.1 0.2 0.3 0.4 0.5 0.6 0.7 0.8 0.9 1 1.1 1.2
0.1 0.2 0.3 0.4 0.5 0.6 0.7 Pod 01 Pod 02 Pod 03 Pod 04 Pod 05 Pod 06 Pod 07 Pod 08 Pod 09 Pod 10 Pod 11 Pod 12 Pod 13 Pod 14 Pod 15 Pod 16 Average Max Min H # &
Propulsive Performance Curves
Podded Propulsors in Pusher Configurations with Varied Geometry Propulsive Efficiency,Unit
Fig. 12. Experimental results: Unit propulsive efficiency of 16 pusher pods in the series.
UNCERTAINTY ANALYSIS
While the details of uncertainty analysis are beyond the scope of this paper, a brief discussion of the levels of uncertainty in the above results is given below. To assess the uncertainty in each set of experiments and to identify the major factors influencing these results, a thorough uncertainty analysis was conducted (Islam, 2006b). The techniques used were based on adaptations of uncertainty analysis techn iques outlined in ITTC recommended Procedure (2002b); Bose and Luznik (1996); Coleman and Steele (1989) and Hess et al. (2000).
The overall uncertainty in the non -dimensional performance coefficients of the podded propulsors required proper identification of all the variables contained within the data reduction expressions (equations 1 -6). The experimental approaches used to obtain the data for each of the variables in the expressions were influenced by a variety of elemental sources of error. These eleme ntal sources were estimated, and combined using the root -sum-square (RSS) method to give the bias and precision limits for each of the variables. The bias errors consisted of many elemental sources of error, which depended on the approaches followed to mea sure the variables. However, for the precision error estimates of most variables, only one source of error (repeatability) was considered significant. In order to calculate the uncertainty due to calibration of the six-component dynamometer measurement, it was required to determine how the uncertainties in the calibration data propagates into each element of the interaction matrix and into the measured forces and moments (Hess et al., 2000).
The final step in the methodology of uncertainty analysis was to determine how uncertainties in each of the variables propagate through the data reduction equations. Using the approaches described in Bose and Luznik (1996) and Coleman and Steele (1989), the uncertainty expressions for each set of experiments were developed as shown in equation 7 to 10, where U denotes
the uncertainties in the corresponding coefficients denoted by the subscripts. It is to be noted that, in deriving the expressions, the cross-correlated bias limits (Coleman and Steele, 1989 ) were ignored. Strictly they should have been included, but they would have, in the current case, reduced the total uncertainty.
2 2
2 2
Pr Prop 2
Prop
16
4
Prop
D
U
n
U
U
T
U
K
U
D n
op T
T KT
(7)
2 2
2 2
2
25
4
D
U
n
U
U
Q
U
K
U
D n
Q
Q KQ
(8)
2 2
2 2
Unit Unit 2
Unit
16
4
D
U
n
U
U
T
U
K
U
D n
T
T KTUnit
(9)
2 2
2 2
D
U
n
U
V
U
J
U
n DA V
J A
(10)
In the expressions for the podded propulsors’ tests, it should be
noted that for both thrust and torque coefficie nt uncertainties, the tare thrust and frictional torque were imbedded in the corresponding measurements. Since the tare thrust and frictional torque were part of the same data stream as the thrust and torque readings, they were not treated as an independen t contributor of
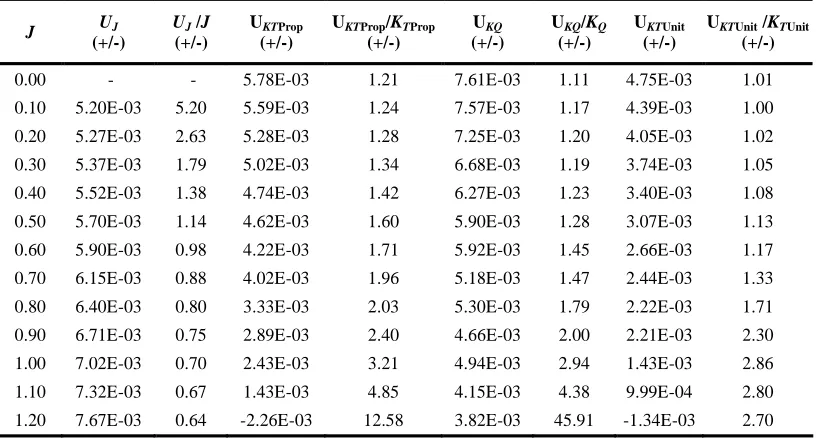
[image:7.612.103.511.382.601.2]error to the corresponding coefficients, but rather as a bias error on the static-zero value of the thrust and the torque measurements. The resulting error estimates for the podded propulsor tests are given in Table 3 below.
Table 3. Uncertainty in the measurements of the pod series data.
J UJ
(+/-)
UJ /J
(+/-)
UKTProp
(+/-)
UKTProp/KTProp
(+/-)
UKQ
(+/-)
UKQ/KQ
(+/-)
UKTUnit
(+/-)
UKTUnit /KTUnit
(+/-)
0.00 - - 5.78E-03 1.21 7.61E-03 1.11 4.75E-03 1.01
0.10 5.20E-03 5.20 5.59E-03 1.24 7.57E-03 1.17 4.39E-03 1.00
0.20 5.27E-03 2.63 5.28E-03 1.28 7.25E-03 1.20 4.05E-03 1.02
0.30 5.37E-03 1.79 5.02E-03 1.34 6.68E-03 1.19 3.74E-03 1.05
0.40 5.52E-03 1.38 4.74E-03 1.42 6.27E-03 1.23 3.40E-03 1.08
0.50 5.70E-03 1.14 4.62E-03 1.60 5.90E-03 1.28 3.07E-03 1.13
0.60 5.90E-03 0.98 4.22E-03 1.71 5.92E-03 1.45 2.66E-03 1.17
0.70 6.15E-03 0.88 4.02E-03 1.96 5.18E-03 1.47 2.44E-03 1.33
0.80 6.40E-03 0.80 3.33E-03 2.03 5.30E-03 1.79 2.22E-03 1.71
0.90 6.71E-03 0.75 2.89E-03 2.40 4.66E-03 2.00 2.21E-03 2.30
1.00 7.02E-03 0.70 2.43E-03 3.21 4.94E-03 2.94 1.43E-03 2.86
1.10 7.32E-03 0.67 1.43E-03 4.85 4.15E-03 4.38 9.99E-04 2.80
1.20 7.67E-03 0.64 -2.26E-03 12.58 3.82E-03 45.91 -1.34E-03 2.70
A dv ance Co efficient, J KT
P
ro
p
,
KT
U
n
it
,
1
0
KQ
0 0 .1 0 .2 0 .3 0 .4 0 .5 0 .6 0 .7 0 .8 0 .9 1 1 .1 1 .2
0 0 .1 0 .2 0 .3 0 .4 0 .5 0 .6 0 .7
KTPo d KTU nit
1 0 KQ
O pe n W a te r P ropulsive P e rform a nce C urve s w ith E rror Ba rs P od 1 6 in P ulle r C onfigura tion
Fig. 13. Propulsive performance of pod 16 in puller configuration with error bars.
DOE ANALYSIS
The design of experiment data analysis was completed using the commercial software, Design Expert® (2005). The software allows the user to choose a factorial design that meets specific research configuration requirements; in this case the design includes one pod with all -low factors and one pod with all -high factors. The analysis of the data using a fractional factorial design technique resulted in the identification of the most significant factors and interactions of factors that affect the propulsive performance of the podded propulsors both in puller and pusher configurations.
DOE Analysis of Puller Propulsors
The Analysis of Variance Approach (ANOVA, see
Montgomery, 2005) incorporating with a 95% confidence
interval was used to examine the geometric parameters of the series that have the most significant impact on the performance of the podded propulsors. A separate analysis w as completed for each advance coefficient. Table 4 lists all the factors and interactions of factors that have significant influence on the performance coefficients: propeller thrust coefficient, KTProp,
propeller torque coefficient, KQ, propeller efficiency, ŋProp, unit
thrust coefficient, KTUnit and unit efficiency, ŋUnit for the puller
propulsors in the pod series. The factors are designated as shown in Table 2. Table 4 shows that the significant factors that come up repeatedly over the range of J values are A (the ratio of pod diameter to propeller diameter, DPod/DProp), D (the ratio of
strut distance to propeller diameter, SDist/DProp), E (hub taper
angle, HAngle), AE (interaction of DPod/DProp and HAngle) and BD
(interaction of LPod/DProp and SDist/DProp). The factor C (the ratio
of pod taper length to propeller diameter, TL/DProp) did not show
any significant influence on the performance coefficients at any advance coefficient.
The factors HAngle and DPod/DProp had significant impact on
propeller thrust coefficient (KTProp), unit thrust coefficient
(KTUnit) and torque coefficient ( KQ) for almost all values of
advance coefficients, but as the value of advance coefficient increased from 0, interaction of DPod/DProp and HAngle became as
significant as the single factors DPod/DProp and HAngle (in the
range of J=0.3~1.0). The factor B ( LPod/DProp) appeared to have
significant effect in the form of interaction with D ( SDist/DProp)
on KTUnit at high values of J (in the range of J=0.75~0.95). The
factor D (SDist/DProp) appeared to have significant effect on KTProp
and KQ at moderate advance coefficients, as shown in Table 4.
The propeller and unit efficiencies, ŋProp and ŋUnit were mostly
affected by HAngle and DPod/DProp; HAngle being the most
influential one at all advance coefficients. DPod/DProp played an
important role when the advance coefficient was higher than 0.6.
Table 4. Fractional factorial design results: List of significant factors and interaction of factors for puller propulsors. Here, A is the ratio of pod diameter to propeller diameter, DPod/DProp, B isthe ratio of pod length to propeller diameter, LPod/DProp, C is the ratio of pod taper
length to propeller diameter, TL/DProp, D is the ratio of strut distance to propeller diameter, SDist/DProp, and E is the propeller hub taper
angle, HAngle.
Significant factor and interaction of factors
J
K
TPropK
TUnitK
Qŋ
Propŋ
Unit0.00
A, E E A, E - - --0.10
A, E E A, E E E0.20
A, E E A, E E E0.30
A, E AE A, E AE A, E AE E E0.40
A, E AE A, E AE A, E AE E E0.50
A, E AE A, E AE A, E AE E E0.60
A, D, E AE A, E AE A, D, E AE A, E E0.70
A, D, E AE A, E AE A, D, E AE A, E E0.80
A, D, E AE A, E AE, BD A, D, E AE A, E E0.90
A, D, E AE A AE, BD A, D, E AE A, E A, E1.00
A, E A BD A, E A, E A, EAs shown in Fig. 14, the parameter DPod/DProp had a significant
effect on KTProp at J=0.8. For a fixed propeller diameter, as the
pod diameter increased the KTProp increased. In the puller
configuration, the larger pod diameter created larger blockage to the flow behind the propeller. The flow blockage reduced the local inflow velocity, thus the propeller operated at a lower effective advance coefficient, which resulted in increases in the
KTProp. The analysis also indicated that the factor A (DPod/DProp)
was involved in an interaction. This means that while the information in Fig. 14 is valid, there might be indirect impact on
KTProp due to the interaction of DPod/DProp and HAngle. The
parameter A (DPod/DProp) had an effect on KTUnit, KQ, ŋProp and
ŋUnit similar to that of KTProp for the advance coefficient values
[image:9.612.64.262.224.420.2]shown in Table 4.
Fig. 14. DOE Analysis: The effect of DPod/ DProp (A) on
propeller thrust at J=0.8 for puller propulsors.
Fig. 15. DOE Analysis: The effect of significant factors, SDist/DProp (D) on propeller thrust at J=0.8 for puller propulsors.
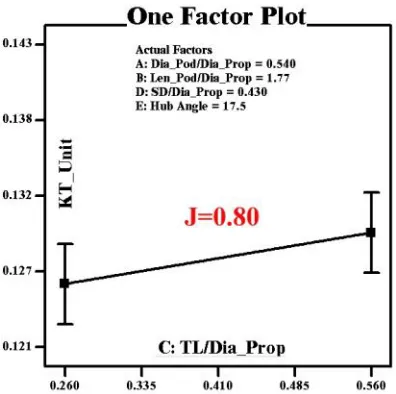
Fig. 15 shows the effect of the strut distance, D ( SDist/DProp) on
KTProp; it shows that as the strut distance increased the KTProp
tended to decrease slightly because of the blockage effect of the strut. A similar effect was found for KQ. SDist/DPropdid not show
any effect on KTUnit as an individual factor but had influence on
KTUnit as an interaction effect as described later (Fig. 21). Fig. 16
shows the effect of hub angle, E ( HAngle) on KTProp. As the hub
angle increased, the KTProp also increased. The increasing effect
of the hub angle on KTProp was also found in a previous study
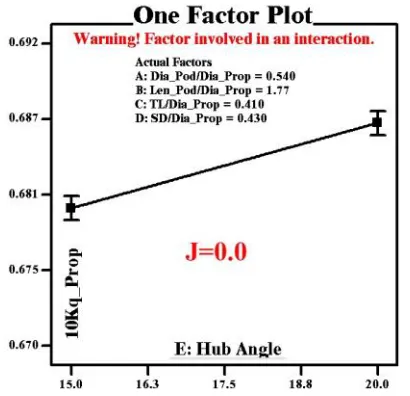
using the same instrumentation (Islam et al., 2006). Hub angle had a similar effect on KTUnit, ŋProp and ŋUnit. Figs. 17 and 18
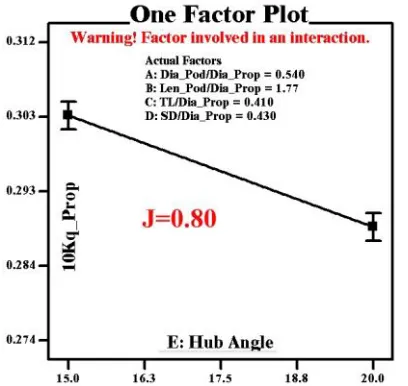
show that the parameter hub angle, HAngle, had a significant but
opposite effect on KQ at J=0 and J=0.8, respectively. As the hub
angle increased, the KQ increased at J=0 but decreased at J=0.8.
Fig. 16. DOE Analysis: The effect of significant factor, HAngle
[image:9.612.346.551.434.632.2](E) on propeller thrust at J=0.8 for puller propulsors.
Fig. 17. DOE Analysis: The effect of significant factor, HAngle
(E) on propeller torque at J=0 for puller propulsors.
Fig. 19 shows the interaction effect AE (DPod/DProp and HAngle)
on KTProp; it shows that the influence of the factor DPod/DProp was
factor DPod/DProp was low, there was littl e change in KTProp
(within 2% based on the lower KTProp) due to change in hub
angle. However, when the ratio was high, there was a highly significant effect of hub angle on KTProp (approximately 8%
based on the lower KTProp). This indicated that for a fat pod with
respect to the propeller (higher value of DPod/DProp), the hub
angle had more effect on KTProp (as the hub angle increases, the
KTProp increases) than a slender pod with a low value of the
factor DPod/DProp. A similar interaction effect was also f ound on
[image:10.612.348.550.121.327.2]KTUnit and KQ.
Fig. 18. DOE Analysis: The effect of significant factor, HAngle
(E) on propeller torque at J=0.8 for puller propulsors.
Fig. 19. DOE Analysis: The interaction effect of significant factors, DPod/ DProp (A) and HAngle (E) on propeller thrust at J=0.8 for puller propulsors.
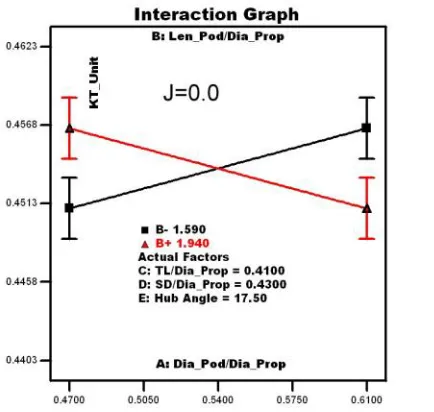
Fig. 20 shows the interaction effect BD ( LPod/DProp and SDist/DProp) on KTUnit at J=0.8; it shows that the effect of the
factor LPod/DProp was opposite at the high and low values of
SDist/DProp. At the low LPod/DProp value, the increase of SDist/DProp
increased the KTUnit, whereas at high LPod/DProp value, the
increase of SDist/DProp decreased the KTUnit. In other words, for
the low SDist/DProp case, increasing LPod/DPropincreased the KTUnit,
but for the high SDist/DProp case, increasing LPod/DPropdecreased
the KTUnit.
Fig. 20. DOE Analysis: The interaction effect of significant factors, LPod
/
DProp (B) and SDist/DProp (D) on unit thrust at J=0.8for puller propulsors.
[image:10.612.63.267.164.357.2]DOE Analysis of Pusher Propulsors
Table 5 lists all the factors and interactions of factors that have significant influence on the performance coefficients KTProp, KQ,
ŋProp, KTUnit andŋUnit for the pusher propulsors in the pod series.
Table 5 shows that the significant factors that came up repeatedly over the range of J values were A (DPod/DProp), B
(LPod/DProp), C (TL), D (SDist/DProp), E (HAngle), AB (interaction of DPod/DProp and LPod/DProp) and BC (interaction of LPod/DProp and TL).
The factor HAngle had significant impact on KTProp, KQ,ŋProp and
ŋUnit for all values of advance coefficient, whereas the factor A
(DPod/DProp) had significant impact at moderate and high values
of advance coefficient (in the range of J=0.4~1.1). The factor B (LPod/DProp) had significant influence in the form of interaction
with D (SDist/DProp) on KTUnit at moderate values of J (in the
range of J=0.4~0.7) and as an individual factor at high values of J (in the range of J=0.9~1.1). The factor D ( SDist/DProp) appeared
to have significant effect on KTProp and ŋProp at advance
coefficients of 0.8 and higher. The factor C ( TL/DProp) had a
noticeable impact on KTUnit at low and moderate values of
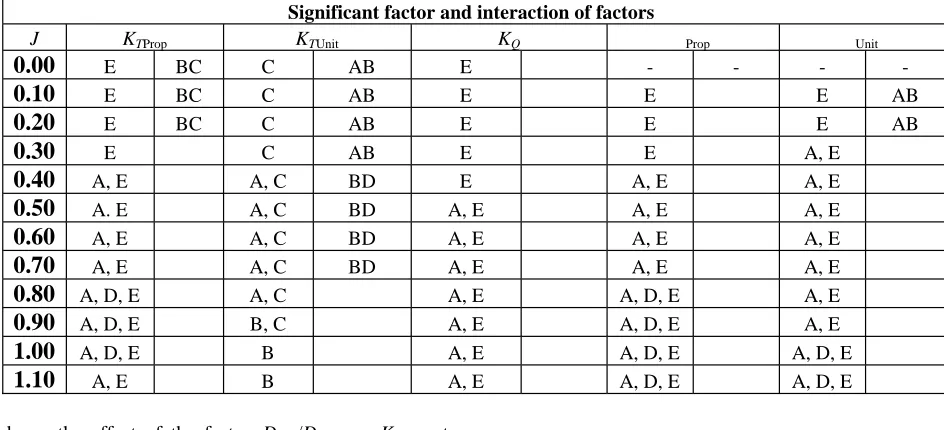
[image:10.612.64.263.398.604.2]Table 5. Fractional factorial design results: List of significant factors and interaction of factors for pusher propulsors. Here, A is the ratio of pod diameter to propeller diameter, DPod/DProp, B isthe ratio of pod length to propeller diameter, LPod/DProp, C is the ratio of pod
taper length to propeller diameter, TL/DProp, D is the ratio of strut distance to propeller diameter, SDist/DProp, and E is the propeller hub
taper angle, HAngle.
Significant factor and interaction of factors
J KTProp KTUnit KQ ŋProp ŋUnit
0.00
E BC C AB E - - --0.10
E BC C AB E E E AB0.20
E BC C AB E E E AB0.30
E C AB E E A, E0.40
A, E A, C BD E A, E A, E0.50
A. E A, C BD A, E A, E A, E0.60
A, E A, C BD A, E A, E A, E0.70
A, E A, C BD A, E A, E A, E0.80
A, D, E A, C A, E A, D, E A, E0.90
A, D, E B, C A, E A, D, E A, E1.00
A, D, E B A, E A, D, E A, D, E1.10
A, E B A, E A, D, E A, D, EFig. 21 shows the effect of the factor DPod/DProp on KTProp at
J=0.8. For a fixed propeller diameter, as the pod diameter increased the KTProp increased. The larger pod diameter created
larger blockage to the flow in front of the propeller. The blockage in the flow reduced the local flow velocity, thus the propeller operated at lower effective advance coefficient, which resulted in an increase in KTProp. The parameter, DPod/DProp had
similar effect on KTProp, KQ,ŋProp andŋUnit for the other advance
coefficient values shown in Table 5. Fig. 22 shows the effect of the factor DPod/DProp on KTUnit at J=0.8. For a fixed propeller
diameter, as the pod diameter increased the KTProp decreased. A
larger pod diameter means higher drag on the pod, along with a larger blockage effect, which resulted in lower unit thrust.
Fig. 21. DOE Analysis: The effect of DPod/ DProp (A) on
[image:11.612.69.541.102.317.2]propeller thrust at J=0.8 for pusher propulsors.
Fig. 22. DOE Analysis: The effect of DPod/ DProp (A) on unit
thrust at J=0.8 for pusher propulsors.
Fig. 23 shows the effect of the factor taper length, C ( TL/DProp)
on KTUnit at J=0.8. For a fixed propeller diameter, as the pod
taper length increased the KTUnit increased. Taper length showed
a similar effect on unit thrust at other advance coefficients but it did not have significant effect on KTProp, KQ,ŋProp andŋUnitat any
of the advance coefficients.
Fig. 24 shows the effect of the strut distance, D (SDist/DProp) on
propeller thrust; it shows that at J=0.8, as the strut distance increased, the KTProp tended to decrease slightly because of
blockage effect of the strut. The factor, SDist/DProp showed
similar effect on ŋProp and ŋUnit at high advance coefficients but
did not show any effect on KTUnit and KQ at any advance
[image:11.612.62.258.476.668.2]Fig. 23. DOE Analysis: The effect of TL/ DProp (C) on unit thrust
[image:12.612.350.550.38.229.2]at J=0.8 for pusher propulsors.
Fig. 24. DOE Analysis: The effect of SDist/ DProp (D) on propeller
thrust at J=0.8 for pusher propulsors.
Fig. 25 shows the effect of hub angle, HAngleon KTProp at J=0.8.
As the hub angle increased, the KTProp also increased. The
parameter, HAngle had a similar effect on KTProp, KQ,ŋProp andŋUnit
for the other advance coefficient values as shown in Table 5 but did not have any effect on KTUnit at any advance coefficients.
Fig. 26 shows the effect of pod length, LPod/DProp on KTUnit at
J=0.9. As the pod length increased, the KTUnit decreased meaning
longer pods had lower unit thrust. The parameter LPod/DProp
showed a similar effect on only unit thrust at higher advance coefficients (J greater than 0.9).
The interaction of factors B and C, i.e. BC, ( LPod/DProp and TL/DProp) had noticeable effect on KTProp when J was equal to 0.3
or less. Fig. 27 shows that for constant propeller diameter, at J=0 and at lower taper length, increasing pod length resulted in lower propeller thrust, whereas at higher taper length, increasing pod length resulted in higher propeller thrust.
Fig. 25. DOE Analysis: The effect of HAngle (E) on propeller
[image:12.612.347.550.259.454.2]thrust at J=0.8 for pusher propulsors.
Fig. 26. DOE Analysis: The effect of LPod/ DProp (B) on unit
[image:12.612.65.263.273.463.2]thrust at J=0.9 for pusher propulsors.
Fig. 27. DOE Analysis: The interaction effect of LPod
/
DProp (B) and TL/DProp (C) on propeller thrust at J=0 for pusher [image:12.612.348.573.478.686.2]Fig. 28 shows the interaction effect of AB ( DPod/DProp and LPod/DProp) on unit thrust at J=0. It shows that for constant
propeller diameter, at lower pod diameter, increasing pod length resulted in an increase in unit thrust, whereas at higher pod diameter, increasing pod length produced a lower unit thrust. A similar effect was found in the range of J=0 to 0.4.
Fig. 28. DOE Analysis: The interaction effect of DPod/DProp (A)
and LPod/DProp (B) on unit thrust at J=0 for pusher propulsors.
CONCLUDING REMARKS
A series of 16 pods were designed using a fractional factorial design technique to study the effects of five geometric parameters (pod diameter, pod length, pod taper length, strut distance and propeller hub angle) of podded propulsors in pusher and puller configurations. The experimental data on the pod series was acquired using a custom -designed pod testing system at the OERC towing tank at Memorial University. The findings of the analysis can be summarized at follows:
For a fixed propeller diameter, as the pod diameter increased, the propeller thrust, torque and efficiency increased for both puller and pusher propulsors; this might be attributed to the blockage effect of the pod. However, the increase in pod diameter resulted in a decrease in unit thrust for the pusher propulsors.
Pod length did not show an obvious effect on the performance coefficients of the puller propulsors, b ut it showed some effect on unit thrust coefficient of the pusher propulsors at higher advance coefficient regions. At advance coefficients of 0.9 or higher, for a fixed propeller diameter, as the pod length increased the propulsor unit thrust coefficient decreased, meaning that longer pods had lower unit thrust in the pusher configuration.
For the puller propulsors, as the hub taper angle increased, both propeller and propulsor unit thrust coefficients and efficiencies increased for all ranges of advance coefficients; this was more pronounced at low advance coefficients. However, hub angle had opposite effects on torque coefficients at low and high
advance coefficients. The torque increased with increasing taper angle at advance coefficients of 0.7 or lowe r but decreased at higher advance coefficients. For the pusher propulsors, as the hub taper angle increased, propeller and unit thrusts and propeller torque coefficients and efficiencies increased for all ranges of advance coefficients
The ratio of strut distance to propeller diameter had moderate effects on propeller thrust and torque coefficients for puller propulsors at moderate advance coefficients but only on propeller thrust for pusher propulsors. As the distance of the strut leading edge from the pr opeller plane increased, the propeller thrust and torque coefficient decreased.
Taper length of the pod aft end, the end away from the propeller, did not have a significant influence on performance of the puller propulsors within the range tested. However , it had significant effect on unit thrust of the pusher propulsors at all advance coefficients. For a fixed propeller diameter, as the pod taper length increased, the unit thrust also increased due to less pod drag on pods with high taper length.
The interaction of the factors pod diameter and hub angle had significant effect on both propeller and unit thrust and torque coefficients at moderate advance coefficient for the puller propulsors. For a fat pod, the influence of increased hub taper angle, which causes an increase in propeller and unit thrust coefficients, was more pronounced. The interaction of the factors showed little or no effect for the pusher propulsors.
For the pusher propulsors, the interaction of the factors pod length and pod taper le ngth had noticeable effect on propeller thrust for low advance coefficients. When the ratio of the pod taper length to propeller diameter was low, increasing pod length resulted in lower propeller thrust, whereas at higher taper length increasing pod lengt h resulted in higher propeller thrust.
For the pusher propulsors, the interaction effect of pod diameter and pod length was significant on unit thrust coefficient at low advance coefficients. The analysis showed that for a slender pod (low value of pod diameter to propeller diameter), increasing pod length resulted in an increase in unit thrust, whereas the opposite is true for the pod with a high value of the ratio of pod diameter to propeller diameter.
For the puller propulsors, the interaction effect p od length and strut distance was significant on unit thrust coefficient at moderate advance coefficients. The analysis showed that the impact of pod length was opposite at high and low values of strut distance. At the low pod length value, the increase of strut distance increased the unit thrust, whereas at high pod length value, the increase of strut distance decreased the unit thrust.
[image:13.612.65.282.120.326.2]