Research and Library Service
Briefing Paper
Paper 169/10 10 November 2010 NIAR 529-10
Jane Campbell
Update on child poverty
Section 1 Introduction
This purpose of this briefing paper is to update the Committee for OFMdFM on the UK and Northern Ireland’s progress on meeting the government’s poverty targets. The paper also outlines some current developments in the debate around child poverty and presents some key findings from new research on child poverty in Northern Ireland.
Section 2 Background
2.1 Committee for OFMdFM Inquiry into Child Poverty
The Committee for the Office of the First Minister and deputy First Minister launched an inquiry into child poverty in October 2007. A final report in June 20081 identified six key areas for Executive action:
To create a strategy for tackling child poverty
To introduce policies to increase incomes
To tackle rising costs
To promote employment (including immediate action to introduce a child care strategy for NI)
1Final Report on the Committee’s Inquiry into Child Poverty in Northern Ireland
Northern Ireland Assembly June 2008 Volume 1 http://www.niassembly.gov.uk/centre/2007mandate/reports/Report08_07_08r_vol1.htm
To reduce long-term disadvantage
A cross cutting approach
The Department has since provided a detailed response to the Inquiry’s recommendations and updated the Committee on progress.2
The Executive’s commitment to work for the elimination of poverty is also expressed in the Programme for Government3 (PfG) with the key goals:
To work towards the elimination of child poverty in NI by 2020 and reducing child poverty by 50% by 2010 and
To work towards the elimination of severe poverty by 2012.
Public Service Agreement (PSA) 7 in the PfG specifies: Making People’s lives better: By driving a programme across Government to reduce poverty and address inequality and disadvantage.
Lifetime Opportunities (2006) is the Northern Ireland Executive’s anti poverty and social
inclusion strategy. Lifetime Opportunities has two overall strategic objectives:
o To work towards the elimination of poverty and social exclusion in NI by 2020; and
o To end child poverty by 2020 (with the interim goal of halving child poverty by 2010)
In October 2010 OFMDMF published a Lifetime Opportunities Monitoring Framework Baseline Report4which presents a range of statistical targets and indicators to provide a picture of the changing levels of poverty.
The Child Poverty Act5 was enacted in March 20106. The Act requires the production by March 2011 of a UK wide strategy setting out the measures the Secretary of State proposes to take to meet the targets set out in the Act. The goal to end child poverty by 2020 has been maintained by the Coalition Government.
As well as the interim target of halving the number of children living in relative low income by 2010/11, four UK-wide targets are to be met by 2020 (see section 3.1 below).
The legislation places a responsibility on England, Scotland and NI7 to produce Child Poverty Strategies that describe how each jurisdiction will contribute to meeting the UK targets and the activities to be undertaken to tackle child poverty. Strategies may not refer to matters which are reserved to Westminster.
2
http://www.niassembly.gov.uk/record/committees2009/OFMDFM/100217_ChildPovertyReport.htm
3Building a Better Future Northern Ireland Executive Programme for Government 2008-2011
http://www.northernireland.gov.uk/pfgfinal.pdf
4
http://www.OFMdFMni.gov.uk/annex_3_lifetime_opportunities_monitoring_framework_oct_2010_pdf.pdf
5
Child Poverty Act 2010 http://www.legislation.gov.uk/ukpga/2010/9/contents
Child Poverty Act 2010 Explanatory Note http://www.legislation.gov.uk/ukpga/2010/9/notes/contents
6 The Assembly passed a legislative consent motion to allow that Bill to extend to Northern Ireland. 7
A UK wide Child Poverty Commission will advise the UK and devolved authorities on their child poverty strategies. OFMDFM will appoint a member to the Commission. OFMdFM is required to produce its strategy by March 2011 and hereafter to report to the Assembly on a yearly basis on how it is progressing against the targets. OFMDFM is due to publish a draft strategy for consultation shortly.
Section 3 Latest Child Poverty figures
3.1 What are the UK targets?
o The Child Poverty Act sets a target for 2010/11 of halving the proportion of children living in relative low income. This should equate to 1.7 million children. o The Child Poverty Act sets four targets for 2020/21.These are based on the
proportion of children living in relative low income (target is less than 10%) combined low income and material deprivation (target is less than 5%) absolute low income (target is less than 5%) and persistent poverty (target is to be set in regulations by 2015).
3.2 Progress on the 2010/11 target: UK
Table 3.1 Child Poverty in the UK: 1998/99, 2008/09 & 2010/11 target8
millions
Indicator 1998/99 baseline 2008/09 2010/11 target
Relative poverty9 3.4 2.8 1.7
Absolute poverty 3.4 1.6
Material deprivation 2.6 2.3
Table 3.1 shows progress in the UK towards the 2010/11 child poverty target. The number of children in low income households (before housing costs are deducted) fell from 3.4 million in 1998/99 to 2.8 million by 2008/09. This means that the figure is still 0.2 million above the 2004/05 target and 1.1 million above the target set for 2010.
8 Update of table produced in Progress towards the 2010/11 child poverty target, the 2020 target & the Child Poverty Bill.
House of Commons Library Standard Note SN/EP/3314
9
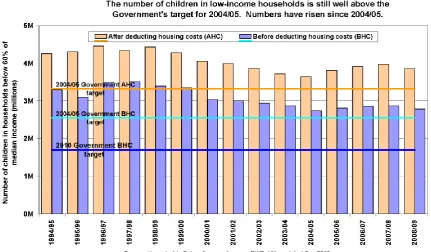
Figure 3.1 displays the UK child poverty figures (before and after housing costs are deducted) since 1994/95. The number of children reduced significantly between
[image:4.595.101.533.169.421.2]1997/98 and 2004/05 but the 2004/05 target was missed. Since then the decrease has halted and the numbers have risen.
Figure 3.1
3.3 Why the target for 2010/11 will be missed
It is now accepted that it is unlikely that the target of reducing the number of children in poverty by a half between 1998 and 2010 will be met. A detailed analysis by the
Institute for Fiscal Studies (IFS) published in October aimed to ascertain why the target will be missed and identify which factors have had the strongest influence on the child poverty rates over the period10.
They found that direct tax and benefit policy had a very strong influence on the relative measure of child poverty and chiefly explains the large overall reduction since 1998/99 and the slow-down in progress after 2004/05. But given that this poverty measure is income based, the authors say that this may not come as a great surprise.
Earnings growth acted to increase poverty – earnings growth in real terms pushed up median household income and thus the relative poverty line.
10Child Poverty in the UK since 1998-99:Lessons from the Past Decade IFS Working Paper 10/23 October 2010
Changes in the employment and earnings of parents also played an important role. Over the period 1998/99 to 2004/05 parental employment rose the most in Scotland and the northern regions of England and drove the fall in child poverty over that period. Since then the impact of the recession on regions such as the West Midlands has driven up the rate of child poverty.
The IFS analysis also found that the rise in child poverty since 2004/05 has been felt most by the children of one-earner couples whose earnings have been falling in real terms.
The authors of the IFS report doubt that the 2020 poverty target will be met unless there is a massive change to direct taxes and benefits, but this is unlikely in the current fiscal climate. They estimated that reducing child poverty to 10% would cost at least £19 billion a year (in current prices) by 2020-21; the IFS report continues:
So if the poverty target won’t be met with no extra spending on welfare benefits, and probably won’t be met with lots of extra spending on welfare benefits, what is the prognosis for child poverty? One response might be for the Government to change the
definition of child poverty.
The authors point to the recent appointment by the Prime Minister of Frank Field MP as chair of an independent Review on Poverty and Life Chances which will, amongst other things, examine the case for reforms to poverty measures, in particular for the inclusion of non-financial elements (this is discussed in section 4.2).
3.4 Treasury statement on the Comprehensive Spending Review and Child Poverty
The Spending Review and the June Budget have both taken action to protect
low-income families from the impact of changes to reduce welfare spending. This was
achieved by freezing rates of Child Benefit and withdrawing Child Benefit from those
paying higher rate Income Tax to partly fund above indexation increases to the Child
Tax Credit. These steps have ensured that there is no measurable impact on child
poverty from all modelled Budget and Spending Review changes to 2012-1311.
3.4 Progress in Northern Ireland
PSA targets in the Programme for Government require Northern Ireland to halve the proportion of children living in relative income poverty by a half by 2010/11. This equates to 15% of children or 67,000 (BHC) as the baseline figure (from 1998/99) was 135,000 children (or 29%). The latest statistics for NI relate to the period 2008/09.
11 Annex B Distributional Analysis from Spending Review 2010. HM Treasury. October 2010
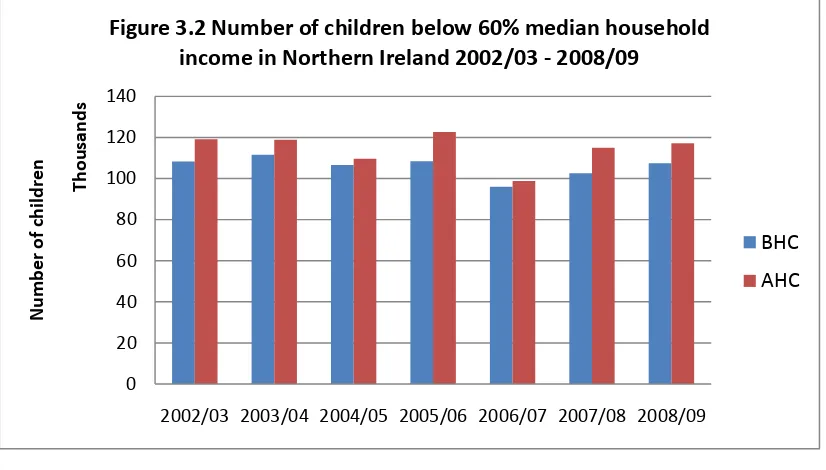
Figure 3.2 shows the trend in the numbers of children living in relative income poverty between 2002/03 and 2008/09. In 2008/09 there were 107,500 children (25%) living in low income households Before Housing Costs (BHC) and 117,200 After Housing Costs (AHC) are deducted. The trend in NI is similar to that observed in the UK over the period and shows a decline in the numbers living in poverty up until 2004/05, followed by an increase over the following few years.
SOURCE: HOUSEHOLDS BELOW AVERAGE INCOME. DSD12
3.5 OFMdFMs assessment of Northern Ireland’s progress
The OFMdFM commented on Northern Ireland’s progress on meeting the target in its recently published Lifetime Opportunities Monitoring Framework Baseline Report13:
Child relative income poverty rates have fallen from 29% in the baseline year
(1998/99) to 25% in 2008/09. Progress has, as with the UK as a whole, not
maintained the earlier momentum seen between 1998/99 and 2004/05. On the basis
of current trends it is unlikely that the Northern Ireland Public Service Agreement
target to halve child relative income poverty by 2010/11, that is, to achieve a child
relative income poverty rate of around 15%, will be achieved.
The Baseline Report commented also on Northern Ireland’s progress on meeting the
absolute income and mixed low income and material deprivation targets. A child is living in absolute income poverty if the household in which they live has an income less than what income poverty was measured at in the base year of 1998/99 (after
12 http://www.dsdni.gov.uk/index/stats_and_research/stats-publications/stats-family-resource/households.htm 13
http://www.northernireland.gov.uk/news/news-OFMdFM/news-OFMdFM-141010-statistics-press-release.htm
0 20 40 60 80 100 120 140
2002/03 2003/04 2004/05 2005/06 2006/07 2007/08 2008/09
Numb
er
of children
Th
ous
[image:6.595.101.514.177.412.2]ands
Figure 3.2 Number of children below 60% median household
income in Northern Ireland 2002/03 - 2008/09
BHC
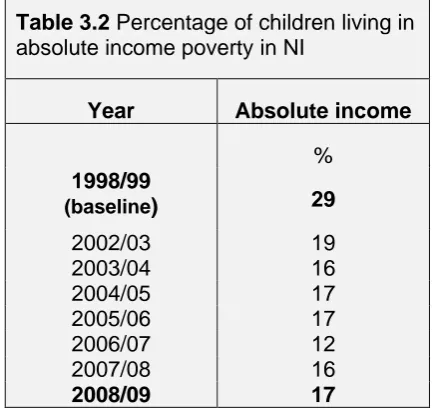
adjustment year-on-year, for the effects of inflation). Table 3.2 shows the changes in the percentage of children in NI living in absolute income poverty over time.
Table 3.2 Percentage of children living in absolute income poverty in NI
Year Absolute income
%
1998/99
(baseline) 29
2002/03 19
2003/04 16
2004/05 17
2005/06 17
2006/07 12
2007/08 16
2008/09 17
OFMdFM comment on the Lifetime Opportunities target for child absolute income poverty:
Child absolute income poverty rates have declined from 29% in the 1998/99 baseline
year to 17% in 2008/09. However, on the basis of current established trends and
particularly those seen between 2006/07 and 2008/09, it would appear unlikely that
the 2010/11 Lifetime Opportunities target to achieve a two-thirds reduction in the
number of children in absolute income poverty will be achieved.
As a wider measure of the living standards of children, a child is defined as poor if living in a household which has below 70% of the UK median household income – and has a material deprivation score of 25 or more. On the Lifetime Opportunities target for mixed low income and material deprivation the department stated:
The proportion of children identified as poor on this measure was 21% in 2004/05, the
first year for which figures were available, and 20% in 2008/09. The 2010/11 Lifetime
Opportunities target associated with this measure is to establish a downward trend
and whilst only five years of data are available, there is some uncertainty as to
whether it will be met.
Figure 3.3
3.4 Northern Ireland in relation to other jurisdictions
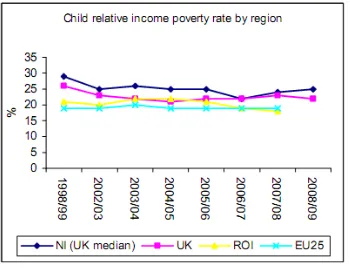
Figure 3.4 Child relative income poverty rate for NI, UK, RoI and EU25, 1998/99 –
[image:8.595.132.482.456.724.2]Figure 3.4 on page 8 shows the child relative income poverty rates for Northern Ireland, the UK, the Republic of Ireland and EU25 (European Union 25 States)14. Child relative income poverty rates have all shown a modest decline since 1998/99 although
increases have occurred in Northern Ireland in the last two years.
Section 4 Current research and debate on child poverty
4.1 Debate on targets and measures
While the Child Poverty Act was being introduced there was some debate around the targets and measures that were being proposed. One commentator stated:
But the way the Government is defining and measuring poverty is badly flawed, and
the new Bill has more to do with redistributing incomes and increasing welfare
payments than with tackling the underlying causes of child poverty.15
Criticism was aimed at the exclusive use of income based measures of child well-being with some commentators calling for a wider set of targets and indicators that cover all aspects of the lives of children and their parents. Another analyst, writing for the IFS stated:
It is clearly ridiculous to argue that child poverty is not about income, but I have
argued before that, by not including any other sort of measures or targets, there is a
risk that politicians will always favour policy responses with immediate and predictable
impacts on the incomes of parents over responses which mitigate the impact of poverty on children, or improve poor children’s well-being, or reduce the intergenerational transmission of child poverty. 16
The new Coalition Government has expressed a desire to broaden the debate about the nature and extent of poverty and to examine the case for reforms to poverty measures, as the following section explains:
4.2 Review of Poverty and Life Chances
In June 2010 Frank Field the Labour MP for Birkenhead was appointed by David Cameron as chair of an independent review of poverty and life chances based in the Cabinet Office. The Review’s Terms of Reference are to:
Generate a broader debate about the nature and extent of poverty in the UK
14
From http://www.OFMdFMni.gov.uk/annex_3_lifetime_opportunities_monitoring_framework_oct_2010_pdf.pdf
15
Poverty of ambition: why we need a new approach to tackling child poverty. Peter Saunders. Policy Exchange Research Note October 2009 http://www.policyexchange.org.uk/images/publications/pdfs/POVERTY_OF_AMBITION_HDS.pdf
16What’s the Point of the Child Poverty Bill? Mike Brewer. Institute for Fiscal Studies November 2009
Examine the case for reforms to poverty measures, in particular for the inclusion of non-financial elements
Explore how a child’s home environment affects their chances of being ready to take full advantage of their schooling
Recommend potential action by government and other institutions to reduce poverty and enhance life chances for the least advantaged, consistent with the Government’s fiscal strategy
Although a final report is yet to be published some of the work and findings of the review have been reported since its launch. The review is looking closely at the
importance of the early years - and it is likely to recommend that government broadens its objectives by making the early years a priority and adopts a new measurement of life opportunities for children at age 5 (or Index of Life Chances). Mr Field recently stated:
In the two progress reports I have already submitted to the Prime Minister, I make out
the case for the government to use the report to sketch out a new vision of a society
the Government invites the country to create. It will be one that is based on expanding
the life opportunities of the poorest so that the traditional supply routes to poverty are
most firmly cut17.
The closing date for submissions to the Review was 1 October. Mr Field is due to present the Review’s final report to the Prime Minister in December.
The following section of this paper reports on some interesting findings about poverty and life chances emerging from an ongoing study of children in the UK.
4.3 New research – the Millennium Cohort Study
The Millennium Cohort Study (MCS) is a study of the lives of 19,000 children born in the UK in 200018. This cohort of children is being tracked throughout their early childhood and on into adulthood allowing the researchers to examine their
development at various ages – and in the light of the information collected about them at earlier points in time. It covers a wide range of topics such as parenting, childcare, child behaviour and cognitive development, child and parental health, parent’s employment and education, income, housing and neighbourhood.
17
Speech 14 October 2010 Poverty Review
18 The sample population for the study was drawn from all live births in the UK over 12 months from 1 September 2000 in
A research report by academic authors and commissioned by OFMDFM called The Consequences of Childhood Disadvantage in Northern Ireland at age 519 presents findings from the Millennium Cohort study about poverty and life chances of children in Northern Ireland. The study aimed to unpick the relationship between child poverty and child outcomes, to see how far background factors and modifiable behaviours could explain the results. The researchers were also looking out for any explanatory factor which may be particularly prevalent in Northern Ireland compared to other countries in the UK.
When the children were 5 new data were collected, for example, the cognitive abilities, behavioural development and educational development of the children were assessed, and an assessment of health was provided by the mother.
Key findings were:
Children in Northern Ireland did better on average than those in GB at age 5 on almost all of the outcomes measured. The authors put this down to the poorer outcomes in England.
Households in Northern Ireland were more likely to be below the poverty line than those in GB. The respondents in Northern Ireland were also relatively disadvantaged in terms of social class and education.
The respondents in NI rated their local neighbourhoods more highly than respondents in GB
Health related indicators among parents, such as smoking, breastfeeding and BMI were less favourable in NI than in GB.
The cognitive outcomes for children in Northern Ireland were better compared with children in GB. This was attributed to the fact that children in England did less well compared to the other regions, and in the authors opinion this was possibly a consequence of England’s highly urbanised, diverse and unequal society, despite its greater affluence compared to NI.
Children in NI did worse than those in GB on only one outcome –the tendency to be overweight. It was found that the body mass index of parents in NI accounted for this difference observed in the children in NI and GB. The researchers concluded that any policy response needs to encourage healthy lifestyles within the family rather than just focussing on school meals and school activities.
19The Consequences of Childhood Disadvantage in Northern Ireland at age 5 Authors Alice Sullivan et al. Institute of
Education , London. OFMDFM June 2010
Although poverty is a predictor of overweight among children the research revealed that a significant proportion of children who were not poor were also overweight at age 5 (around one in five). Interventions therefore must not be targeted only at poor families.
In their conclusions the authors acknowledge that unpacking the effects of poverty and how childhood disadvantage affects children is a complex task as the various
dimensions of disadvantage are powerfully interrelated.
They found that poverty is linked to all of the outcomes that they considered in the study. Health, overweight and behavioural difficulties are all linked to poverty but measures of social background help explain the influence of poverty on these
outcomes. Cognitive and educational outcomes however, are more strongly structured by poverty.
Parenting factors were found to influence outcomes but did not fully explain the effects of social disadvantage. The authors stressed that a policy focus on parenting alone will therefore be insufficient to tackle the impact of inequalities on children.