This is a repository copy of
Who does what and why? – An aid to stakeholder analysis
.
White Rose Research Online URL for this paper:
http://eprints.whiterose.ac.uk/86613/
Version: Published Version
Monograph:
Blanksby, J.R. (2013) Who does what and why? – An aid to stakeholder analysis. Report.
[email protected] https://eprints.whiterose.ac.uk/ Reuse
Unless indicated otherwise, fulltext items are protected by copyright with all rights reserved. The copyright exception in section 29 of the Copyright, Designs and Patents Act 1988 allows the making of a single copy solely for the purpose of non-commercial research or private study within the limits of fair dealing. The publisher or other rights-holder may allow further reproduction and re-use of this version - refer to the White Rose Research Online record for this item. Where records identify the publisher as the copyright holder, users can verify any specific terms of use on the publisher’s website.
Takedown
If you consider content in White Rose Research Online to be in breach of UK law, please notify us by
Developing a local flood risk management strategy
Annex 3: Who does what and why? An aid to stakeholder
analysis
Pennine Water Group, University of Sheffield in collaboration
with the partners of the FloodResilienCity and MARE projects
Who does what and why
analysis and its benefits
Who does what analysis is a simple tool which helps to build up a picture of what the
stakeholders in any process do. Once completed the results can be used for a number of tasks such as
identifying which stakeholders carry out what tasks and whether they are doing it voluntarily, through statutory powers or through statutory duties. This exercise also identifies the tasks which are not carried out.
Identifying the departmental
responsibilities for the tasks within each stakeholder organisation
identifying what the stakeholder
organisations and departments should be doing if the tasks not currently performed are to be addressed, and to prioritise these based on legislation and resources.
Identifying and improving channels of communication and data flows to minimise the effort in carrying out the task,
identifying the need for raising awareness, improving competencies and building capacity, and
Identifying what changes to policy might be beneficial.
How to do it
The analysis is carried out within a framework which describes tasks which practitioners need to carry out to achieve their goals. In the case of Flood Risk Management, the
framework comprises a grid of different types of water body along one side and a list of topics describing the practice of flood risk management along the other. The different topics are presented in three tables
describing:
Analysis and Assessment
Alleviation and Avoidance, and
Action and Assistance
These three groupings of topics are key to the description of flood risk management. Analysis and assessment bring objectivity to all the tasks. Alleviation and Avoidance measures are applied to reduce the risk of flooding and
Action and Assistance are what are done to reduce the residual risk.
Different approaches to the
process
The approach to who does what and why analysis is flexible and can reflect the requirements of any particular group of stakeholders.
One group might like to adopt a top down approach where a group of participants from the main stakeholders meet to identify which stakeholder organisation does what and then each stakeholder organisation can identify which of its divisions does what.
Alternatively the approach could start with individuals analysing what they do and then extending the process to others within their own organisation and then on to others.
Different degrees of complexity
and benefit
To start off, the process can be made very simple while participants get used to what they are doing. All that is needed is for
individuals to put ticks in those cells which are relevant to them. A further degree of
identifying those tasks with are legal duties, those which are legal powers and those which are done voluntarily. This can be taken a step further by identifying the legislation which gives the duties and powers. But the decision is up to the participants.
Application
Application is straight forward. If you want to have a go, just start with the table that is most
D
(such as coastal water when you are five hundred kilometres from the coast) and tick the relevant cells. If you are working as a group make sure that you record which member of the group deals with which cell. If you need to add extra topics, add them. The tables as they stand are a reasonable
representation of flood risk management, but there is always room for improvement.
Similarly you might like to add additional types of water.
You might like to keep a list of different stakeholders and their roles. An additional table is provided for this.
Feedback
If you enhance the tables or think of some advice about how to go about the process, please give us some feedback so we can share it with others.
We would also like to share what you can do with the tables once they are completed.
W
m to have identified them all, so please let us have any ideas. Email to
The tables
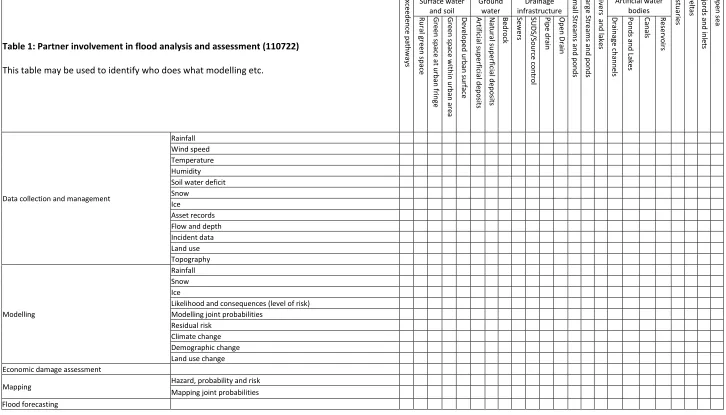
Table 1: Partner involvement in flood analysis and assessment (110722)
This table may be used to identify who does what modelling etc.
E xc e e d e n ce p at h w ay s Surface water and soil Ground water Drainage infrastructure S m al l S tr e am s an d p o n d s La rg e S tr e am s an d p o n d s R iv e rs a n d lak e s Artificial water bodies E st u a rie s D e ltas F jo rd s a n d in le ts O p e n s e a R u ral g re e n s p ac e G re e n s p ac e a t u rb a n fr in g e G re e n s p ac e w ith in u rb a n ar e a D e v e lo p e d u rb a n s u rf ac e A rt ifi cia l s u p e rf ic ial d e p o sit s N at u ral s u p e rf ic ial d e p o sit s B e d ro ck S e w e rs S U D S /S o u rc e c o n tr o l P ip e d rai n O p e n D rai n D rai n a g e c h a n n e ls P o n d s an d L a k e s C an al s R e se rv o ir s
Data collection and management
Rainfall Wind speed Temperature Humidity Soil water deficit Snow
Ice
Asset records Flow and depth Incident data Land use Topography Modelling Rainfall Snow Ice
Likelihood and consequences (level of risk) Modelling joint probabilities
Residual risk Climate change Demographic change Land use change Economic damage assessment
Mapping Hazard, probability and risk
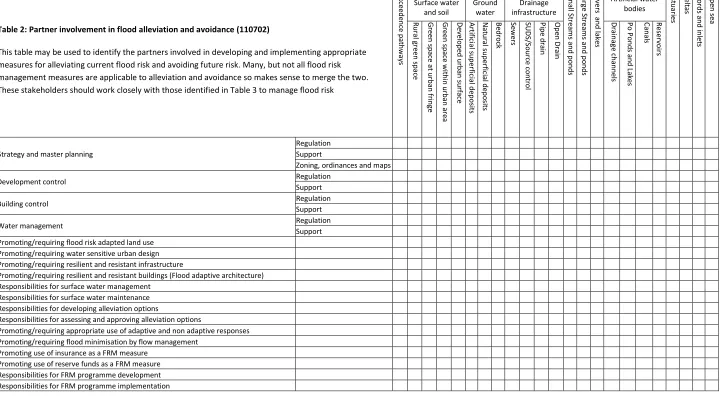
Table 2: Partner involvement in flood alleviation and avoidance (110702)
This table may be used to identify the partners involved in developing and implementing appropriate measures for alleviating current flood risk and avoiding future risk. Many, but not all flood risk management measures are applicable to alleviation and avoidance so makes sense to merge the two. These stakeholders should work closely with those identified in Table 3 to manage flood risk
E xc e e d e n ce p at h w ay s Surface water and soil Ground water Drainage infrastructure S m al l S tr e am s an d p o n d s La rg e S tr e am s an d p o n d s R iv e rs a n d lak e s Artificial water bodies E st u a rie s D e ltas F jo rd s a n d in le ts O p e n s e a R u ral g re e n s p ac e G re e n s p ac e a t u rb a n fr in g e G re e n s p ac e w ith in u rb a n ar e a D e v e lo p e d u rb a n s u rf ac e A rt ifi cial s u p e rf ic ial d e p o sit s N at u ral s u p e rf ic ial d e p o sit s B e d ro ck S e w e rs S U D S /S o u rc e c o n tr o l P ip e d rai n O p e n D rai n D rai n a g e c h a n n e ls P o P o n d s an d L a k e s C an al s R e se rv o ir s
Strategy and master planning
Regulation Support
Zoning, ordinances and maps
Development control Regulation
Support
Building control Regulation
Support
Water management Regulation
Support Promoting/requiring flood risk adapted land use
Promoting/requiring water sensitive urban design Promoting/requiring resilient and resistant infrastructure
Promoting/requiring resilient and resistant buildings (Flood adaptive architecture)
Responsibilities for surface water management
Responsibilities for surface water maintenance
Responsibilities for developing alleviation options Responsibilities for assessing and approving alleviation options
Promoting/requiring appropriate use of adaptive and non adaptive responses Promoting/requiring flood minimisation by flow management
Promoting use of insurance as a FRM measure
Promoting use of reserve funds as a FRM measure Responsibilities for FRM programme development
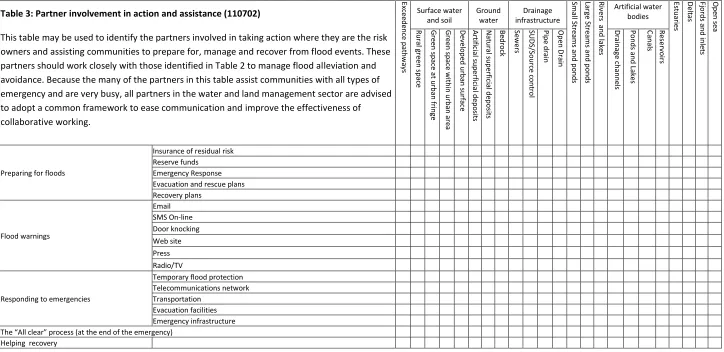
Table 3: Partner involvement in action and assistance (110702)
This table may be used to identify the partners involved in taking action where they are the risk owners and assisting communities to prepare for, manage and recover from flood events. These partners should work closely with those identified in Table 2 to manage flood alleviation and avoidance. Because the many of the partners in this table assist communities with all types of emergency and are very busy, all partners in the water and land management sector are advised to adopt a common framework to ease communication and improve the effectiveness of collaborative working. E xc e e d e n ce p at h w ay s Surface water and soil Ground water Drainage infrastructure S m al l S tr e am s an d p o n d s La rg e S tr e am s an d p o n d s R iv e rs a n d lak e s Artificial water bodies E st u a rie s D e ltas F jo rd s a n d in le ts O p e n s e a R u ral g re e n s p ac e G re e n s p ac e a t u rb a n fr in g e G re e n s p ac e w ith in u rb a n ar e a D e v e lo p e d u rb a n s u rf ac e A rt ifi cial s u p e rf ic ial d e p o sit s N at u ral s u p e rf ic ial d e p o sit s B e d ro ck S e w e rs S U D S /S o u rc e c o n tr o l P ip e d rai n O p e n D rai n D rai n a g e c h an n e ls P o n d s an d L a k e s C an al s R e se rv o ir s
Preparing for floods
Insurance of residual risk Reserve funds
Emergency Response Evacuation and rescue plans Recovery plans Flood warnings Email SMS On-line Door knocking Web site Press Radio/TV
Responding to emergencies
Temporary flood protection Telecommunications network Transportation
Evacuation facilities Emergency infrastructure
T A
Ref. No.
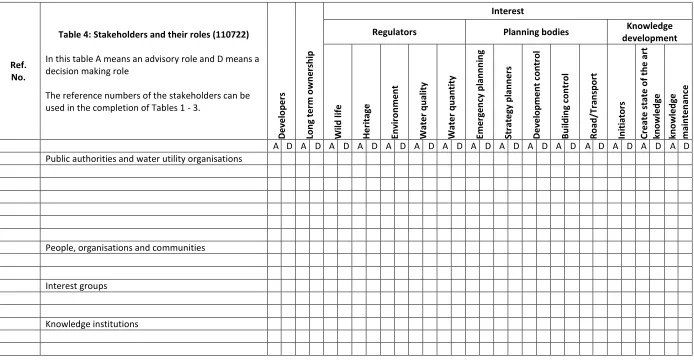
Table 4: Stakeholders and their roles (110722)
In this table A means an advisory role and D means a decision making role
The reference numbers of the stakeholders can be used in the completion of Tables 1 - 3.
D
e
v
e
lo
p
e
rs
Lo
n
g
t
e
rm
o
w
n
e
rs
h
ip
Interest
Regulators Planning bodies Knowledge development
W
il
d
l
if
e
H
e
ri
ta
g
e
E
n
v
ir
o
n
m
e
n
t
W
a
te
r
q
u
a
li
ty
W
a
te
r
q
u
a
n
ti
ty
E
m
e
rg
e
n
cy
p
la
n
n
n
in
g
S
tr
a
te
g
y
p
la
n
n
e
rs
D
e
v
e
lo
p
m
e
n
t
co
n
tr
o
l
B
u
il
d
in
g
c
o
n
tr
o
l
R
o
a
d
/T
ra
n
sp
o
rt
In
it
ia
to
rs
C
re
a
te
s
ta
te
o
f
th
e
a
rt
kn
o
w
le
d
g
e
kn
o
w
le
d
g
e
m
a
in
te
n
a
n
ce
A D A D A D A D A D A D A D A D A D A D A D A D A D A D A D Public authorities and water utility organisations
People, organisations and communities
Interest groups
Examples
The following examples show how the tables can be completed by differing groupings of stakeholders.
Table 1 was completed by a group of staff from Sheffield City Council a partner in the MARE project, to show what activities the City council do. In addition it shows their view on what other stakeholders do
Table 2 was completed by participants from Hoogheemraadschap Hollands Noorderkwartier, the water authority for the area of North Holland which lies to the north of the North Sea Canal and a partner in the SKINT project
Table 3 was completed by Stadtwerke Mainz a partner in the FRC project in its role as developer in the regeneration of the Custom Harbour site by the River Rhine
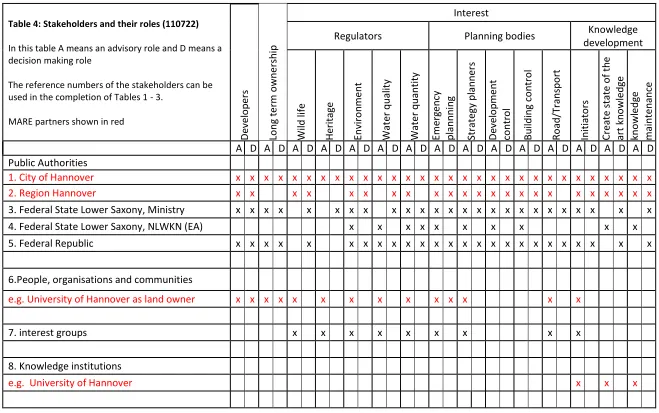
Table 4 was completed by participants from the City of Hannover, The Hannover Region and the Hannover Water Company which is owned by the city. The table identifies the role of all the main stakeholders in the flood risk management process within Hannover and partners in the MARE project
These examples show the different degrees of complexity that have been used and include bottom up and top down approaches.
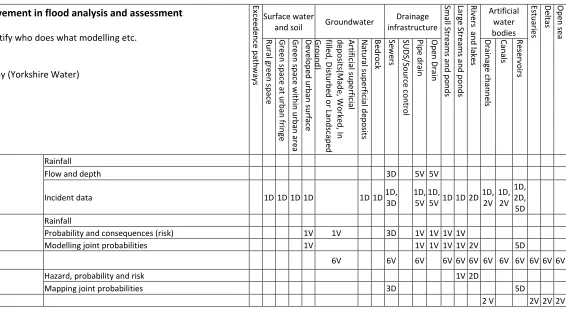
Table 1: Stakeholder involvement in flood analysis and assessment
This table may be used to identify who does what modelling etc. 1 Sheffield City Council
2 - Environment Agency
3 - Water and Sewage Company (Yorkshire Water) 4 - English Heritage
5 Landowners
6 Insurance companies D Duty
P Power V - Voluntary
E xc e e d e n ce p ath w ay s Surface water
and soil Groundwater
Drainage infrastructure S m al l S tr e am s an d p o n d s Lar g e S tr e am s a n d p o n d s R iv e rs an d lak e s Artificial water bodies E stu ar ie s D e ltas O p e n s e a R u ral g re e n s p ac e G re e n s p ac e at u rb an fr in g e G re e n s p ac e w ith in u rb an ar e a D e v e lo p e d u rb a n s u rf ac e A rt ifi cial s u p e rf ic ial d e p o sit s( Mad e , W o rk e d , In fil le d , D is tu rb e d o r L an d sc ap e d G ro u n d ) N atu ral s u p e rf ic ial d e p o sit s Be d ro ck S e w e rs S U D S /S o u rc e c o n tr o l P ip e d rai n O p e n D rai n D rai n ag e c h a n n e ls C an al s R e se rv o ir s
Data collection and management
Rainfall
Flow and depth 3D 5V 5V
Incident data 1D 1D 1D 1D 1D 1D 1D,
3D 1D,
5V 1D,
5V 1D 1D 2D 1D, 2V 1D, 2V 1D, 2D, 5D Modelling Rainfall
Probability and consequences (risk) 1V 1V 3D 1V 1V 1V 1V
Modelling joint probabilities 1V 1V 1V 1V 1V 2V 5D
Economic damage assessment 6V 6V 6V 6V 6V 6V 6V 6V 6V 6V 6V 6V
Mapping Hazard, probability and risk 1V 2D
Mapping joint probabilities 3D 5D
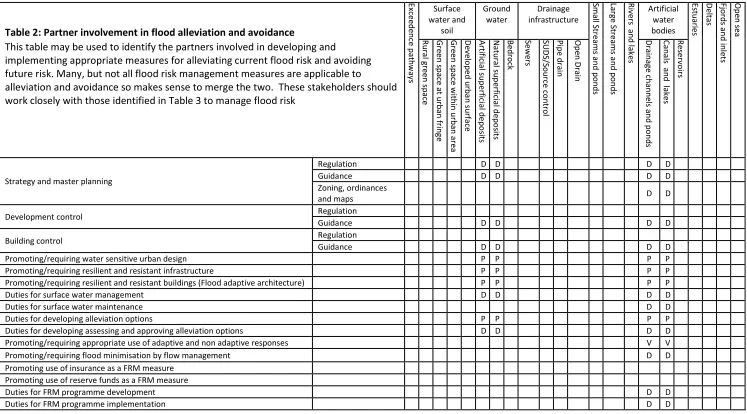
Table 2: Partner involvement in flood alleviation and avoidance E xc e e d e n ce p ath w ay s Surface water and soil Ground water Drainage infrastructure S m al l S tr e am s an d p o n d s Lar g e S tr e am s a n d p o n d s R iv e rs an d lak e s Artificial water bodies E stu ar ie s D e ltas F jo rd s an d in le ts O p e n s e a
This table may be used to identify the partners involved in developing and
implementing appropriate measures for alleviating current flood risk and avoiding future risk. Many, but not all flood risk management measures are applicable to
alleviation and avoidance so makes sense to merge the two. These stakeholders should work closely with those identified in Table 3 to manage flood risk
R u ral g re e n s p ac e G re e n s p ac e at u rb an fr in g e G re e n s p ac e w ith in u rb an ar e a D e v e lo p e d u rb a n s u rf ac e A rt ifi cial s u p e rf ic ial d e p o sits N atu ral s u p e rf ic ial d e p o sit s Be d ro ck S e w e rs S U D S /S o u rc e c o n tr o l P ip e d rai n O p e n D rai n D rai n ag e c h a n n e ls an d p o n d s C a n al s an d l ak e s R e se rv o ir s
Strategy and master planning
Regulation D D D D
Guidance D D D D
Zoning, ordinances
and maps D D
Development control Regulation
Guidance D D D D
Building control Regulation
Guidance D D D D
Promoting/requiring water sensitive urban design P P P P
Promoting/requiring resilient and resistant infrastructure P P P P
Promoting/requiring resilient and resistant buildings (Flood adaptive architecture) P P P P
Duties for surface water management D D D D
Duties for surface water maintenance D D
Duties for developing alleviation options P P P P
Duties for developing assessing and approving alleviation options D D D D
Promoting/requiring appropriate use of adaptive and non adaptive responses V V
Promoting/requiring flood minimisation by flow management D D
Promoting use of insurance as a FRM measure
Promoting use of reserve funds as a FRM measure
Duties for FRM programme development D D
Table 3: Partner involvement in assistance
This table may be used to identify the partners involved in assisting communities to prepare for, manage and recover from flood events. These partners should work closely with those identified in Table 3 to manage flood alleviation and avoidance. Because the partners in this table assist communities with all types of emergency and are very busy, all partners in the water and land management sector are advised to adopt a common framework to ease communication and improve the effectiveness of collaborative working.
E xc e e d e n ce p ath w ay s Surface water
and soil Groundwater
Drainage infrastructure S m al l S tr e am s an d p o n d s Lar g e S tr e am s a n d p o n d s R iv e rs an d lak e s Artificial water bodies E stu ar ie s D e ltas F jo rd s an d in le ts O p e n s e a R u ral g re e n s p ac e G re e n s p ac e at u rb an fr in g e G re e n s p ac e w ith in u rb an ar e a D e v e lo p e d u rb a n s u rf ac e A rt ifi cial s u p e rf ic ial d e p o sit s( Mad e , W o rk e d , In fil le d , D is tu rb e d o r L an d sc ap e d G ro u n d ) N atu ral s u p e rf ic ial d e p o sit s Be d ro ck S e w e rs S U D S /S o u rc e c o n tr o l P ip e d rai n O p e n D rai n D rai n ag e c h a n n e ls C an al s R e se rv o ir s
Preparing for floods y
Flood warnings
Email SMSOn-line Door knocking
Responding to emergencies Temporary flood protection y
Emergency operations
T A Entscheidung treffen: Gefahr vorbei (alles klar)
Table 4: Stakeholders and their roles (110722)
In this table A means an advisory role and D means a decision making role
The reference numbers of the stakeholders can be used in the completion of Tables 1 - 3.
MARE partners shown in red
D
e
v
e
lo
p
e
rs
Lo
n
g
t
e
rm
o
w
n
e
rs
h
ip
Interest
Regulators Planning bodies Knowledge
development
W
il
d
l
if
e
H
e
ri
tag
e
E
n
v
ir
o
n
m
e
n
t
W
at
e
r
q
u
al
ity
W
ate
r
q
u
an
ti
ty
E
m
e
rg
e
n
cy
p
lan
n
n
in
g
S
tr
ate
g
y
p
la
n
n
e
rs
D
e
v
e
lo
p
m
e
n
t
co
n
tr
o
l
B
u
il
d
in
g
c
o
n
tr
o
l
Ro
ad
/T
ran
sp
o
rt
In
iti
ato
rs
C
re
ate
s
tat
e
o
f
th
e
ar
t
k
n
o
w
le
d
g
e
k
n
o
w
le
d
g
e
m
ai
n
te
n
an
ce
A D A D A D A D A D A D A D A D A D A D A D A D A D A D A D Public Authorities
1. City of Hannover x x x x x x x x x x x x x x x x x x x x x x x x x x x x x x
2. Region Hannover x x x x x x x x x x x x x x x x x x x x x x x
3. Federal State Lower Saxony, Ministry x x x x x x x x x x x x x x x x x x x x x x x x x
4. Federal State Lower Saxony, NLWKN (EA) x x x x x x x x x x
5. Federal Republic x x x x x x x x x x x x x x x x x x x x x x x x x
6.People, organisations and communities
e.g. University of Hannover as land owner x x x x x x x x x x x x x x
7. interest groups x x x x x x x x x
8. Knowledge institutions