Agglomeration and Innovation
The Harvard community has made this
article openly available. Please share how
this access benefits you. Your story matters
Citation
Carlino, Gerald, and William R. Kerr. "Agglomeration and
Innovation." Harvard Business School Working Paper, No. 15-007,
August 2014.
Citable link
http://nrs.harvard.edu/urn-3:HUL.InstRepos:13360117
Terms of Use
This article was downloaded from Harvard University’s DASH
Copyright © 2014 by Gerald Carlino and William R. Kerr
Working papers are in draft form. This working paper is distributed for purposes of comment and discussion only. It may not be reproduced without permission of the copyright holder. Copies of working
Agglomeration and
Innovation
Gerald Carlino
William R. Kerr
Working Paper
15-007
Agglomeration and Innovation
Gerald Carlino and William R. Kerr
August 2014
Abstract: This chapter reviews academic research on the connections between agglomeration and
innovation. We first describe the conceptual distinctions between invention and innovation. We then describe how these factors are frequently measured in the data and some resulting empirical regularities. Innovative activity tends to be more concentrated than industrial activity, and we discuss important findings from the literature about why this is so. We highlight the traits of cities (e.g., size, industrial diversity) that theoretical and empirical work link to innovation, and we discuss factors that help sustain these features (e.g., the localization of entrepreneurial finance).
JEL: J2, J6, L1, L2, L6, O3, R1, R3
Keywords: Agglomeration, clusters, innovation, invention, entrepreneurship.
Author institutions and contact details: Carlino: Federal Reserve Bank of Philadelphia,
[email protected] (corresponding author); Kerr: Harvard University, Bank of Finland, and NBER, [email protected].
1. Introduction
This chapter summarizes the recent literature on agglomeration and innovation and how it relates to
economic performance and growth. It is well established that population and economic activity are
spatially concentrated. We also know that innovation is more spatially concentrated than manufacturing
employment (Audretsch and Feldman, 1996), and there is evidence that research and development (R&D)
activity is more concentrated than employment (Carlino et al., 2012). Why is innovative activity
clustered? What is the best way to measure this concentration? What is the economic impact of this
concentration? These and related questions are taken up in this chapter.
The second section of this chapter begins with a discussion of invention vs. innovation and how these
forces are measured. The third section quickly reviews patterns of innovation and agglomeration. The
fourth section describes formal theories linking agglomeration and innovation. Particular attention is
naturally paid to the role of knowledge spillovers in local areas, and we devote extra attention to
describing recent work to quantify these relationships. This section also makes connections to the models
developed in endogenous growth theory. The fifth section discusses research on additional factors that
work to sustain agglomeration clusters, link global clusters together, promote large vs. small company
innovation, and similar phenomena. The last section concludes. In the last section, and at several points
throughout the chapter, we highlight areas for future research that we see important.
Several key themes weave their way through our review:
Innovation comes in many shapes and sizes, except in economic studies—The next section
provides quick definitions of invention vs. innovation vs. commercialization, describes
underlying varieties like exploration vs. exploitation research or product vs. process work, and so on. Most nuance is then forgotten as the substantial majority of theoretical and empirical studies consider single-dimension outcomes like patents. We hope future research develops a richer accounting of the variations of innovation and how they related to the traits of clusters. We do not pretend that this will be easy, due in part to data constraints. More importantly, ad hoc collection of facts will not be very useful, but instead we need a structure of innovation outcomes and how they relate to local traits.
Agglomeration theories apply “doubly so” for innovation clusters, but often lack empirical confirmation—Our chapter walks through various mechanisms and models that have been
adjacent fields (e.g., entrepreneurial finance). This porous boundary reflects the complex nature of innovation and requires researchers span a larger domain in their work.
Moving to the frontier in terms of the urban economics toolkit—Empirical measurement in urban
economic studies has made substantial strides forward in the last two decades. Two prominent examples are the use of continuous-distance metrics for measuring economic activity and the development of micro-record datasets for studying economic and social interactions at detailed levels. Research related to innovation clusters is moving towards this empirical frontier, but the gap is not yet fully closed.
Globalization of innovation—The last part our chapter describes some key research opportunities
and we emphasize one here. We have assembled evidence about innovative clusters within countries, and separate lines of economic research consider flows of activity across countries. Increasingly, research in this area is merging these fields by considering the connections of clusters across countries (e.g., the particular flows of activity from Bangalore or Seoul to Silicon Valley). With the ongoing globalization of innovation, theoretical and empirical refinements of this work are very important.
Our review focuses equally on highlighting classic studies with the identification of recent contributions.
Previous reviews like Audretsch and Feldman (2004) and Feldman and Kogler (2010) contain more
extensive documentation of the older literatures. Our review also seeks to highlight where research on
innovation in economic geography is now connecting with adjacent fields. This has been a very active
research area over the last decade and will continue to be so for some time to come.
2. What is innovation?
This section introduces and distinguishes the concepts of innovation and invention. We describe the
typical datasets used to study the phenomena and some of the relevant advantages and limitations that
researchers should be aware of.
2.1 Distinguishing invention from innovation
It has become popular for researchers and policymakers to talk about the role innovation plays in
economic growth. But, what is innovation and how does it differ from invention? According to OECD’s
Oslo Manual (2005):
An innovation is the implementation of a new or significantly improved product (good or
service), or process, a new marketing method, or a new organizational method in business
practices, workplace organization or external relations.
Invention is a term often used interchangeably with innovation. But, invention is a separate item in the
Creating something new that has never existed before.
Schumpeter (1939, pp. 84-86), made a clear distinction between invention and innovation:
The making of the invention and the carrying out of the corresponding innovations are,
economically and sociologically, two entirely different things. They may, and often have been,
performed by the same person; but this is merely a chance coincidence which does not affect the
validity of the distinction. Personal aptitude—primarily intellectual in the case of the inventor,
primarily volitional in the case of the businessman who turns the invention into an innovation—
and the methods by which the one and the other work, belong to different spheres.
For Schumpeter, invention is the creation of a new product, service, or process, whereas innovation is the
commercialization or introduction of that product or service into the market. Many inventions are
patented, but most patents never reach the point of commercialization, and some that do often require a
long gestation period. On the other hand, innovations are closely linked to commercialization and often
do not require corresponding invention or patents. Innovation takes place when something new or
different is brought to fruition. Thus, conceptually and partly by definition, innovation has an immediate
effect on welfare through the introduction of new products and the improvements in existing products,
often yielding a direct effect on regional and national growth.
Despite these nuances, most researchers do not distinguish invention and innovation. Intuitively,
invention seems to be an antecedent of innovation, but the conceptual basis for separating them is not so
absolute as both are necessary and complementary factors in the advancement of technology (Scherer,
1986). This perspective suggests that the concept of innovation has two parts: the generation of ideas, and
the conversion of these ideas into useful commercial applications. This is the sense in which most current
researchers use the term innovation. For example, the National Science Foundation defines innovation as
“a series of steps that begins with imagination, and results in the creation of something of value for society.”1
Despite this blurred boundary, regions within countries represent an important instance in which the
distinction between invention and innovation has economic and policy relevance. A region’s growth
depends upon the successful commercialization of new products and processes more so than on invention.
The idea for a new product may have occurred in one city, but the commercialization of that product may
1
take place in an entirely different location. Thus, the benefits from local public subsidies for basic
research may not stimulate growth in targeted communities, except for creating a few jobs for scientists
and engineers.
While these distinctions between invention and innovation are important, our review generally focuses on
the more inclusive definition of innovation. Likewise, this chapter will consider evidence related to
knowledge transfer and spillovers more broadly. While these forces clearly extend beyond innovation per
se, findings from studies of innovation are often used to describe knowledge flows, and vice versa.
2.2 Types of innovation
Innovation can take many forms. At one level, the results from innovative efforts can be physical or
abstract, such as computer programs or new business methods vs. a higher-definition TV. As we depict in
Section 2.3, our ability to measure these advances differs across fields and over time. At a second and
arguably more important level, innovation is a very broad term that includes multiple types of efforts. The
types of advances sought by start-up companies can be quite different from those pursued by large
universities or corporate R&D labs. The theoretical and empirical literature tends to lump everything
together, as our review later conveys, but it is important to outline some of the distinctions made.
The oldest distinction is between incremental and radical innovation. Incremental innovation, sometimes
called Usherian innovation, refers to variations on a theme, involving a learning process through
cumulative experience and experimentation (Usher, 1929). One example of Usherian innovation is the
introduction of the electronic ignitions that replaced the mechanically-timed ignition used to ignite a
fuel-air mixture in the internal combustion engine. Alternatively, radical innovation, sometimes called
Schumpeterian or disruptive innovation, is trend-breaking and renders existing products or methods
obsolete (Schumpeter, 1934, 1939; Christensen, 1997). For example, the transistor transformed the way
people listened to music because the transistor led to the miniaturization of the radio, thereby making it
portable.
A second distinction focuses on product vs. process innovation (e.g., Cohen and Klepper, 1996b). Product
innovation refers to a new or improved product, whereas process innovation represents an improvement
in a firm’s production technology. Innovation also encompasses the introduction of existing products to
new locations. A third distinction, which relates to product-process separation, focuses on whether
innovations are internal vs. external to the firm, also known as exploration vs. exploitation (e.g., March,
Similar to the distinction between innovation and invention, these differences will mostly fade to the
background for the rest of this review. This is not desirable, but instead reflects the very limited degree to
which these distinctions have been made in an economic geography context. We describe the available
studies where applicable, but much more work needs to be done in this vein as agglomeration will
interface in quite different ways with various forms of innovation. For example, Duranton and Puga
(2001) find evidence that French entrepreneurs tend to develop prototypes for new products in diversified
cities, and that these businesses relocate to cheaper specialized locations for mass production once the
products are sufficiently mature. This process would suggest that the innovation in diversified cities
would be systematically different from that in specialized locations.
2.3 Measuring innovation
Most studies measure technological innovation in one of three ways: (1) by the inputs used in the
innovation process, such as R&D expenditures or venture capital (VC) investment; (2) by intermediate
outputs of the innovation effort, such as the number of patents; or (3) by some final measure of innovative
work, such the count of new product announcements. Each measure has strengths and weaknesses that are
outlined below. Studies on innovation tend to use a single indicator of innovation and argue that the
chosen measure has fewer shortcomings than other measures.
2.3.1 Investments in the innovation process
Given the scarce data on innovative output, early studies frequently used R&D employment and
expenditures as a measure of innovative activity. These factors certainly reflect innovative effort, and
Feldman (1994, pp. 30-31) provides references to these studies. This approach has lost some favor over
time, however, since input-based measures do not capture the efficiency of the innovation process.
Moreover, newer measures like patent data are easier to access and more granular, providing greater
empirical traction, including the qualitative importance of the innovations produced. R&D data are
particular difficult to collect at the local level except through confidential surveys like the NSF R&D
Survey.2
While R&D expenditures are less frequently used, a surge of work today considers VC investment by
area as a metric for how innovative different regions are. VC firms fund innovative start-up companies in
return for equity, with Gompers and Lerner (2006) providing a full introduction. Conceptually, VC-based
2
metrics again reflect an input into the innovative process, rather than an output or end goal. One
advantage of VC-based measures is that they are now available at the micro-level through sources like
Venture Xpert. Similar to the patent data described next, this affords researchers extensively flexibility in
metric design. The central challenge for metrics based upon VC activity is that these investments are
concentrated in specific technological areas (e.g., computers, software, biotech) and types of firms (e.g.,
younger start-ups), thus being quite incomplete for describing innovation broadly.
2.3.2 Patents and citations
Most regional studies use patent data to measure innovation, and we accordingly devote more attention to
the strengths and limitations of the patent data. Essentially, a patent constitutes a legal right to exclude
others from making, using, or selling the patented invention or process for some period of time. Patents
provide the economic incentives for inventors to pursue new opportunities by granting a temporary
monopoly to successful efforts. To qualify for patent protection, an invention must be deemed useful
(utility), new (novelty), and a non-obvious extension of the prior art (non-obviousness).
A patent publication contains a description of the invention, the inventors, the institution (e.g., firm,
university) to which the patent is assigned, references (citations) to related inventions or techniques,
claims that define the rights of the new invention, and much more. The United States Patent and
Trademark Office (USPTO) granted over 250,000 patents per annum in the last few years. Hall et al.
(2001) provide more details about these data, and Griliches (1990) surveys the use of patent data for
measures of technological change.
Advantages: An advantage of patents over R&D expenditures is that they are a direct outcome of the
inventive process. Moreover, patent data are available in full (for what is patented) and not subject to
confidentiality restrictions or suppressed information. Patent data are released at the micro-level, and thus
researchers can use the granularity to describe inventive activity in great detail (e.g., isolating Microsoft’s
patents from a specific city in a specific technological area). Due to recent efforts to digitize historical
records, patent data are now available over long time periods. These advantages and easy access make
patent data the most-used empirical approach.
Disadvantages: One concern with using patents as a measure of innovation is that patents reflect the first
stage of innovation, that is, invention. To what extent is the location where an invention takes place
coincident with successful commercialization of the invention? Feldman (1994) finds a correlation of 0.8
is positive and moderately high, Feldman and Kogler (2010) nonetheless stress that “studies that draw
inferences about innovation by focusing on invention should be interpreted with caution.”
Another concern about using patents as an innovation indicator is that the value of patents is very highly
skewed. Most patents are not worth very much, while a few are very valuable (e.g., Harhoff et al., 1999).
If a patent has value, we would expect it to be renewed before the patent expires. Serrano (2010)
calculates that 78 percent of U.S. patents granted during 1983 to 2001 were not renewed, indicating that
the majority of patents are of low value. In the words of Griliches (1979) and Pakes and Griliches (1980,
p. 378), “patents are a flawed measure (of innovative output) particularly since not all new innovations
are patented and since patents differ greatly in their economic impact.” In addition, patent owners often
obtain patents on close substitutes for their patent in an attempt to block follow-on patenting by rival
inventors. Rather than adding value, these “patent fences” are strategic and thus skew innovation
measures.
Fortunately, researchers can adjust for patent quality in their innovation metrics by weighting patents by
the number of citations it receives, similar to what economists do with journal articles. Most researchers
exclude self-citations from these counts (i.e., a Microsoft patent that cites another Microsoft patent). An
important recent practice is to make these measurements relative to each technology category and
application year to adjust for differences in propensities to cite across fields and the truncation biases in
citations for the most recent cohorts. As we describe further below, citations are also used to model
knowledge spillovers (Jaffe et al., 1993; Carlino et al., 2012; Murata et al., 2014).
There are naturally worries about what is not patented. Based on a 1994 Carnegie Mellon University
survey of almost 1,500 industrial R&D labs in the United States, Cohen et al. (2000) report that firms
typically use a number of mechanisms to protect their returns to invention. In the majority of
manufacturing industries, patents are used less frequently than other approaches like trades secrets and
lead-time advantages. Cohen et al. (2000) find that the two most important reasons given by firms for not
applying for a patent are the amount of information disclosed in a patent application and the ease of
legally inventing around a patent. They also report that the cost of patent ligation deters smaller firms
from pursuing patents.3
Another issue is that there are large differences in the propensity to patent across industries. For example,
Cohen et al. (2000) report that firms in the chemicals, drugs, mineral products, and medical equipment
3
industries applied for patents for more than two-thirds of their innovations. In contrast, firms in the food,
textiles, glass, and steel and other metals industries applied for patents on fewer than 15 percent of their
product innovations. Quantitative work considering raw differences across industries in patent rates needs
to proceed with heavy caution, while growth in innovation rates for industries is more secure.
A final consideration relates to the longitudinal adjustment of what forms of technologies are patentable
or not. For example, one of the strongest trends in the USPTO data is the introduction and growth of
software patents. Founded in 1975, Microsoft had just five patents by 1990 and over a billion dollars in
revenue; by 2009, the company held 10,000 patents. More broadly, the rate of patenting for a given set of
inputs slowed in some fields over the last three decades, while it accelerated in others. As cities and
regions differ in their technical and industrial compositions, a worry exists that measurement of changes
in innovation at the city level will be biased or suffer substantial measurement error due to these
underlying forces (e.g., Seattle’s rate of innovation appears to skyrocket, but this is mainly due to changes
in the legal practice of patenting software). Lerner and Seru (2014) further discuss these challenges and
the importance of designing area-based studies to control for the underlying composition of inventive
activity.
2.3.3 Literature-based indicators of innovation
A third approach is broadly referred to as literature-based indicators, since the metrics are based on
product announcements in trade, engineering, and technical publications. Acs and Audretsch (1988),
Audretsch and Feldman (1996), Feldman and Audretsch (1999), and Acs et al. (2002), among others, use
new product announcement data available from the U.S. Small Business Administration (SBA) as an
indicator of innovative activity for state and metropolitan areas in the United States. An advantage that
new product announcement data have relative to R&D expenditures and patents as measures of
innovation is that they document the commercialization of a new product.4
While the new product announcements data are interesting, they are subject to several important
qualifications. First, the data are available only for 1982 and do not allow any follow-up analysis.
According to Acs and Audretsch (1988), the data largely consist of product innovations to the exclusions
of other important types of innovation, such as process, services, and managerial innovations. Another
concern is that the new product announcements tend to be issued by the marketing departments of
companies; therefore, these announcements are not subject to the same scrutiny as are patents to
4
determining the originality and contribution of the product. Also, the announcements data may suffer
from selection bias, as journal editors of trade publications may select innovations that they think are
influential.
In sum, the various indicators of innovative activity have strengths and weaknesses. Few studies that look
at the spatial scope of innovation have used multiple indicators to see if the results are robust to indicator
choice. Is there a strong correlation among the various indicators? Are the findings using patents similar
to those based on R&D expenditures, or with findings based on new product announcement data? One
possibility for future research is to develop a composite indicator based on two or three of the individual
indicators (Hagedoorn and Cloodt, 2003). It is also hoped that the ongoing explosion in data collection
will afford new measures for future studies.
3. Patterns of agglomeration and innovation
There is an abundance of evidence that innovative activity is spatially concentrated. We quickly review
some basic evidence, not attempting to catalogue all of the measurements that have been made. Three
points are generally made: (1) innovation is more concentrated at a point in time than general economic
activity, (2) it appears more localized than other economic forces linked to agglomeration, and (3) there
are some spatial movements of clusters over time, while maintaining concentration.
3.1 Higher degree of spatial concentration at a point in time
Each of the innovation measures discussed in the prior section display substantial spatial concentration.
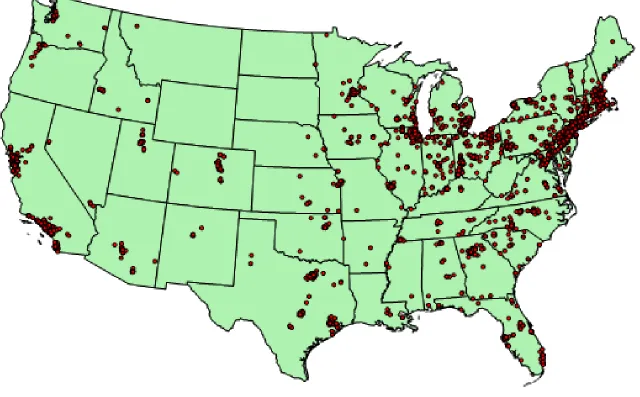
For R&D activity, Buzard and Carlino (2013) show that the spatial concentration of establishments
undertaking R&D efforts is more pronounced than for firms generally. Figure 1 is taken from this study.
Buzard and Carlino (2013) find, in particular, that R&D activity for most industries tends to be
concentrated in the Northeast corridor, around the Great Lakes, in California’s Bay Area, and in southern
California. This concentration is not limited to the United States. For example, Carrincazeaux et al.
(2001) find that six regions in France account for 75 percent of all corporate R&D workers, compared
with 45 percent of the production workers.
VC investments and patents are similarly concentrated as Figure 2 taken from Chatterji et al. (2014)
shows. During the 1990s, three-quarters of the U.S. population resided in metropolitan areas. By contrast,
92 percent of patents were granted to residents of metropolitan areas, and virtually all VC investments
were made into major cities. Bairoch (1988) shows that patent originations tend to be concentrated in
large cities. Fornahl and Brenner (2009) find that patents tend to be concentrated in 11 of the 97 German
In terms of final outputs, Acs et al. (1994) find that the introduction of new products is more spatially
concentrated than patents. Feldman and Audretsch (1999) find that less than 4 percent of the product
innovations took place outside of metropolitan areas, and that half of new product innovations in 1982
occurred in just four metropolitan areas (Boston, New York City, San Francisco, and Los Angeles).
Feldman (1994) attributes this strong concentration of the commercialization of innovation to the need for
specialized business services (e.g., firms specializing in market research and product testing, specialized
patent lawyers, and the availability of financing) and similar infrastructure.
Studies have gone beyond these raw statistics to compare the concentration of innovation to the
underlying spatial concentration of economic activity. Krugman (1991) and Audretsch and Feldman
(1996) use a “locational Gini coefficient” to study the spatial clustering of manufacturing industries. A
locational Gini coefficient shows how similar (or dissimilar) the location pattern of employment in a
given industry is from the location pattern of aggregate employment. Let sij represent location i’s share of
employment in industry j, and xi represent location i’s share of aggregate employment. The spatial Gini
coefficient for industry j is defined as: j ( i ij)2
i
G
x s .G
j
0
indicates that employment in industry jis no more or less spatially concentrated than aggregate employment, and
G
j
0
implies thatemployment in the industry j is over-concentrated. Audretsch and Feldman (1996) apply this approach at
the state level using SBA data.
One problem with the locational Gini coefficient is that it may spuriously indicate localization of an
industry resulting from the lumpiness of plant employment. Ellison and Glaeser (1997) improve on the
locational Gini coefficient by offering an alternative index (the EG index) that controls for the industrial
organization of an industry. Conceptually, the EG index compares the degree of spatial concentration of
manufacturing employment in industry j with what would arise if all plants in the industry were randomly
distributed across locations. Using this approach, Ellison and Glaeser (1997) and Rosenthal and Strange
(2001) find evidence of the geographic concentration of employment in many U.S. manufacturing
industries. While widely adopted in the literature, few studies use the EG index to determine the
agglomerative forces for innovative activity, with one exception being Buzard and Carlino (2013).
The locational Gini coefficient and EG index suffer from important aggregation issues. The first is known
as the modifiable area unit problem (MAUP).5 These metrics depend upon the boundaries used to
5
demarcate regions, and conclusions may differ if counties are used as boundaries vs. states, for example.
MAUP grows in severity as the level of aggregation increases. A related issue is referred to as “border
effects”—each region is considered an exclusive zone and the closeness of regions is not factored in.
Thus, while Philadelphia County and Montgomery County border each other and have activity spilling
across them, they are treated as being as distant from each other as they are from Los Angeles County.
These partitions often lead to underestimations of concentration. Third, the earlier metrics provide index
values but do not assess the statistical significance of their results. Without further statistical analyses, it
is not clear whether the concentrations reported are significantly different from ones that might result
even if the locations of economic activity resulted from random draws. Recently, Cassey and Smith
(2014) have developed a procedure to simulate confidence intervals for statistical tests of EG indices.
In response to these issues, Duranton and Overman (2005) develop a continuous-distance metric that does
not rely on fixed spatial boundaries. This approach provides researchers with a range of scales in
continuous space, rather than at a single pre-defined scale, on which to measure effects. In addition, these
techniques utilize Monte Carlo methods to determine whether the number of plants at a given distance is
significantly different from the number found if their locations were randomly chosen. The power of these
techniques comes with two significant costs. First, researchers must access data on individual plant
locations, which can be challenging. Second, calculation of these metrics takes substantially more time
and computational power.
A number of more recent researchers have used continuous methods to measure the spatial concentration
of innovative activity (e.g., Carlino et al., 2012; Kerr and Kominers, 2014; Murata et al., 2014), which we
recommend. For example, Carlino et al. (2012) use point patent methods (Ripley’s k-function analysis) to
analyze locational patterns of R&D labs over a range of spatial scales (e.g., within a half mile, one mile,
five miles, etc.). This approach allows them to consider the spatial extent of the agglomeration of R&D
labs and to measure how rapidly the clustering of labs attenuates with distance. Importantly, they look for
geographic clusters of labs that represent statistically significant departures from spatial randomness using
simulation techniques. In sum, continuous approaches appear to be the preferred method for measuring
the geographic concentration of innovative activity going forward, although we later discuss how political
boundaries are still found to be important when using these techniques.
3.2 Innovation is more localized than other economic forces linked to agglomeration
Marshall (1890) first elaborated how many different forces give rise to spatial concentration. As we depict
in the next section, innovation is related to multiple Marshallian channels, but it also has the closest
connection with knowledge spillovers. Comparative studies often find that knowledge spillovers operate
at the smallest spatial scales of the types of agglomeration forces. Rosenthal and Strange (2001) regress
the spatial concentration of an industry (based on an EG index) on characteristics designed to measure the
individual forces of agglomeration. The analysis is carried out separately at the zip code, county, and state
levels. They find knowledge spillovers positively affect agglomeration only at the zip code level, with
other forms of agglomeration like labor pooling operating at broader levels. Ellison et al. (2010) exploit
patterns of industry co-location to measure the relative importance of the various mechanisms using
discrete and continuous distance measures. They relate co-agglomeration levels to the extent to which
industry pairs share goods, workers, and knowledge. They find evidence for all three mechanisms, with
knowledge spillovers again the most localized. Using a new metric for analysis of location patterns within
cities, Billings and Johnson (2014) also emphasize co-location for knowledge sharing. Capello and Lenzi
(2014) find that the growth benefits from new knowledge are spatially concentrated when considering 262
regions in the European Union.
Complementing these regional calculations, several studies estimate production functions of spillovers.
This approach again emphasizes the exceptional concentration of knowledge flows and innovative
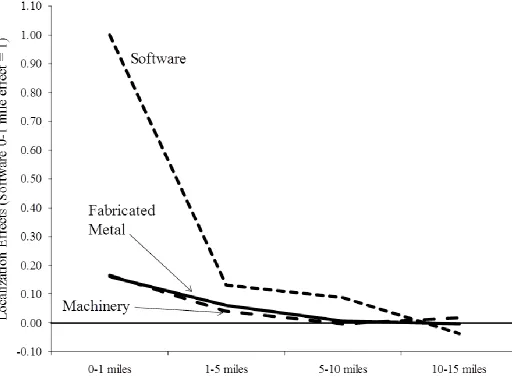
activity. Figure 3 illustrates results presented in a comparative study of software and manufacturing
industries by Rosenthal and Strange (2003). To allow easy interpretation of their findings, the vertical
axis in the exhibit is set such that the spillover benefits in the software industry within one mile are equal
to a value of one; all other spillover effects are measured relative to this value. The horizontal axis shows
the distance between any two establishments in the industry.
For all industries, the localization effects of being near similar businesses decay rapidly with distance
within cities—the positive localization effect from being within one mile of another company in one’s
own industry is at least ten times greater than the positive effect realized when locating two to five miles
away from said company. After five miles, the benefits continue to decay with distance, albeit at a less
dramatic rate. By ten miles, there are no more within-city localization benefits. This statement does not
preclude general spillover effects that all firms within the city enjoy from higher rates of industrial
concentration, but only means that a firm’s specific site within the city no longer governs access to the
benefits. As important for this chapter, Rosenthal and Strange (2003) identify dramatic differentials
and machinery, have a similar shape to the decay function of the software industry. The most dramatic
difference, however, is that the magnitude of spillover effects in the two manufacturing examples tend to
be only 20 percent or so of the software effect at any distance.
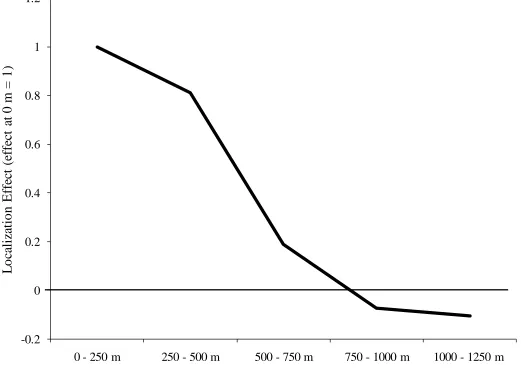
While the declines over the first mile are dramatic in Rosenthal and Strange, they can be even sharper in a
very highly networked industry. Arzaghi and Henderson (2008) study location choices of ad agencies in
Manhattan. They show that for an ad agency, knowledge spillovers and the benefits of networking with
nearby agencies are extensive, but the benefits dissipate quickly with distance from other ad agencies and
are gone after roughly a half-mile. Figure 4 plots the decay function in localization effects using this
study’s results, with the localization effect for ad agencies for 0-250 meters being set equal to a value of
one. The decline in Figure 4 is much more dramatic, with the localization effect losing 80 percent of its
value by the time two firms are 500 meters apart. Rather than the 10 miles of the previous example, the
cluster benefits for ad agencies run out at 750 meters! This study provides one of the sharpest depictions
of tightly concentrated knowledge flows developed to date, and we believe it represents an important
precedent for future research related to innovation more directly. We discuss these features, and
especially studies building upon patents, more as we introduce direct theories in the next section.
While these two approaches—regional-based evidence and production function regressions—end up with
similar conclusions about the rapid attenuation of knowledge flows, they embody very different spatial
scales and are not immediately reconcilable with each other. For example, can city- or county-level
comparisons of software vs. machinery industrial concentration yield much insight if the main clustering
effect in both industries is only over one mile?
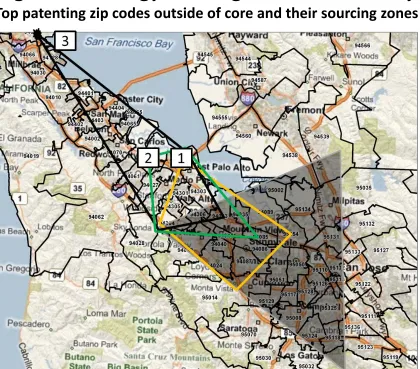
Kerr and Kominers (2014) consider this question using variation across patent clusters. A central element
of their model and empirics is illustrated in Figure 5, which depicts technology flows in Silicon Valley.
Downtown San Francisco and Oakland are to the north and off of the map. The triangle in the bottom
right corner of the map is the core of Silicon Valley. This core contains three-quarters of industrial patents
filed from the San Francisco Bay area and 18 of the top 25 zip codes in terms of patenting. Plotted on the
map are three of the four largest zip codes for patenting in the San Francisco area that are outside of the
core. Each focal zip code is marked with a box, and the other points of the shape are the three zip codes
that firms in the focal zip code cite most in their work. The zone (1) for Menlo Park extends deepest into
the core. The zone (2) for Redwood City shifts up and encompasses Menlo Park and Palo Alto but less of
the core. The zone (3) for South San Francisco further shifts out and brushes the core.
These technology zones are characterized by small, overlapping regions. None of the technology sourcing
even reaches far enough into the core to include the area of Silicon Valley where the greatest number of
patents occur. While technology sourcing for individual firms is localized, the resulting cluster extends
over a larger expanse of land. Kerr and Kominers (2014) utilize this insight to build a model of clusters
comprised of small, overlapping regions. This model reconciles the area-based approaches with the
firm-level analyses by showing that agglomerative forces with longer spillover distances at the firm firm-level yield
macro structures characterized by fewer, larger, and less dense clusters. Kerr and Kominers (2014) find
these predictions empirically hold true when comparing the clusters of different technologies against each
other. Extended out-of-sample, this logic also provides a foundation for why innovation clusters can be
especially concentrated in small geographic regions.
3.3 Spatial movements of clusters over time
While most thoughts of innovation clusters today naturally begin with Silicon Valley, it is important to
recall that innovation clusters do move over time. Lamoreaux et al. (2004) describe the role of Cleveland
as a prominent and frontier hub for innovation related to the second industrial revolution, including early
forms of angel financing and incubators. Klepper (2010) similarly describes how the Detroit of 1900 has
remarkable parallels to Silicon Valley today. Saxenian (1994) also prominently discusses the migration of
the semiconductor industry from Boston’s Route 128 to Silicon Valley in the 1970s and 1980s. Kerr
(2010a) describes the specific movement of technologies to new breakthrough centers following the
Duranton (2007) model. With the development of better long-run patent data, it is hoped that further
regularities can be defined that enhance this case study evidence.
4. Formal theories linking agglomeration and innovation
Often, innovative activity takes place inside industrial clusters, such as in the semiconductor industry in
Silicon Valley, in the financial services and advertising industries in New York City, in the entertainment
industry in Los Angeles, and in the production of country music in Nashville, to name just a few such
clusters. Industrial clusters are not only a source for innovation leading to productivity growth, but they
also tend to stimulate the formation of new businesses, leading to ongoing growth in entrepreneurial
activity (Porter, 1998).
How do we account for this geographic concentration of innovative activity? Much of the theoretical
services rather than on invention itself. Nevertheless, the three formal mechanisms primarily explored in
this literature—sharing, matching, and knowledge spillovers—are also relevant for innovative activity.6
This section discusses models and evidence on these traditional channels as they relate to innovation. The
next section will discuss additional topics and adjacent fields that are more specific to innovation
processes. We argue in this section that the traditional Marshallian externalities, even beyond knowledge
spillovers, are especially important for the spatial concentration of innovative activity, over and above
that evident for production. In addition, the “natural advantages” of an area, such as its unique culture and
intuitions, explain the location of some innovative activity (Saxenian, 1994).
This chapter focuses mostly on evidence related to innovative clusters and local interactions across firms.
These firms are usually presumed to be of small size relative to local aggregate activity, taking the local
conditions around them as given. In Section 5, we return to this question and discuss research on whether
innovation is concentrated in a single large firm, spread across many local firms, or something in
between.
For this setting, an innovation production function is a convenient way to demonstrate the effects that
these agglomeration forces have on innovative activity:
I
ic
g A F RD K
(
c) (
ic,
ic)
, where I indexesinnovative output of firm i in city c, and RD and K represent R&D and human capital usage, respectively,
by firm i, and
g A
(
c)
represents agglomeration economies that are external to firm i but internal to the firm’s city.7If firm i wanted to double its production of I, it could do so by doubling RD and K.
Importantly, it is not necessary to double agglomeration economies in the city. If the agglomeration
economies also doubled, production of I would more than double.
One baseline empirical strategy is to model
g A
(
c)
as a function of urban size or density. This is roughlythe approach taken by Carlino et al. (2007) who find that the rate of patenting per capita—or patent
intensity—is about 20 percent higher in a metropolitan area with twice the employment density (jobs per
square mile) of another metro area.8 While this elasticity is interesting, the approach does not tell which of the mechanisms are responsible for the increased patenting activity found in denser locations, or
6 These themes are developed by Duranton and Puga (2004). Marshallian economies are often expressed as
customer-supplier linkages, labor pooling, etc., and Duranton and Puga (2004) describe the theoretical advantages from formulating their common principles as sharing, matching, etc. Recent surveys of the empirical literature on agglomeration economies include Eberts and McMillen (1999) and Rosenthal and Strange (2004), and Combes and Gobillion (2014) provide a comprehensive update in this handbook.
7
See Audretsch and Feldman (2004) for further discussion of knowledge production functions in a regional setting.
8
anything about the relative importance of the various mechanisms; this requires theoretical models of how
each of the mechanisms operate. We consider each in turn using the Duranton and Puga (2004) taxonomy.
4.1 Sharing
The sharing of common inputs depends on the existence of economies of scale in the production of these
inputs at a given location. Thick factor markets can arise when innovative activity clusters locally. These
clusters allow each of its members to benefit as if it had greater scale (Porter, 1998). Thick local markets
allow for the efficient sharing of a variety of specialized inputs and access to a pool of specialized and
experienced workers and to a variety of specialized business services (e.g., patent attorneys, commercial
labs for product testing, and trade organizations). Knowledge can flow rapidly through these linkages
(Porter, 1990). The ability to outsource locally allows firms to lower production costs by maintaining
leaner inventories, and Porter (1998) argues this effect is especially important for “advanced and
specialized inputs involving embedded technology, information, and service content.” Industrial clusters
allow members to experiment at lower costs and, if they decide to innovate, firms can externally source
what they require to quickly implement their innovations.
Helsley and Strange (2002) develop an interesting dynamic model of innovation in which a dense
network of input suppliers facilitates innovation by lowering the costs needed to bring new ideas to
realization. The model is dynamic, since previous innovations in an area produce inputs that make
entrepreneurs more productive, leading to continuing growth in entrepreneurial activity. Gerlach et al.
(2009) demonstrate that firms invest more in R&D and take greater risk in R&D choices in clusters
compared with spatially isolated firms. They also demonstrate that similar firms choose different R&D
projects when located in clusters, which creates a diversified portfolio of R&D investments.
The benefits that firms in a given industry gain from co-locating are often enhanced using a production
technology based on modularity. Modularity is the method of making complex products or creating
processes from smaller subsystems (modules) that are developed by a network of independent firms.
Under this system, different suppliers are responsible for separate modules with the understanding that
each supplier will follow “design rules” that ensure the modules fit and work together (Baldwin and
Clark, 1997).9 An important aspect of modularity is that innovative activity becomes decentralized across
9Modularity as a method of production has been around for some time. A classic example is automobile
many firms instead of being concentrated in a single vertically-integrated firm. The rate of technical
progress can be enhanced by decentralization, since independent firms can focus more fully on innovation
to their specific components compared with the divided attention each component receives when firms are
vertically integrated. Sturgeon (2002) stresses that modular production allows co-located firms to use the
benefits of spatial proximity to establish and manage global-scale production networks. Using evidence
from case studies and interviews, Saxenian (1991) concludes that Silicon Valley-based computer system
manufacturers became more efficient by spreading the costs and risks associated with the rapid changes in
product designs and technologies by adopting modularity techniques.
In general, there is little empirical evidence on the importance of input sharing for firms engaged in
innovative activity, even if the relationship is intuitive. Feldman (1994) shows that the presence of a local
network of firms in related industries helps to refine new innovations and that the existence of specialized
business services helps firms bring their ideas to fruition. Audretsch and Feldman (1996) find a greater
tendency for innovative activity to co-locate in industries in which skilled labor is an important input. We
discuss later the sharing of common labor pools in more detail.
What is better established is the development and sharing of specialized business services. This has been
especially true with the case of entrepreneurial finance (e.g., angels, VC). Traditional sources of
financing, such as bank loans, may be unavailable to innovative start-ups due to their high risk, large
financing requirements, and asymmetric information, especially in high-tech industries (Gompers and
Lerner, 2001). As a result, VC organizations tend to invest locally in order to monitor their investments
and to provide operating assistance to these firms (e.g., Gompers and Lerner, 2001; Horvath, 2001).
Kolympiris et al. (2011) find VC investment within the biotech sector is particularly concentrated in areas
of a 10-mile radius or less. These investors illustrate input sharing in many ways—their business models
depend upon a certain scale and diversity of local opportunities, the value-added benefits they offer to
portfolio companies frequently stem from this local networking (e.g., introductions to key employees to
hire), and so on.10
theoretical work, Hellmann and Perotti (2011) depict conditions under which innovative ideas are better developed in thick markets of innovative firms vs. within larger organizations.
10
4.2 Matching
A second theory argues that thicker markets improve the quality of matches in local labor markets.
Models that support this theory include Helsley and Strange (1990, 2002), Wheeler (2001), Berliant et al.
(2006), Strange et al. (2006), and Papageorgiou (2013). For example, in Berliant et al. (2006), workers in
large cities can be more selective in forming matches because the opportunity cost of waiting for a
prospective partner is lower. In spite of the fact that people are more selective, on average they form
matches more quickly. As a result, the average output from matches is higher, and a higher share of the
work force is engaged in productive matches. Strange et al. (2006) find that firms with an (exogenous)
uncertain demand for highly specialized workers benefit from locating in specialized industrial clusters,
since these clusters provide a more diverse range of worker skills to meet unforeseen or challenging
opportunities.11
Also, specialized workers can readily find new positions without having to change locations in innovation
clusters. For example, there is evidence of job-hopping in the Silicon Valley (Fallick et al., 2006) and in
software publishing (Freedman, 2008). This research shows that mobility increases with industrial
concentration. Fallick et al. (2006) find much greater mobility of college-educated males employed in the
computer industry in Silicon Valley compared with the interfirm mobility of similarly educated workers
in the computer industry in other areas outside of California. Part of this turnover could be induced as
firms and workers seek better matches. Fallick et al. (2006) moreover describe the important link between
this mobility and the modularity described earlier.12
While labor market pooling may reduce firm costs, leading to greater profit, competition for workers and
worker turnover can have the opposite effect (Matouschek and Robert-Nicoud, 2005; Combes and
Duranton, 2006; Gerlach et al., 2009). Labor market pooling exposes firms to poaching of vital workers
by rival firms and increases labor costs to retain employees. Matouschek and Robert-Nicoud (2005)
analyze the role that investments in human capital have on the location decisions of firms. They show that
whether human capital investments act as a force for or against geographic concentration depends on who
is making the investments. If firms undertake the investment in human capital, they are less likely to
11 Interestingly, Strange et al. (2006) find that when firms are involved with creating new products or processes they
tend to locate in large cities but not in industrial clusters.
12 Mobility could be unusually high in the Silicon Valley because of the unenforceability of noncompete clauses
agglomerate in an attempt to protect their investments from rival firms. Firms are more likely to
agglomerate when workers undertake the investment in human capital.
In the model of Rotemberg and Saloner (2000), workers are more likely to undertake investment in
human capital when firms are agglomerated. In a small labor market, workers who invest in acquiring
skills have weak bargaining power with local employers unless they are willing to undertake costly
relocations. This setting can generate hold-up problems by a monopsonistic employer attempting to
extract the surplus from the workers investments, thereby reducing the original incentive to invest in skill
development. In thick labor markets, the presence of a large number of potential employers mitigates the
hold-up problem.
There is a lack of empirical evidence on these issues, and the endogeneity of location and investment
choices make these models difficult to test. One mentioned route is to exploit exogenous cross-country
differences in legislation requiring firms to provide worker training. For example, German firms are
required to provide some general training for their workers. Evidence for the Matouschek and
Robert-Nicoud (2005) hypothesis would be found if German firms are more dispersed than in countries where
firms are not required to provide such training, all other things equal. Tests might also be feasible through
investments in immigrant workers in settings where the worker is tied to their employer for a period of
time (e.g., the United States’ H-1B program).
4.3 Knowledge spillovers
The third strand of theory argues that the geographic concentration of people and jobs in cities facilitates
the spread of tacit knowledge, which is not easily codified or transferred through written documents.
While the exact mechanism is not well identified in theory, the underlying idea articulated in Marshall
(1890) is that the geographic proximity to knowledge facilitates the transfer of such knowledge as well as
unplanned or serendipitous interactions among individuals fostering the exchange of information among
workers and firms.
Steve Jobs understood thatpeople’sphysical proximity is a key ingredient in the innovative process when
he helped to design the layout of Pixar Animation Studios. The original plan called for three buildings,
with separate offices for animators, scientists, and executives. Jobs instead opted for a single building,
with a vast atrium at its core. To ensure that animators, scientists, and executives frequently interacted
and exchanged ideas, Jobs moved the mailboxes, the cafeteria, and the meeting rooms to the center of the
application of computer graphics to filmmaking. Pixar has also been quite productive, generating 14
feature films that have earned 27 Academy Awards.
Information sharing has become a hallmark of Silicon Valley firms. Facebook, Google, and Twitter, for
example, have designed their work and recreational spaces to enhance the interaction and the sharing of
ideas among workers. Liu (2010) quantifies how the physical layout of a biotech firm shaped its internal
knowledge flows, and Olson and Olson (2003) describe the sharp attenuation of collaboration and
distance. Information sharing is not just a Silicon Valley phenomenon, and the value of face-to-face
contact for innovation has long been recognized. In the 1940s, Bell Labs’ (AT&T’s R&D lab) new
building was specifically designed so that everyone would interact with one another (Gertner, 2012). In
17th-century England, people gathered in coffeehouses to share ideas, with different coffeehouses
attracting specialized clienteles. The London Stock Exchange began life in 1698 in a coffeehouse where
merchants met, while a second coffeehouse frequented by shippers and traders became recognized as the
place to obtain marine insurance and gave rise to Lloyd’s of London.
While theories of knowledge spillovers were originally developed to explain the concentration of
industries in general, they are particularly important in explaining the clustering of innovative activity.
R&D, more than most industries, depends on new knowledge. Often, the latest knowledge about
technological developments is valuable to firms but only for a short time, and the reciprocal exchange of
information among co-located firms engaged in innovation can reduce uncertainty (Feldman, 1994).
Thus, it behooves innovative firms to locate near sources of information and each other.
This extended section reviews knowledge spillovers in three steps. We first outline its connection with
growth theory and some of the economic geography models that have been influential in this context.
These models identify a Mincerian wage relationship that has been frequently used in empirical work, and
the second part highlights this body of work. We then review the large body of work using patents and
other techniques.
4.3.1 Knowledge spillovers and endogenous growth
Solow (1957) shows that the accumulation of physical capital is insufficient for long-run growth of per
capita output. In Solow’s model, the long-run rate of growth of per capita output largely is determined by
an exogenous rate of technical progress, providing no explanation for productivity improvements. Since
the rate of productivity growth is the most important determinant of long-run growth, treating such an
Beginning in the mid-1980s, economists developed theories of endogenous growth in which cities often
play a prominent role. Lucas (1988) emphasizes the role that the stock of human capital in cities plays in
economic growth. While the channels through which knowledge spillovers are transmitted are not well
articulated, the basic idea is that skilled or educated workers are better able to receive new knowledge
from others. The acquisition of knowledge is related to cities since the dense concentration of people and
firms in cities creates an environment in which new ideas travel quickly. Thus, cities facilitate knowledge
spillovers. The idea that the exchange of knowledge among individuals enhances productivity can be
expressed by allowing production to depend on aggregate human capital in a city. Let
Y
ic denote ahomogeneous final good produced by worker i in city c according to:
ic c ic
Y
H h
,where
h
ic represents the human capital of worker i andH
cis aggregate human capital in city. Noticethere are constant returns to scale in the human capital of worker i, and increasing returns associated with
aggregate human capital at the city level. The parameter
reflects the importance of external return inproduction. The aggregate measure of human capital can be expressed as:
1
1 = N
c n ic
H h n
n
,where
h
ic
n
is the human capital of the n-th worker and
is a parameter governing how the amount ofthe human capital of different workers is aggregated to form the city’s stock of human capital. When,
1
the average level of human capital in a city is what matters when creating the externality. When0
, skills of the most talented workers create the externality. If the most talented workers sort into thelargest cities, as Glaeser and Saiz (2004) find, externalities will not be equalized across cities. In most
empirical specifications of Lucas’s model,
1is assumed.Assuming the zero-profit condition holds, one obtains a relationship between the nominal wage of
workers and the aggregate measure of human capital that can be expressed in a Mincerian wage
regression:
where the parameter of interest is
.13 We review below wage-based evidence in this regard. It isimportant to highlight that this specification leaves many open issues. For example, endogeneity bias is an
important concern when estimating
since aggregate schooling may be determined simultaneously withwages. In addition, the specification does not depict whether the learning effect is within industries of
cities or across them. Third, most empirical studies consider quantitative measures of human capital, such
as years of schooling, but differences in the quality of human capital are not captured. A fourth issue with
the above formulation is that the spillovers are static.14 A fifth issue, that we articulate more fully when reviewing these studies, is that factors beyond knowledge spillovers can give rise to these Mincerian wage
regressions, and so evidence derived from these approaches is consistent with knowledge spillovers but
not complete proof of them.
Eaton and Eckstein (1997) embed the human capital accumulation structure of Lucas (1988) within a
system of cities framework. Cities grow at a common rate in equilibrium, with the relative size for a given
city being determined by the environment for learning that city provides. In Eaton and Eckstein (1997)
the agglomeration externality is static. Glaeser (1999) proposes a model with a dynamic externality where
the direct interactions among workers in cities are the basis for accumulation and diffusion of knowledge.
In the model, young and unskilled workers learn through interactions with older and skilled workers.
Cities provide greater opportunity for younger workers to meet and interact with older workers. Black and
Henderson (1999) develop a model of human capital accumulation and population growth in cities. In the
model, human capital externalities make workers more productive in larger cities. Workers devote some
of their time to the accumulation of human capital, which in turn, makes cities more attractive and leads
to population growth. The growth in population, in turn, reinforces the externality in human capital. Black
and Henderson’s (1999) model is comprised of two sectors where cities are specialized in a particular
sector. Although cities differ along a variety of dimensions, all cities grow at the same rate in the
long-run. De la Roca and Puga (2012) use Spanish data on individual worker characteristics and their
employment histories to investigate the urban wage premium and find that workers receive an earnings
premium in larger cities. They also find evidence of a dynamic externality in that workers tend to
accumulate more valuable knowledge in larger cities leading to faster earnings growth.
13
Duranton and Puga (2014) provide a micro-foundation for this model where the externality in human capital arises through entrepreneurship. If entrepreneurs are over-represented in the population of more-educated workers, then cities with relatively more-educated workers will be more entrepreneurial and grow faster. See also Jones (2005).
14 Lucas (1988) proposes a model with dynamic externalities. In Lucas’s models, individuals decide how much time
Most recently, Davis and Dingel (2013) develop a spatial equilibrium framework to show why skill
premiums are higher in large cities. They develop a system of cities model in which the exchange of ideas
is costly and leads to agglomeration economies. The model has tradable and non-tradable goods, labor is
the only factor of production, and idea exchanges are local. Agents allocate their time according to the
expected gains from exchanging knowledge, where the gains are greater in places where prospective
partners are more numerous and of higher ability. Agents with the greatest ability to receive new
knowledge are most willing to pay for this knowledge. This framework leads to cities of various sizes,
with larger cities exhibiting greater skill premiums and productivity and thus offering higher wages, but
also higher housing costs.
In another branch of the literature, Romer (1986, 1990) formalized the relationship between knowledge
and economic growth. Romer divided inputs into two categories: rivalrous inputs and nonrivalrous ideas.
The notion is that once a new design is introduced by one firm, the design is subsequently available to all
other firms. This nonrivalrous nature of knowledge is central for economic growth in Romer’s model.
Consider the constant returns to scale production function of a representative firm i at time t:
1
(
)
it it t itY
K
A L
,where Y indexes the output of firm i, A represents the aggregate amount of knowledge available to all
firms at time t, and K and L are the inputs of capital and labor used by firm i. If firm i wanted to double its
production of Y, it could do so by doubling K and L. Due to the nonrivalrous nature of knowledge, it is
not necessary to double the stock of knowledge. If the stock of knowledge is also doubled, production of
Y would more than double. Therefore, incorporating the stock of knowledge into the production function
leads to increasing returns to scale because of the nonrivalrous nature of knowledge.
One concern is that in a competitive market, once a new idea is discovered, the marginal cost to supplying
the idea to other users is zero. But, private firms undertake costly R&D to profit from this research. It is
unlikely that R&D will be undertaken if a firm cannot profit from this research. Romer (1990) addresses
this problem by treating knowledge as a quasi-public good in that, although new knowledge is
nonrivalrous, the owner of a new idea can exclude others from its use through patents and trade secret
protection, for example. The rents that the owners of patents receive compensate them for the cost of
discovering new ideas.
The idea that patent and trade secret protection gives firms receiving such protection monopoly power
suggests that models that depart from perfect competition are needed. This is accomplished in the
destruction (Aghion and Howitt, 1992; Grossman and Helpman, 1991; Aghion et al., 2014). In these
models, innovation takes place along a “quality ladder” that is driven by temporary monopoly profits that
innovating entrepreneurs require as compensation for the cost of innovating. Every product has its own
current point on a quality ladder and firms undertake R&D to improve the quality of a product. Once a
product is introduced, however, the technology diffuses and rival entrepreneurs can produce the same
quality product at a lower cost and hence offer a lower selling price. Entrepreneurs can recapture market
advantages through innovation, which leads to climbing up the quality ladder.
Kelly and Hageman (1999) and Duranton (2007) extend the quality ladder approach to a regional setting.
In Duranton (2007), cities are composed of industries, and production for an industry is concentrated at
the site of the latest breakthrough invention. When a new discovery takes places for an industry in another
city, the industry relocates to the new center. This quality ladder model provides a solid foundation for
explaining the fast churn of industries across cities, the slower movement of cities up and down the size
distribution (as industry-level shocks are partially netted out), and the stable long-term distribution of city
sizes. Kerr (2010a) provides evidence of the Duranton (2007) model when looking at the locations of the
breakthrough patents by technology field during the 1975-1985 period and the subsequent growth of
technologies across locations. The link of these breakthrough locations to subsequent production is less
established.
While cities have this long-standing theoretical connection to growth, an open question is the quantitative
importance of the externalities associated with human capital in cities for national economic growth.
Duranton and Puga (2014) develop a system of cities models in the tradition of Henderson (1974) and
address this question. Using recent estimates found in the literature for the elasticity of agglomeration
economies and the elasticity of congestion cost with respect to city size, they calculate that cities account
for almost two-thirds of aggregate output growth. While this calibration exercise is tantalizing, it remains
speculative and will hopefully be the groundwork for complete assessments.
One potential pitfall should be noted about the connections between endogenous growth theory and
studies of innovation clusters. Researchers need to think hard about the role of mobility in their setting
and the resulting equilibrium conditions (e.g., Glaeser, 2008). In many core growth models, population is
fixed because the presumed application is to a country, and thus the impact of innovation is pushed
towards the income per capita development. Cities can adjust their population, and the impact of
innovation may come through population growth instead. A full articulation requires thinking about
mobility costs, housing prices, amenities, and similar factors alongside the standard issues like regional