A Basic Probability Assignment Methodology for
Unsupervised Wireless Intrusion Detection
IBRAHIM GHAFIR 1, KONSTANTINOS G. KYRIAKOPOULOS 1,2,
FRANCISCO J. APARICIO-NAVARRO 3, SANGARAPILLAI LAMBOTHARAN 1, BASIL ASSADHAN4, AND HAMAD BINSALLEEH5
1Wolfson School of Mechanical, Electrical and Manufacturing Engineering, Loughborough University, Loughborough LE11 3TU, U.K. 2Institute for Digital Technologies, Loughborough University London, London E20 3BS, U.K.
3Faculty of Technology, De Montfort University, Leicester LE1 9BH, U.K.
4Department of Electrical Engineering, King Saud University, Riyadh 11421, Saudi Arabia
5Department of Computer Science, Al-Imam Muhammad Ibn Saud Islamic University, Riyadh 11432, Saudi Arabia Corresponding author: Ibrahim Ghafir ([email protected])
This work was supported in part by the Gulf Science, Innovation and Knowledge Economy Programme of the U.K. Government under UK-Gulf Institutional Link Grant IL 279339985 and in part by the Engineering and Physical Sciences Research Council (EPSRC), U.K., under Grant EP/R006385/1.
ABSTRACT The broadcast nature of wireless local area networks has made them prone to several types of wireless injection attacks, such as Man-in-the-Middle (MitM) at the physical layer, deauthentication, and rogue access point attacks. The implementation of novel intrusion detection systems (IDSs) is fundamental to provide stronger protection against these wireless injection attacks. Since most attacks manifest themselves through different metrics, current IDSs should leverage a cross-layer approach to help toward improving the detection accuracy. The data fusion technique based on the Dempster–Shafer (D-S) theory has been proven to be an efficient technique to implement the cross-layer metric approach. However, the dynamic generation of the basic probability assignment (BPA) values used by D-S is still an open research problem. In this paper, we propose a novel unsupervised methodology to dynamically generate the BPA values, based on both the Gaussian and exponential probability density functions, the categorical probability mass function, and the local reachability density. Then, D-S is used to fuse the BPA values to classify whether the Wi-Fi frame is normal (i.e., non-malicious) or malicious. The proposed methodology provides 100% true positive rate (TPR) and 4.23% false positive rate (FPR) for the MitM attack and 100% TPR and 2.44% FPR for the deauthentication attack, which confirm the efficiency of the dynamic BPA generation methodology.
INDEX TERMS Basic probability assignment, data fusion, Dempster-Shafer theory, intrusion detection system, local reachability density, network security, probability density function, wireless injection attacks.
I. INTRODUCTION
Over the last two decades, wireless local area networks, based on the IEEE 802.11 standard protocols (Wi-Fi), have become prevalent. Nowadays, most of the personal devices, laptops and smart phones are equipped with wire-less connection capability. Furthermore, since the Inter-net of Things (IoT) has emerged, the number of devices connected to wireless networks is increasing rapidly [1]. Currently, there are more than 20 billion IoT devices con-nected to the Internet, and that number is expected to reach 75 billions by 2025 [2]. Due to the ease of deployment, main-tenance and low cost, these devices have become ubiquitous. Consequently, securing this type of networks has become a priority.
The broadcast nature of Wi-Fi has made the wireless access open to new forms of cyber-attacks against the IEEE 802.11 standard protocol [3]. Any wireless device within the coverage area of the transmitter is able to intercept the communication channel. This provides an opportunity for attackers to eavesdrop and analyze the network communica-tion. Moreover, the capability to inject malicious information into the wireless communication, and the capacity to imper-sonate the identity of legitimate network devices, allow an attacker to launch several types of wireless injection attacks, such as Man-in-the-Middle (MitM) at the physical layer [4], de-authentication [5] and rogue access point [6].
Furthermore, Wi-Fi encryption systems, such as WPA2, may fail under specific circumstances in guaranteeing
Confidentiality, Integrity and Availability (CIA). For instance, in [7], Agarwalet al.describe how the vulnerability Hole 196 can be used to inject a spoofed broadcast/multicast frame in a WPA2 encrypted network. Wi-Fi networks require encryption protocols, as well as intelligent and robust net-work traffic monitoring mechanisms to defend themselves against attacks targeting CIA.
An Intrusion Detection System (IDS) is a security system designed to detect malicious activities within the network by extracting and analyzing network traffic measurements. Because most cyber-attacks manifest themselves through different metrics, current IDSs should not be based on a single metric, but should leverage a cross-layer metric approach. Hence, the combined use of multiple metrics across various network stack layers can help towards improving the IDS accuracy.
Data fusion techniques aim to integrate information from multiple, usually heterogeneous, data sources to improve the decision making, while decreasing the uncertainty in a knowledge domain. As many researchers have previously demonstrated, IDSs that make use of multiple metrics from the same or different network stack layers, may improve their Detection Rate (DR) while producing lower number of false alarms [8], [9].
The Dempster-Shafer (D-S) Theory of Evidence [10] is a prime data fusion approach that inherently handles knowl-edge representation and uncertainty reasoning [11]. D-S has been proven to be a powerful and efficient data fusion tech-nique in various network security related fields [12], [13]. However, there are still a number of issues associated with D-S that need to be addressed. In particular, the generation of the Basic Probability Assignment (BPA) values is of funda-mental importance.
Although D-S depends directly on the BPA, it does not dictate a specific methodology to derive the belief values. Due to this reason, few of the previously proposed methodologies can dynamically and robustly generate the BPA values to be used during the data fusion process of IDS. Therefore, this issue is still a challenge to be addressed.
In this work, we propose a novel unsupervised method-ology to dynamically generate the BPA values, based on a robust and rigorous mathematical framework. The proposed methodology employs both the Gaussian and exponential probability density functions (pdf), the categorical proba-bility mass function (pmf) [14], and the local reachability density (lrd) [15]. It dynamically assigns BPA values for each feature (i.e. metric) extracted from Wi-Fi frames, which appropriately represent the real nature of the data. Then, the D-S fusion is used to fuse the beliefs of each metric in order to classify whether the Wi-Fi frame is normal (i.e. non-malicious) or malicious.
The contribution of our work is summarized as follows: Firstly, we propose a novel BPA generation methodology that employs both Gaussian and exponentialpdf, the categor-icalpmfand thelrd. This methodology generates the beliefs supporting the hypotheses of whether the network traffic is
normal or malicious. The combination of these techniques dynamically assigns belief values depending on the current characteristics of the network traffic, without intervention from an IDS administrator. More importantly, the proposed methodology operates in an unsupervised manner and, there-fore, does not require labeled training data.
Secondly, the efficiency of the proposed BPA methodology in an IDS is evaluated for two types of wireless injection attacks using a real network testbed: MitM attack at the phys-ical layer and deauthentication attack. In total, five metrics have been empirically selected from the network traffic to be analyzed by our system in order to identify injection attacks. The various metrics are extracted from different layers of the protocol stack.
Thirdly, our network traffic datasets have been made publicly available in [16], including the ground truth. These datasets have been generated from a real Wi-Fi net-work deployed at Loughborough University, UK. Given the scarcity of publicly available labeled network traffic datasets, making the data available would benefit the IDS research community.
The main aims of the experiments that we present in this work are summarized as follows:
• To evaluate the efficiency of the proposed methodology in terms of detecting attacks and reducing false alarms.
• To compare the results generated by the proposed methodology using the single-metric and multi-metric configurations.
• To determine best possible combination of metrics for the detection performance.
The remainder of this paper is organized as follows. In SectionII, the most relevant previous works are reviewed. SectionIIIprovides an overview of the methods and algo-rithms used in this work. The proposed BPA generation methodology is described in SectionIV. SectionVpresents the network testbed, implementation of attacks, and the datasets for the evaluation of performance. In Section VI, the results are discussed and a performance comparison between single and multi-metric approaches is provided. Finally, conclusions are drawn in SectionVII.
II. RELATED WORK
Chen and Venkataramanan [17] present a comparative study between D-S and Bayesian inference as data fusion algo-rithms, and highlight the benefits of D-S theory. The appli-cation of D-S for improving the performance of IDSs is an active research topic. In [18], Chen and Aickelin present an IDS based on D-S. The beliefs, computed from multiple features, are combined to obtain an overall belief on whether the analyzed data corresponds to a malicious event. For each feature, a threshold is defined to generate the BPA related to the feature. However, this approach requires a training phase to determine various thresholds and to compute BPAs. Hence, this system cannot dynamically adjust to the current dynamics of the network traffic.
Xu et al. [11] use Gaussian distribution to construct a reference model for each dataset attribute and each hypothesis of the D-S framework, based on training datasets. The inter-section of attributes from each test sample with the normal distribution of each class is used to define a nested BPA struc-ture. However, with this nested approach, several singleton hypotheses may be assigned a null belief value. According to [18], the presence of null beliefs in the D-S fusion process can be a detrimental factor on the fused beliefs, as described by the conflicting belief phenomenon. In our proposed work, the problem of generating null beliefs is avoided by always assigning a non-zero belief value to each hypothesis, and ensuring that the mass functions are positive.
In [13] Fragkiadakis et al. present and evaluate an IDS for detecting Denial-of-Service (DoS) attacks by seeking changes in the signal-to-noise ratio. The value of this single metric is calculated from distinct nodes running two different local algorithms, single threshold and cumulative sum. Based on the collected information, their system generates the BPAs using a linear function. The BPAs are fused with D-S theory. In our work, we fuse multiple metrics across the layer stack. In [4], we previously proposed a novel BPA methodology tailored to detect wireless injection attacks by adapting to the current characteristics of the network traffic, without inter-vention from an IDS administrator. The BPA methodology uses two independent statistical approaches based on the Euclidean distance from a defined point of reference, and the density distribution of the analyzed data. Although, it was proven to be an efficient BPA methodology, it can benefit from a new set of methodologies that provide a more rigorous and well defined mathematical framework.
Other IDSs designed to secure Wi-Fi networks, which do not exploit data fusion techniques, have also been proposed in the literature. A framework that aims to detect DoS attacks at the MAC layer is described in [19]. This framework, which is based on thresholds, is composed of three main algorithms; the first one detects and prevents the masquerading of DoS attacks, the second algorithm mitigates the effect of the DoS attack in the secured resource, the third algorithm detects deauthentication, disassociation and MAC spoofing as part of the DoS attacks. The authors indicate that this framework is efficient in terms of throughput, recovery time and packet resend rates. However, it was evaluated using simulated net-work traffic only, and no evaluation has been performed using real network traffic.
The work proposed in [20] introduces an open source IDS for IEEE 802.11 networks operating in infrastructure mode. The authors indicate that the system is appropriate for the wireless environment since it does not need to be deployed on all the network nodes. Furthermore, two types of attack can be detected; deauthentication attack and evil twin attack. The detection of both attacks is based on the use of multiple metrics from the network traffic. Although this system achieves a detection accuracy of 90% on average for both deauthentication and evil twin attacks, the False Positive Rate (FPR) is relatively high and can be improved
by modifying some characteristics of the detection logic, for instance, by using more indicators.
III. PRELIMINARIES
This section provides an overview of the relevant algo-rithms used by the proposed methodology, and describes the mathematical framework associated with each algorithm. These are the D-S theory, both Gaussian and exponential pdf, categoricalpmf,lrd,k-means clustering, andk-Nearest Neighbors (k-NN).
A. DEMPSTER-SHAFER THEORY
D-S is a mathematical technique used to combine the evidence of information from multiple and heterogeneous sources in order to calculate the overall belief of occurrence of an event. D-S theory starts by defining a frame of discernment
2 = {θ1, θ2,. . ., θn}, where θn are all possible mutually exclusive outcomes of a particular problem domain. Let us consider a problem with a frame of discernment present-ing two possible outcomes2 = {A,B}, then the possible hypotheses for this problem are defined as the power set
{A,B,{A|B},∅},22. In the case of {A|B}, this subset corre-sponds toUncertainty(eitherAorB). In addition,∅denotes an empty set. With regards to this work, we want to identify whether the analyzed network traffic is malicious or non-malicious. Therefore, the frame of discernment is comprised ofA=AttackandN =Normal.
Each hypothesis is assigned a belief value within the range [0, 1], also known as BPA, through a mass probability functionm, which expresses the evidence attributed directly to the hypothesis. This is notated as:
m:22→[0,1]if m(∅)=0 m(H)≥0, ∀H⊆2 X H⊆2 m(H)=1 (1)
Then, Dempster’s rule of combination is used to calculate the orthogonal sum of the belief values from two different observers, and fuses this information into a single belief. This rule is defined in (2), wherem1(H) andm2(H) are the beliefs in the hypothesisH, from observers 1 and 2, respectively. Similarly,XT
Y =Hrefers to all combinations of evidence which yieldH; whereasXT
Y = ∅refers to the mutually exclusive subsets of the hypothesisH, thus their intersection is an empty set. m(H)= P XT Y=Hm1(X)·m2(Y) 1−P XT Y=∅m1(X)·m2(Y) ∀H 6= ∅ (2) Dempster’s rule allows the combination of evidence from two observers at a time. In order to combine evidence from more observers, Dempster’s rule can be used iteratively. The output of the initial combination process is used as input evidence in the next iteration, along with the evidence of information from a third observer. Dempster’s rule satisfies the associative property, thus the order in which the belief
values are fused does not affect the final combined belief values. To practically understand how Dempster’s rule of combination is implemented, the reader is referred to a prac-tical example presented in our previous work [4].
B. GAUSSIAN AND EXPONENTIAL PROBABILITY DENSITY FUNCTION
The Gaussian, or normal distribution N(µ, σ2), is most widely used to represent random variables in many applica-tions. This is because, according to the Central Limit The-orem (CLT), in most cases, when adding new independent variables to a sample space, the added values tend to follow the normal distribution, even if the sample space values are not normally distributed [21]. Thepdfof a Gaussian random variablexis given as:
f(x|µ, σ2)= √ 1
2πσ2 e
−(x−µ)2
2σ2 (3)
whereµandσ2are the mean and variance of the distribution, respectively.
A continuous random variablexis said to be exponential distributed if it has the following probability density function:
f(x|λ)=
(
λe−λx for x≥0
0 for x<0 (4)
whereλ >0 is the rate of the distribution [22]. C. CATEGORICAL PROBABILITY MASS FUNCTION
The pmf provides the probability that a discrete random variablexi is equal to a specific value [23]. The categorical
distribution is a discrete probability distribution that defines probability of a random variable that can take one ofk possi-ble values. For example, Bernoulli distribution has only two, i.e.k = 2, possible outcomes for the random variable. The pmfof a categorical random variable is given as:
f(xi|p) =pi (5)
k
X
i=1
pi =1 (6)
wherep=(p1, . . . ,pk),piis the probability of observing the
outcomei.
D. LOCAL REACHABILITY DENSITY
Thelrdis an outlier detection technique based on the density of the data. The density between objects in an observation space is obtained by calculating their relative distances. The relative locality of an object is given by itsknearest neigh-bors. For the purpose of clustering, objects that have similar density are considered to belong in the same group. However, objects that have lower local density than their neighbors are identified as outliers [15]. Let us assume a test sample X and a set of k nearest neighbors Nk(X) of X, the lrd
ofX is calculated as follows: lrd(X)= |Nk(X)| P Y∈Nk(X)rdk(X,Y) ! (7)
where|Nk(X)|is the cardinality ofNk(X),rdk(X,Y) is the
reachability distance of an objectXfrom theknearest objects Y ∈Nk(X), as defined by (8):
rdk(X,Y)=max{d X,Nk(X),d X,Y} (8)
whered X,Nk(X)is the distance of thekth nearest neighbor
of the objectX,d(X,Y) is the distance betweenX and each of the objectsY ∈Nk(X).
E. k-MEANS CLUSTERING
The k-means clustering is a technique used to group the observation space comprising ofnsamples intok different clusters. This unsupervised learning technique is used when the data is not labeled. Given aknumber of clusters, the aim ofk-means is to cluster each object into one of thekclusters. Let us consider a finite d-dimensional feature space S =
C1∪C2∪. . . ∪Ck = xn ∈ Rd, wherek is the number
of clusters Ci (i = 1,2, . . . ,k), and n is the number of
data instances. Thek-means optimization problem is defined in (9): min C1∪C2∪...∪Ck k X i=1 X x∈Ci x− 1 |Ci| X xj∈Ci xj 2 (9)
Although the initial centroids can be chosen randomly, in this work we utilize the algorithmk-means++ to pick initial centroids, in order to improve the running time of the algorithm.k-means++ selects the first centroid randomly, then the next centroid is chosen based on a probability related to the distance to the first centroid [24]. A simple description ofk-means clustering algorithm is provided below:
1) The initialkcentroids or seeds are randomly selected. 2) The Euclidean distance between each centroid and all
data instances is calculated.
3) Each data instance is assigned to the closest centroid forming the clusters.
4) For each cluster, a new centroid is selected based on the average distance between data instances within the cluster.
5) Steps 2-4 are repeated until convergence of centroids. F. k-NEAREST NEIGHBOURS
k-NN is a simple machine learning approach used for pattern recognition, either for classification or regression [25]. The kclosest samples to the test object in the feature space are selected as an input, wherekis a positive integer. In classifi-cation, thek-NN process returns a class to which the sample belongs. The decision is based on a voting among thekclosest samples to the object according to the Euclidean distance. In regression, the k-NN process returns a property value assigned to the sample. This value is based on the average value of thekclosest samples values.
Ink-NN, a weight can be added to the participation of each neighbor. In doing so, the closer samples participate more to the final decision than the farther ones. Usually a weight
of 1/d is assigned to each neighbor, whered is the distance between the object and the neighbor [26].
IV. PROPOSED BPA METHODOLOGY
This section describes the methodology that we propose to generate the BPA values. This methodology examines several metrics of the wireless network frames. Through manual forensics analysis, out of the all available metrics, five metrics have been empirically selected as the most appropriate for detecting the attacks. These are the Received Signal Strength Indication (RSSI), Injection Rate (Rate), Network Alloca-tion Vector (NAV), MAC layer sequence number difference between two consecutive frames (Seq) and arrival time dif-ference between two consecutive frames (IAT)
The proposed methodology comprises of two main stages. First, both Gaussian and exponentialpdf, and categoricalpmf are utilized to compute the belief in Normal. Additionally, lrdis utilized to compute the belief inAttack. Second, the dif-ferent BPAs are fused using D-S, and the final detection decision is taken.
A. METHOD TO ASSIGN BELIEF IN NORMAL
The belief in the hypothesis Normal indicates how strong the belief is that the current analyzed data is non-malicious. In order to assign the belief inNormal, we make use of both Gaussian and exponentialpdf, and categoricalpmf.
The method to assign the BPA inNormalundergoes three main steps: 1) Outlier filtering, 2) Calculating the reference of normality, 3) Assigning the belief inNormal, based on a single-metric value of the current network frame. The first two steps utilize the metric values of the previousnframes to the current frame. A description of all three steps is given below.
1) OUTLIER FILTERING
The main purpose of this step is to build a
base-line of normality. This step uses k-means
cluster-ing to filter significant outliers in the analyzed data (i.e.baselinedata). Then, the remaining data resulting after discarding the outliers (i.e.cleandata), is used to build more accurate baseline of normality. The k-means algorithm is applied on all five metrics of the frames in the baseline data. Assuming that the majority of the network traffic is non-malicious, the cluster with greater number of frames is considered to comprise non-malicious frames, and the smaller cluster is considered to comprise malicious frames.
Let us consider a finite d-dimensional feature space S = C1 ∪ C2, where S is the baseline data, k = 2, C1 = {x1,x2, . . . ,xm}is the class for non-malicious data,
C2= {xm+1,xm+2, . . . ,xm+l}is the class for malicious data,
n=m+lis the number of frames considered previous to the currently analyzed frame,xi ∈Rd(i=1,2, . . . ,n),mis the
number of non-malicious frames,lis the number of malicious frames. The outlier filtering step, applying (9), is expected to produce ad-dimensional feature spaceF = C1∪C20 =
{x1,x2, . . . ,xm,xm+1, . . . ,xm+g}, whereF is thecleandata
andgl, i.e. all or most data that compriseC2should be dis-carded from the original dataset. The experiments conducted in this work considers the feature space of dimensiond =5, where each network frame is a vector of five metrics. The cleandata is used in the next step of this phase to calculate the reference of normality.
One condition that should be met, for statistical reliability, is that thebaselinedata should ben ≥ 30. This is the min-imum number of frames required for estimating the param-eters meanµ and varianceσ2 of the Gaussian distribution and rate parameter λ of the exponential distribution [27]. Algorithm1provides the implementation pseudo-code of the first step of the belief assignment method.
Algorithm 1Implementation Pseudo-Code of the First Step
of the Belief Assignment on the HypothesisNormal 1: Geta single-metric value (x) from the current frame 2: Getbaselinedata (all metrics from previousnframes) 3:
4: Outlier Filtering
5: Input:baselinedata=C1∪C2
6: Select, initially, centroids (c1andc2) usingk-means++ 7: do
8: Calculate distance fromc1andc2to all the frames
9: d(c,x)=
q
Pn
i=1(c−xi)2
10: Assign all frames to the closest centroid (c1orc2) 11: Per cluster, identify a new centroid
12: d(c,x)/n
13: whilec1and c2change
14: Remove outlier cluster 15: Output:cleandata=C1∪C0
2= (C
0
2C2)
2) CALCULATING THE REFERENCE OF NORMALITY
The main purpose of this step is to define a reference of nor-mality for calculating the BPA inNormal. This step utilizes Gaussianpdffor RSSIandSeqmetrics, exponentialpdffor IATand categoricalpmfforRateandNAV.
For the metricsRSSI (measured indBm) andSeqmetrics, the underlyingpdfof the metric values (i.e. the probability of occurrence of any metric sample) can be obtained as described in (3), based on the estimation of theµandσ2for each metric from thecleandata. The reference of normality is defined by the value with the maximum probabilitypmax,
which is the probability value, whenxcoincides withµ: pmax =f(µ)=
1
√
2πσ2 (10)
For the metricIAT, based on the estimation ofλfrom the metric values in theclean data, the underlying pdf of the metric values can be obtained as in (4). The reference of normality is defined by the value with the maximum proba-bilitypmax, which coincides withf(xmin|λ), wherexminis the
minimum value of the metricIAT in theclean data. When xmin=0, thenpmax=λaccording to (4).
Finally, for each of the metrics,RateandNAV, the empir-ical probability (relative frequency) of each unique value is computed. Based on (5) and (6), the empirical probability of a unique valuexi is the absolute frequency of the unique
value (ni), normalized by the total number of the metric values
in thecleandata,N.
f(xi|p)=
ni
N (11)
The references of normality for RSSI, Seq, and IAT, and the empirical probabilities for Rate, andNAV are used when assigning the belief in Normal to the current frame, as explained in the next step. Algorithm 2 provides the implementation pseudo-code of the second step of the belief assignment method.
Algorithm 2 Implementation Pseudo-Code of the Second
Step of the Belief Assignment on the HypothesisNormal 1: Calculating the Reference of Normality
2: Input: Single-metric valuesxiof the frames incleandata
3:
4: For metricsRSSIandSeq:
5: Calculateµandσ of the single-metric valuesxi
6: foreachxi;(i=1,2,...,m+g)do 7: f(xi|µ, σ2)=√ 1 2πσ2 e −(xi−µ)2 2σ2 8: end for
9: Find reference of normality (pmax)
10: pmax =f(µ)= √1
2πσ2 11:
12: For metricIAT:
13: Calculateµof the single-metric valuesxi
14: foreachxi;(i=1,2,...,m+g)do 15: f(xi|λ)= ( λe−λx for xi≥0 0 for xi<0 16: end for
17: Find reference of normality (pmax)
18: pmax =f(xmin|λ)
19:
20: For metricsRateandNAV:
21: Find the set of unique values (X), frequency of each unique value (ni) and the total number of values (N).
22: foreach unique valuexi∈Xdo
23: f(xi|p)= niN
24: end for
25: Output:pmaxorf(xi|p)
3) BELIEF ASSIGNMENT INNORMAL
This step provides the belief value inNormal. For the metrics RSSIandSeq, the probability of the currently analyzed metric valuef(xi), calculated using (3), is normalized bypmaxgiven
by (10), as illustrated in Fig.1. Thus, the belief inNormalfor these metrics is computed as:
m(N)=f(xi)
f(µ) (12)
FIGURE 1. Illustration of a generic Gaussianpdf, definition of the reference of normalityf(µ), and calculation of the probability of the currently analyzed metric valuef(x). Given a metric valuex, assigning the belief inNormalto the current frame, based on Gaussianpdf.
For the metricIAT, the probability of the currently analyzed IATvaluef(xi), given by (4), is normalized with the value
pmax. As explained in the previous step, for IAT,pmax =
f(xmin). Thus, the belief inNormal, is computed as:
m(N)= f(xi)
f(xmin)
(13) This step can update the reference of normality (pmax) for
the metricsRSSI,SeqandIAT. The value ofpmaxis updated
when the computedf(xi) of the currently analyzed value is
greater than the current reference. In that case, the updated reference of normality would bepmax =f(xi). Fig.2
repre-sents the assignment of the belief inNormal to the current frame, based on the exponentialpdf.
FIGURE 2. Illustration of the exponentialpdf, definition of the reference of normalityf(xmin), and calculation of the probability of the currently analyzed metric valuef(x), wheref(xmin)=λ. Given a metric valuex, assigning the belief inNormalto the current frame based on exponentialpdf.
Regarding the metricsRateandNAV, the belief inNormal is assigned to the current frame based on the empirical prob-abilities computed by (11) in the previous step. When the analyzed value (xi) is equal to one of the unique values in
thecleandata, the belief inNormalis assigned as:
m(N)=pi (14)
In contrast, when the analyzed value (xi) is not equal to
any of the unique values in the clean data, the belief in Normal is assigned to an arbitrarily small value. As previ-ously explained in SectionII, the presence of null beliefs in
the D-S fusion process can be a detrimental factor on the fused beliefs. Fig.3depicts the assignment of the belief inNormal to the current frame, based on categoricalpmf. Algorithm3
provides the implementation pseudo-code of the third step of the belief assignment method.
FIGURE 3. Illustration of the categoricalpmf, normalized by the total number of the metric values (N). Given the unique metric values x1,x2, . . .xiwith frequenciesn1,n2, . . .ni, respectively, the BPA in Normalto the current frame, based on the current analyzed valuexi, isni/N.
Algorithm 3Implementation Pseudo-Code of the Third Step
of the Belief Assignment on the HypothesisNormal 1: Belief Assignment in Normal
2: Input: Single-metric valuexof the current frame 3: For metricsRSSIandSeq:
4: Computef(x) based on the Gaussianpdf 5: Calculate Belief inNormal,m(N) 6: m(N)=f(x)/f(µ)=f(x)/pmax
7:
8: For metricIAT: 9:
10: Computef(x) based on the exponentialpdf 11: Calculate Belief inNormal,m(N)
12: m(N)=f(x)/f(xmin)=f(x)/pmax
13:
14: For metricsRateandNAV:
15: ifx∈Xthenm(N)=f(x|p)= n N 16: elsem(N)=0 17: end if 18: 19: Output:m(N)
B. METHOD TO ASSIGN BELIEF IN ATTACK
The belief in the hypothesis Attack indicates how strong the belief is that the current analyzed data are malicious. In order to assign the belief inAttack, we propose using the lrd technique. As previously explained in Section III-D, thelrdis an outlier detection technique. Therefore, this tech-nique is an ideal methodology to assign the belief inAttack.
The proposed methodology to assign the BPA depends on the comparison between the local density of a frame and its
k-NNs among the previousnframes within thebaselinedata. This methodology undergoes two main steps: 1) Calculat-ing the reference of abnormal traffic, and 2) AssignCalculat-ing the belief inAttack, utilizing the lrd. A description of the two steps is given below. Algorithm4provides the implementa-tion pseudo-code of the belief assignment for the hypothesis Attack.
1) CALCULATING THE REFERENCE OF ABNORMAL TRAFFIC This step starts by removing duplicate features from the baselinedata. This is because duplication would introduce instability caused by the distance value of zero, when calcu-latinglrd in the following steps. As a result, a new dataset calleduniquedata is generated.
This step can be divided into the following five points: 1) Remove duplicate features from thebaselinedata, and
generateuniquedata.
2) For each frame in theuniquedata, thek-NNs are found. 3) For each of the neighbors found in step 2), thek-NN
are also found.
4) For each frame, thelrdis calculated based on (7). 5) The maximumlrdvalue (i.e.lrdmax) is selected as the
reference of abnormal traffic.
Points 2-4 are repeated for each metric in theuniquedata. Fig.4 shows a comparison between the local density of an objectA with its three nearest neighbors. As can be seen, the objectAhas a much lower local density than its neighbors.
FIGURE 4. A comparison between the local density ofAwith its three nearest neighbors. Givenk=3,Ahas a much lower local density than its 3 neighbors. This means that the belief inAttackassigned to the network frame based onAis higher than the beliefs assigned based on
the 3 neighbors.
Due to the computational cost that would entail to have a large number of nearest neighbors, we have experimentally chosenkmax =20 for thek-NN algorithm. If the number of
the unique values (v) is less than or equal tokmax, then the
number of nearest neighbors is set ask=v. Otherwise,kis set ask=kmax.
Thelrdfor the currently analyzed framelrd(xi) is
calcu-lated as described in (7). Iflrd(xi) is larger than the reference
of abnormal trafficlrdmax, then the reference of abnormal
traffic is updated aslrdmax =lrd(xi).
2) BELIEF ASSIGNMENT INATTACK
This step provides the belief value inAttack. Once thelrd for the currently analyzed frame,lrd(xi), and the reference of
abnormal traffic, lrdmax, have been calculated, the belief in
Attack assigned to the currently analyzed framexi is
calcu-lated as follows: m(A)= 1−lrd(xi) lrdmax (15) Thus, the frame with the lowestlrd(xi) would receive the
highest belief inAttack.
Algorithm 4 Implementation Pseudo-Code of the Belief
Assignment on the HypothesisAttack
1: Geta single-metric value (xi) from the current frame
2: Getbaselinedata (all metrics from previousnframes) 3:
4: 1)Calculating the Reference of Abnormal Traffic 5: Input:baselinedata
6: Remove duplicates inbaselinedata 7: 8: ifm≤kmaxthen 9: k=m 10: else 11: k=kmax 12: end if
13: foreach unique single-metric valuedo
14: Find thek-NN
15: foreach previousknearest neighbourdo
16: Find thek-NN
17: end for
18: Calculatelrd
19: end for
20: Output:lrdmax
21: Calculate the local reachability densitylrd(xi)
22: iflrd(xi)>lrdmaxthen
23: lrdmax =lrd(xi)
24: end if
25:
26: 2)Belief Assignment in Attack 27: Input:lrd(xi) andlrdmax
28: Calculate Belief inAttack,m(A) 29: m(A)= 1−(lrd(xi)/lrdmax)
30: Output:m(A)
C. METHOD TO ASSIGN BELIEF IN UNCERTAINTY
Once the BPA values in Normal and Attack have been
assigned, it is also necessary to compute the belief in the hypothesisUncertainty. The BPA inUncertaintyis assigned based on the previously computed belief values (i.e. m(N) and m(A)), as described in (16). The BPA in Uncertainty indicates how doubtful the system is regarding whether the current analyzed data are malicious or non-malicious. The numerator is the smallest of the two hypotheses, whereas the denominator is the largest one.
m(U)=m(A|N)= min m(A),m(N)
max m(A),m(N) (16)
D. FUSION OF BELIEFS AND DETECTION DECISION As described early on in this Section, the second stage of the proposed approach conducts the fusion of beliefs using D-S theory. This stage also aims to make the final decision on whether the network frame is actually malicious or not.
To meet the requirements of D-S theory, all the conditions listed in (1) have to be met. In particular, we need to ensure that the addition of all the belief values is equal to 1. In order to satisfy this condition, we compute the normalization of the three BPA values, as described in (17).
m(H)0= m(H)
X
H⊆2
m(H)
∀H⊆2 (17)
Then, the BPA values assigned by all the observers are fused according to the Dempster’s rule of combina-tion (2). The outcome of the D-S theory is a complete set of BPA values (i.e. one for each hypothesis initially consid-ered). The analyzed information is classified according to the hypothesis with the highest BPA, which is considered to be the correct decision. Algorithm5depicts the implementation pseudo-code of the fusion of beliefs and the detection process. E. SINGLE METRIC ATTACK DETECTION
As previously explained, IDSs that make use of multi-ple metrics in a cross-layers approach may improve their efficiency. Nonetheless, we also investigate whether using the BPAs assigned to single metrics could be used to produce more accurate detection results than multi-metric approaches.
By computing the BPAs as described in Section IV, the proposed approach could classify the network frames as normal or malicious, based on the belief values gener-ated from a single metric only. If the belief in Normal is greater than or equal to the belief inAttack,m(N) ≥ m(A), the currently analyzed frame would be classified as normal. Otherwise, if the belief inNormalis smaller than the belief inAttackthe currently analyzed frame would be classified as malicious.
V. TESTBED AND NETWORK TRAFFIC MEASUREMENTS
A. EXPERIMENTAL TESTBED WLAN
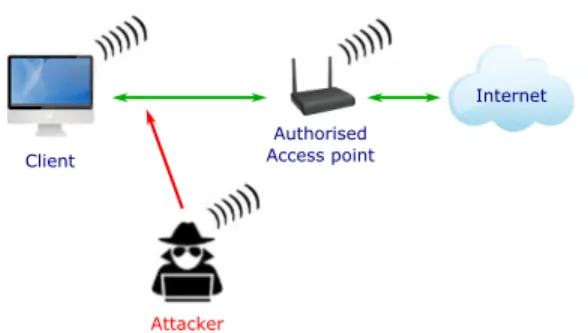
The performance of the proposed BPA methodology has been evaluated on an experimental IEEE 802.11 network testbed, which was set up in our laboratory. As shown in Fig. 5, the experimental testbed consists of a wireless client machine connecting to the Internet through a legitimate Access Point (AP). Another machine is used as an attacker using the suite of hacking tools Aircrack [28]. The client machine and the attacker were running Linux and all the devices except from the Linksys WRT54GL AP used the Atheros chipset in their wireless cards.
B. WIRELESS INJECTION ATTACKS
The two different network traffic datasets, used in this work, have been made publicly available in [16], including the
Algorithm 5 Implementation Pseudo-Code of the Belief Assignment on the Hypothesis Uncertainty and Beliefs Fusion
1: 1)Calculating Uncertainty
2: Input: Belief inNormalandAttackassigned toith frame; i=1,2, . . . ,ris the number of selected features 3: mi(N),mi(A) 4: formetric=1→rdo 5: mi(U)=min mi(A),mi(N)/max mi(A),mi(N) 6: end for 7: Output:mi(U) 8: 9: 2)Beliefs Adjustment
10: Input: Beliefs set assigned toith frame 11: mi(N),mi(A),mi(U) 12: formetric=1→rdo 13: mi(H)0=mi(H)/PH⊆2mi(H) 14: end for 15: Output:mi(N)0,mi(A)0,mi(U)0 16: 17: 3)Beliefs Fusion
18: Input: Adjusted beliefs set assigned toith frame 19: mi(N)0,mi(A)0,mi(U)0
20: formetric=1→rdo
21: Apply Dempster’s rule of combination (2) 22: m(H)=mi(H)Lmi+1(H) ∀H⊆2
23: end for
24: Output:m(N),m(A),m(U) 25:
26: 4)Network Traffic Classification 27: Input: Fused beliefs set
28: m(N),m(A),m(U) 29: ifm(N)≥m(A)then
30: Currently analysed frame classified asnormal 31: else
32: Classified asmalicious
33: end if
34: Output: Network frame classification
FIGURE 5. Logical topology of the IEEE 802.11 network testbed; one wireless client machine connecting to the Internet, one legitimate AP, and one attacker implementing the wireless injection attacks.
ground truth. Each of these dataset includes traces of one type of wireless injection attack. These types are MitM attack at the physical layer, and deauthentication attack.
1) MAN-IN-THE-MIDDLE ATTACK AT THE PHYSICAL LAYER To implement the MitM attack, the Airpwn tool [29] was used by the attacker to launch the attack. This software can be found as part of the suite of penetration testing tools Aircrack. Airpwn eavesdrops the transmitted frames in a WiFi network, analyses this information and injects malicious frames into the wireless channel. If Airpwn identifies an HTTP request from a legitimate wireless node, it injects its own crafted HTML code, spoofing the TCP sequence number and the MAC address of the legitimate AP.
This tool takes advantage of the time required by the server to respond to legitimate website requests. The nature of this MitM attack requires the victim to be located within the wireless coverage area of the attacks. Since there are no hops between the attacker and the victim, it takes the attacker much less time to respond to legitimate website requests than the web server. When the client receives the response from the attacker, it assumes the response as legitimate and processes the injected code. The future response from the legitimate web server would be discarded by the victim as it assumes the original request has already been received.
2) DEAUTHENTICATION ATTACK
The deauthentication attack has also been investigated in this work. To implement this attack, the Aircrack tool [28] was used by the attacker to inject deauthentication frames to the wireless network traffic. The attacker injects spoofed deauthentication frames with the purpose of forcing the client to re-establish a connection with the AP. The attacker spoofs its MAC address to deceive the victim that the frames are coming from the authorized AP.
This type of attack is commonly utilized in DoS attacks but also constitutes the first step of breaking into WPA2 encrypted wireless networks. In the latter case, the attacker injects a few spoofed deauthentication frames with the purpose of forcing the client to re-establish a connec-tion with the AP. At a later stage and offline, the attacker could succeed in cracking WPA2 by applying brute force or dictio-nary attack techniques.
C. NETWORK TRAFFIC FEATURES
The relevant network traffic has been monitored and gath-ered by the client machine using the network packets ana-lyzer tcpdump [30] in pcap format. Two datasets have been gathered from a real IEEE 802.11 network testbed shown in Fig.5. The first dataset contains traces of the MitM attack at the physical layer, whereas the second dataset contains traces of the deauthentication attack. The MitM dataset com-prises 14493 instances of which 93.1% (13498 frames) is normal and 6.9% (995 frames) is malicious. The Deauthen-tication dataset comprises 228 instances of which 71.93% (164 frames) is normal and 28.07% (64 frames) is mali-cious. It is worth noting that in our experimental evaluation, the ground truth was used only for evaluation purposes and was not used during the detection process.
The network analyzer TShark [31] was used to extract different metrics from the frame in the captured pcap files. These metrics are Rate, NAV, Seq and IAT. Since the implemented MitM attack affects only the data frames , man-agement and control frames were not considered in the MitM attack detection process. On the other hand, only manage-ment frames were used during the detection of deauthentica-tion attack, which are the type of frames used to conduct this attack.
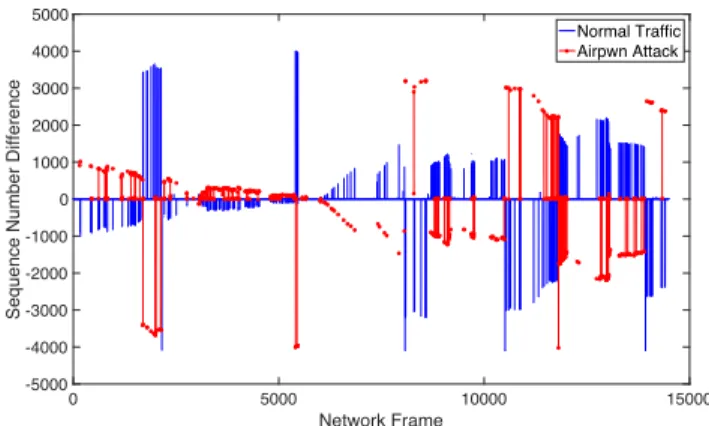
The metricsRSSI,SeqandIAT for the MitM dataset are represented in Figs. 6-8. The section in blue corresponds to the non-malicious traffic, whereas the section in red cor-responds to the traces of MitM attack. The Y-axis of the figures represents the respective metric, whereas the X-axis of the figures represents the number of captured network frames. As seen in Fig. 6, even though both the attacker and the authorized AP manifest themselves in their own range ofRSSI values, we cannot clearly define a threshold to differentiate between normal and malicious traffic. This is because in some network frames, such as the ones around the 5000th frame, there is an overlap ofRSSIvalues between the normal and attack traffic. For the metricsSeqandIAT, as shown in Figs.7-8respectively, the nature of both metrics does not allow us to define what values correspond either to normal or malicious traffic, as there are spikes in both types of traffic.
FIGURE 6. RSSI - Received signal strength measured by the victim machine during implementation of the MitM attack.
VI. EVALUATION OF RESULTS
This section describes the off-line detection results, and com-pares the results generated by the proposed methodology using all the possible combinations of metrics. There are two main purposes of these results. First, to evaluate the efficiency of the proposed methodology in identifying the presence of attacks, and producing reduced number of false alarms. Second, to identify which of the possible combinations of metrics produces the best detection results.
The effectiveness of the proposed methodology has been evaluated using the following performance metrics, which provide evidence of how effective an IDS is at making correct detections:
FIGURE 7. Seq - MAC layer Sequence Number Difference between two consecutive frames, measured by the victim machine during
implementation of the MitM attack.
FIGURE 8. IAT - Inter arrival time difference between two consecutive frames, measured by the victim machine during implementation of the MitM attack.
• True Positive Rate (TPR) or Detection Rate - Proportion
of malicious frames correctly classified among all the malicious data:
TPR= TP
TP+FN (18)
• False Positive Rate (FPR) - Proportion of normal data
misclassified as malicious among all the normal data:
FPR= FP
TN+FP (19)
• Overall Success Rate (OSR) or Accuracy - Proportion of frames correctly classified among all the data:
OSR= TP+TN
TP+FP+TN +FN (20)
• Precision - Proportion of malicious frames correctly
classified among all the alarms generated: Precision= TP
TP+FP (21)
• F-score - Tradeoff betweenPrecisionand TPR, used to compare two distinctive classification methodologies:
F-score= 2·Precision·TPR
where True Positive (TP) represents attacks classified as attacks; True Negative (TN) represents normal instances classified as normal; False Positive (FP) represents normal instances misclassified as attack; and False Negative (FN) represents attacks misclassified as normal.
We have divided the datasets in 80% for training (i.e. train data) and 20% for testing (i.e. test data). The training dataset was used to build the normality and attack baselines (i.e. baseline data), whereas the remaining data were used to generate the beliefs and evaluate the proposed methodology.
A. SINGLE METRIC DETECTION PERFORMANCE
This section presents the initial performance evaluation of the proposed methodology, which focuses on the assessment of the single metric based attack detection, as described in Section IV-E. For all the five considered features, the pro-posed approach could classify the network frames as nor-mal or nor-malicious, based on the belief values generated for each single metric.
1) DETECTION OF MAN-IN-THE-MIDDLE ATTACK
The detection results for the MitM attack, based on individual metric, are presented in Table1. As can be seen, there are two metrics that provide outstanding performance. These areRate andNAV. The single metricNAV generates perfect detection results, 100% TPR and 0% FPR. Regarding the metricRate, it produces perfect TPR (i.e. 100%) and only 0.18% FPR. Regarding the remaining three metrics, despite generating relatively low FPR (i.e. reaching 8.24%), none of the metrics produce acceptable results in terms of TPR. The TPR for metricsRSSI andIAT are 49.01% and 79.72% respectively, whereas the TPR forSeqreaches only 34.93%. In terms of Precision, the metricsRSSI,IAT andSeqproduce 57.62%, 60.99% and 50.2%, respectively.
TABLE 1. Man-in-the-Middle attack detection results generated by the proposed methodology, using single metric detection configuration.
The reasons that justify the good performance of these two metrics are related to the implementation of the MitM attack by the Airpwn tool. For instance, the attacker constantly transmits at a low transmission rate (i.e. 1 Mbps) to achieve a higher throughput in the wireless communication. This trans-mission rate would usually be different from the rate, used to transmit data frame, by the legitimate wireless devices. Similarly, the actual NAV value set by the transmitters in a wireless network is correlated with the used transmission rate.
Since the attacker would use a low transmission rate, the NAV value set by the attacker would equivalently be larger than the NAV value set by the legitimate wireless devices.
From the presented results, it would be expected to use the single metric methodology using eitherRateor NAV to defend the wireless network against MitM attacks at the phys-ical layer. Nonetheless, the detection system cannot assume the implementation parameters chosen by the attacker. More importantly, it is impossible to anticipate the particular type of attack implemented by the attacker. Hence, basing the wireless injection attack detection on the use of single metric may be prone to a high number of misclassification results. 2) DETECTION OF DEAUTHENTICATION ATTACK
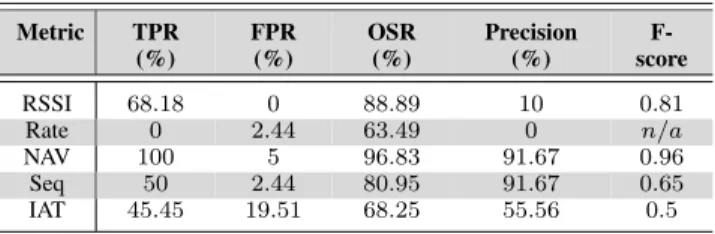
The detection results for the deauthentication attack, based on individual metric, is presented in Table2. Regarding the deauthentication attack detection, one noticeable result is produced by the single metricRate. In contrast to the case of MitM attack in whichRateproduces 100% TPR, for the deauthentication attack detection, the same metric generates 0% TPR and 2.44% FPR. It is also remarkable the detection results forRSSI, which produces 0% FPR. This is the best FPR results of all the evaluated metrics for deauthentica-tion attack. Apart from IAT, which reaches 19.51% FPR, all metrics generate low rate of false alarms, reaching 5% FPR. Nevertheless, these metrics have poor results in terms of TPR, except forNAV. Once again, the best overall detection results are produced by the single metricNAV, with 100% TPR and only 5% FPR. The OSR, Precision and F-score for this metric are 96.83%, 91.67% and 0.96, respectively.
TABLE 2.Deauthentication attack detection results generated by the proposed methodology, using single metric detection configuration.
The good performance produced by the single metric NAV is explained by the large NAV value set by the attacker, as explained in the case of MitM attack. However, the per-formance drop in the case of Rate is justified by the fact that the AP also transmits at a very low transmission rate the control and management frames. Therefore, distinguishing between normal and malicious traffic, based only on single metricRate becomes extremely complicated in the case of deauthentication attack.
These results highlight the fact that the use of single metrics configuration to detect the presence of wireless injection attacks may be inefficient against different type of attacks. Therefore, we argue that a multi-metric approach would address such issues.
FIGURE 9. Bar char for the MitM attack detection results for all possible metrics combinations; TPR in green, FPR in red, and OSR blue.
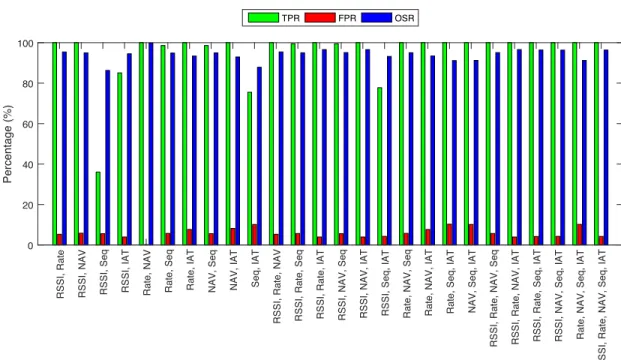
FIGURE 10. Bar char for the deauthentication attack detection results for all possible metrics combinations; TPR in green, FPR in red, and OSR blue.
B. MULTI-METRIC DETECTION PERFORMANCE
This section presents the multi-metric attack detection evalu-ation of the proposed methodology for all the possible com-binations of metrics. The best results overall are expected in the case where all the possible metrics are combined.
The detection results of the proposed methodology, for all possible metrics combinations, have been plotted
in Figs. 9-10. These figures, in the form of bar chart, present the TPR, FPR and OSR results in three sep-arate bars, for each metrics combination. The X-axis represents the particular metrics combination, whereas the Y-axis represents the detection result in percentage. The TPR is represented in green, the FPR in red, and the OSR is blue.
1) DETECTION OF MAN-IN-THE-MIDDLE ATTACK
The MitM attack detection results of the proposed methodol-ogy, for all possible metrics combinations, have been plot-ted in Fig. 9. For the case of two-metrics combination, the combination Rate & NAV generates the best detection results, with 100% TPR and 0.18% FPR. The two met-rics that produce the best single metric results for MitM attack detection would also produce the best detection results when combined. Furthermore, the two-metric combinations RSSI & Rate,RSSI & NAV,Rate & IATandNAV & IATalso provide considerably good detection results. All these metrics combinations produce 100% TPR. In terms of FPR, these two-metric combinations generate 5.33%, 5.83%, 7.69%, and 8.19%, respectively. A common factor to all these metrics combinations is the presence of either RSSI or NAV. This shows that the contributions of these two metrics dominate the detection and, in turn, improve the results.
On the other hand, metrics combinations such asRSSI &
Seq produce poor detection results in terms of TPR
(i.e. 36.06%). Because these two metrics generate low TPR during the single metric detection, it is expected that this metrics combination would also perform poorly. All the detection results for the two-metrics combinations have been tabulated in Table3.
TABLE 3. Man-in-the-Middle attack detection results generated by the proposed methodology, using two-metrics combination detection configuration.
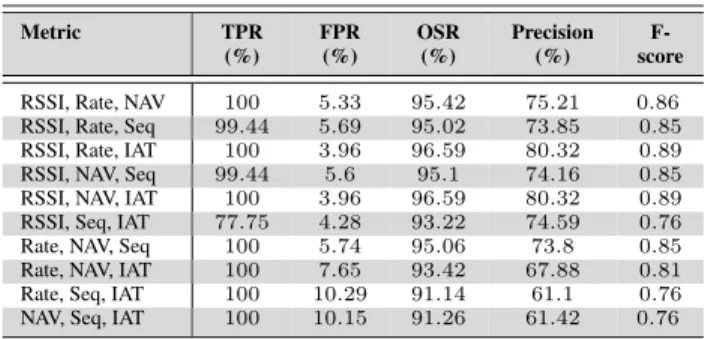
The detection results for all the three-metrics combina-tions have been tabulated in Table 4. For this number of metrics, the best detection results are produced by bothRSSI, Rate & IATandRSSI, NAV & IAT. Both metrics combina-tions produce 100% TPR, 3.96% FPR and 96.59% OSR. All the remaining combinations, except fromRSSI, Rate & Seq, RSSI, NAV & SeqandRSSI, Seq & IAT, provide 100% TPR. However, these metrics combinations also generate slightly higher FPR results, reaching 10.29% FPR in the case ofRate, Seq & IAT.
These results show that, as more metrics are combined, the overall efficiency of the proposed detection methodology, in terms of TPR, improves among most of the metrics com-binations. Nonetheless, there is also a slight overall increase in terms of FPR. This phenomenon can be interpreted as that the detection methodology becomes more sensitive as more metrics are used during the detection process. In other words,
TABLE 4.Man-in-the-Middle attack detection results generated by the proposed methodology, using three-metrics combination detection configuration.
the BPA inAttack generally increases, and more malicious frames are correctly classified, but also more normal frames are misclassified as malicious.
For the case of four-metrics combination, all the com-binations achieve perfect detection, in terms of TPR (i.e. 100%). The best detection results overall are obtained by the combination ofRSSI, Rate, NAV & IAT, which produces 3.96% FPR and 96.59% OSR. Only the combination ofRate, NAV, Seq & IATprovides FPR results higher than 5.69%. The detection results for the four-metrics and five-metrics combinations have been tabulated in Table 5. Similar to the analysis presented about the three-metrics combination, as more metrics are combined, the overall efficiency of the proposed detection methodology, in terms of TPR, improves among most of the metrics combinations.
TABLE 5.Man-in-the-Middle attack detection results generated by the proposed methodology, using four-metrics and five-metrics combination detection configuration.
Finally, the combination of five metricsRSSI, Rate, NAV, Seq & IATprovides 100% TPR, 4.23% FPR, 96.36% OSR and 0.88 F-score.
2) DETECTION OF DEAUTHENTICATION ATTACK
The deauthentication attack detection results of the proposed methodology, for all possible metrics combinations, have been plotted in Fig.10. For the case of two-metrics com-bination, the combinationsRSSI & NAV,Rate & NAV, and NAV & Seqgenerate the best detection results, with 100% TPR and 2.44% FPR. Once again, the metric that generated the best results in the single metric configuration (i.e.NAV), is present in all these two-metric combinations. Although the metrics combinationNAV & IATalso produces 100% TPR,
the detection results in terms of FPR reach 19.51%. It is notable that the combinations RSSI & SeqandRSSI & IAT do not generate any false alarm (i.e. 0% FPR). However, their F-score is less than 0.78 due to the low detection rate (i.e. 63.64% and 27.27% TPR, respectively). The detection results for the two-metric combinations have been tabulated in Table6.
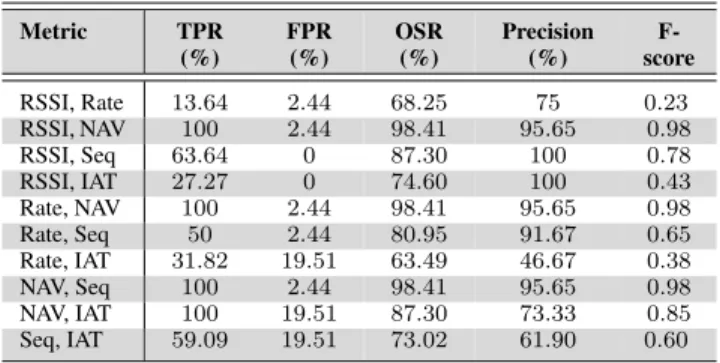
TABLE 6. Deauthentication attack detection results generated by the proposed methodology, using two-metrics combination detection configuration.
The detection results for all the three-metrics combinations have been tabulated in Table7. In this case, the best detection results are produced byRSSI, Rate & NAV,RSSI, NAV & Seq andRate, NAV & Seq, with 100% TPR and 98.41% OSR. Although both setsRate, NAV & IAT andNAV, Seq & IAT also provide 100% TPR, they produce a high number of FPR, causing a low Precision of 73.33%. For all the different combinations, the metric NAV seems to generally improve the detection performance. In contrast to the case of MitM attack, the inclusion of the metricRatedrastically degrades the performance of the deauthentication attack detection. TABLE 7. Deauthentication attack detection results generated by the proposed methodology, using three-metrics combination detection configuration.
The detection results for the four-metrics and five-metrics combinations have been tabulated in Table 8. For the case of four-metrics combination, apart from the setRSSI, Rate, Seq & IAT, all the combinations achieve detection rate larger than 90.91%. Two of these sets,RSSI, NAV, Seq & IATand Rate, NAV, Seq & IAT, achieve 100% TPR. In particular,
TABLE 8.Deauthentication attack detection results generated by the proposed methodology, using four-metric and five-metric combination detection configuration.
the combination RSSI, NAV, Seq & IAT generates the best detection results, with only 2.44% FPR and F-score of 0.85. Similar to what was discussed for the case of MitM attack detection, as more metrics are combined, the overall effi-ciency of the proposed detection methodology, in terms of TPR, improves among most of the metrics combinations. Additionally, in the case of deauthentication attack detection, the FPR remains generally low, with 2.44% for almost all the four-metric combinations.
Finally, the five-metric combination provides 100% TPR, 2.44% FPR, 98.41% OSR and F-score of 0.98. These results coincide with the best detection overall across all the possible metrics combinations, for the detection of the deauthentica-tion attack.
C. SINGLE AND MULTI-METRIC PERFORMANCE COMPARISON
This section provides a comparison analysis between the performance of the single-metric and multi-metric configura-tions for the detection methodology that we propose. Table9
presents the detection results, of the single-metric and five-metric combination configurations, for the detection of MitM and deauthentication attack. In the case of single-metric, only the metrics that generate the best detection results are included,NAVandRate.
TABLE 9.A Performance comparison between single and multi-metric detection.
If we focus only on the detection of the MitM attack with single metric, these results may lead to the conclusion that the use of single metric is enough for the detection of wireless injection attacks. This is true for this particular attack and the metricsNAVandRate. Nonetheless, these results are not always consistent when detecting other types of injection
attacks. For instance, the use of the single metric Rate to detect deauthentication attack leads to 0% TPR. On the other hand, for these types of attack, the use of single metricNAV provides high detection results.
It can be argued that the configuration of the detection methodology can be adapted to the particular type of attack being detected. However, it is impossible to know beforehand the type of attack that the protected environment is going to face. Therefore, as we argue in this work, the solution would be the combined use of multiple metrics during the attack detection. As we can see in Table9, the performance of the five-metric combination provides highly accurate results, regardless of the type of attack being detected (both MitM and deauthentication attack). In both cases, the multi-metric con-figuration produces 100% TPR and less than 5% FPR. These results highlight the benefit of using a multi-metric approach in comparison with the single-metric approach. Hence, there is an advantage of fusing beliefs from all possible metrics as this provides robustness against uncertainty, for example if the type of attack is unknown or if the attacker employs sophisticated tools to manipulate certain metrics associated with attacks.
VII. CONCLUSION
We have presented a novel unsupervised methodology to dynamically generate the BPA values, based on the use of Gaussian and exponentialpdf, the categoricalpmf, and the lrd. This novel methodology dynamically assigns BPA val-ues for each metric extracted from Wi-Fi frames, which appropriately represent the real nature of the analyzed data. The methodology is employed by an IDS that defends Wi-Fi networks against different types of injection attacks. In particular, we have evaluated the proposed methodology against MitM and deauthentication attacks, using real net-work traffic data generated using a Wi-Fi netnet-work.
Although the use of single metric detection can provide very accurate detection results, there is not a single metric that is efficient for all types of attacks. The configuration of the detection methodology ought to be adapted to the particular type of attack being detected. However, it is impossible to know beforehand the type of attack that the monitored envi-ronment may have to face. On the other hand, the combined use of multiple metrics during the attack detection provides accurate results, without the need to select beforehand a specific set of metrics. In the presented results, the multi-metric configuration produces 100% TPR and less than 5% FPR for both the MitM and deauthentication attacks. These results highlight the benefit of using a multi-metric approach in comparison to the single-metric approach.
REFERENCES
[1] A. Osseiran, O. Elloumi, J. Song, and J. F. Monserrat, ‘‘Internet of Things,’’
IEEE Commun. Standards Mag., vol. 1, no. 2, p. 84, 2017.
[2] Statista. Internet of Things—Number of Connected Devices Worldwide 2015–2025. Accessed: May 10, 2018. [Online]. Available: https://www.statista.com/statistics/471264/iot-number-of-connected-devices-worldwide/
[3] M. Souppaya and K. Scarfone,Guidelines for Securing Wireless Local Area Networks (WLANs), document 800-153, NIST Special Publication, 2012.
[4] K. G. Kyriakopoulos, F. J. Aparicio-Navarro, and D. J. Parish, ‘‘Manual and automatic assigned thresholds for multi-layer data fusion IDS in 802.11 attacks,’’IET Inf. Secur., vol. 8, no. 1, pp. 42–50, 2014. [5] D. Wasil, O. Nakhila, S. S. Bacanli, C. Zou, and D. Turgut, ‘‘Exposing
vulnerabilities in mobile networks: A mobile data consumption attack,’’ in
Proc. IEEE 14th Int. Conf. Mobile Ad Hoc Sensor Syst. (MASS), Oct. 2017, pp. 550–554.
[6] M. Dahiya and S. Gill, ‘‘Detection of rogue access point in wlan using hopfield neural network,’’Int. J. Elect. Comput. Eng. (IJECE), vol. 7, no. 2, pp. 1060–1070, 2017.
[7] M. Agarwal, S. Biswas, and S. Nandi, ‘‘Advanced stealth man-in-the-middle attack in WPA2 encrypted Wi-Fi networks,’’IEEE Commun. Lett., vol. 19, no. 4, pp. 581–584, Apr. 2015.
[8] G. Thamilarasu, S. Mishra, and R. Sridhar, ‘‘A cross-layer approach to detect jamming attacks in wireless ad hoc networks,’’ in Proc. IEEE Military Commun. Conf. (MILCOM), Oct. 2006, pp. 1–7.
[9] X. Wang, J. S. Wong, F. Stanley, and S. Basu, ‘‘Cross-layer based anomaly detection in wireless mesh networks,’’ inProc. 9th Annu. Int. Symp. Appl. Internet, 2009, pp. 9–15.
[10] G. Shafer,A Mathematical Theory of Evidence. Princeton, NJ, USA: Princeton Univ. Press, 1976.
[11] P. Xu, Y. Deng, X. Su, and S. Mahadevan, ‘‘A new method to determine basic probability assignment from training data,’’Knowl.-Based Syst., vol. 46, no. 1, pp. 69–80, 2013.
[12] C. Esposito, M. Ficco, F. Palmieri, and A. Castiglione, ‘‘Smart cloud storage service selection based on fuzzy logic, theory of evidence and game theory,’’IEEE Trans. Comput., vol. 65, no. 8, pp. 2348–2362, Aug. 2016. [13] A. G. Fragkiadakis, V. A. Siris, and A. P. Traganitis, ‘‘Effective and robust detection of jamming attacks,’’ inProc. Future Netw. Mobile Summit, 2010, pp. 1–8.
[14] T. M. Cover, ‘‘A hierarchy of probability density function estimates,’’ in
Proc. Frontiers Pattern Recognit., 2014, pp. 83–98.
[15] M. X. Ma, H. Y. Ngan, and W. Liu, ‘‘Density-based outlier detection by local outlier factor on largescale traffic data,’’Electron. Imag., vol. 14, pp. 1–4, 2016.
[16] K. G. Kyriakopoulos and F. J. Aparicio-Navarro. Man-in-the-Middle, De-Authentication and Rogue AP Attacks in 802.11 Networks. Accessed: May 10, 2018. [Online]. Available: https://doi.org/ 10.17028/rd.lboro.4746844.v1
[17] T. M. Chen and V. Venkataramanan, ‘‘Dempster-Shafer theory for intrusion detection in ad hoc networks,’’IEEE Internet Comput., vol. 9, no. 6, pp. 35–41, Nov. 2005.
[18] Q. Chen and U. Aickelin, ‘‘Anomaly detection using the Dempster-Shafer method,’’ inProc. Int. Conf. Data Mining (DMIN), 2006, pp. 232–240. [19] L. Arockiam and B. Vani, ‘‘Framework to detect and prevent medium
access control layer denial of service attacks in wlan,’’Int. J. Comput. Netw. Wireless Commun., vol. 3, no. 2, pp. 152–159, 2013.
[20] Z. Afzal, J. Rossebø, B. Talha, and M. Chowdhury, ‘‘A wireless intrusion detection system for 802.11 networks,’’ inProc. Int. Conf. Wireless Com-mun., Signal Process. Netw. (WiSPNET), 2016, pp. 828–834.
[21] M. Hairer and H. Shen, ‘‘A central limit theorem for the KPZ equation,’’
Ann. Probability, vol. 45, no. 6B, pp. 4167–4221, 2017.
[22] L. Bain,Statistical Analysis of Reliability and Life-Testing Models: Theory and Methods. Evanston, IL, USA: Routledge, 2017.
[23] S. M. Ross, Introduction to Probability Models. Orlando, FL, USA: Academic, 2014.
[24] D. Arthur and S. Vassilvitskii, ‘‘k-means++: The advantages of careful seeding,’’ inProc. 18th Annu. ACM-SIAM Symp. Discrete Algorithms. Philadelphia, PA, USA: SIAM, 2007, pp. 1027–1035.
[25] O. Sutton, ‘‘Introduction to k nearest neighbour classification and con-densed nearest neighbour data reduction,’’ Dept. Math., Univ. Leicester, Leicester, U.K., Tech. Rep., Feb. 2012, pp. 1–10,
[26] D. Taniar and W. Rahayu, ‘‘A taxonomy for nearest neighbour queries in spatial databases,’’J. Comput. Syst. Sci., vol. 79, no. 7, pp. 1017–1039, 2013.
[27] G. W. Corder and D. I. Foreman,Nonparametric Statistics for Non-Statisticians: A Step-by-Step Approach. Hoboken, NJ, USA: Wiley, 2009. [28] C. Devine and T. Otreppe. Aircrack-NG. Accessed: May 10, 2018.
[Online]. Available: https://www.aircrack-ng.org/
[29] Airpwn Packet Injection Framework. Accessed: May 10, 2018. [Online]. Available: http://airpwn.sourceforge.net/Airpwn.html