White Rose Research Online
[email protected]
Universities of Leeds, Sheffield and York
http://eprints.whiterose.ac.uk/
This is a copy of the final published version of a paper published via gold open access
in
Lighting Research and Technology
.
This open access article is distributed under the terms of the Creative Commons
Attribution NonCommercial 3.0 License
(
http://www.creativecommons.org/licenses/by-nc/3.0/
) which permits
non-commercial use, reproduction and distribution of the work without further
permission provided the original work is attributed.
White Rose Research Online URL for this paper:
http://eprints.whiterose.ac.uk/81117
Published paper
Predicting lamp spectrum effects at mesopic levels.
Part 2: Preferred appearance and visual acuity
SA FotiosPhD andC ChealPhD
School of Architecture, University of Sheffield, Sheffield, UK
Received 13 October 2010; Revised 16 November 2010; Accepted 22 November 2010
Laboratory tests were carried out to investigate lighting for pedestrians at mesopic levels under lamps of different spectral power distribution. This paper reports an evaluation of lamp spectrum effects on visual acuity, using Landolt ring charts of high and low luminance contrast, and forced choice judgements of the preferred appearance of human hands, a colour array and an illuminated space. These were carried out alongside judgements of brightness reported in a previous paper. Five types of lamp were used, including standard high pressure sodium, two metal halide and a fluorescent lamp of broader spectral distribution and a two-colour solid state device (LED). It was found that lamp spectrum affected judgements of preferred appearance, with the high pressure sodium and LED lamps being considered poor compared with the two metal halide lamps; these results correlated better with the CIE General Colour Rendering Index than other metrics of lamp spectral characteristics. It was also found that acuity was affected by lamp spectral power distribution, with the high pressure sodium (HPS) lamp enabling more Landolt rings to be correctly read than lamps of higher S/P ratio.
1. Introduction
This paper discusses lamp spectral power distribution (SPD) and lighting for pedes-trians in residential streets. In the UK, where lighting in subsidiary streets is designed for the demands of the pedestrian, the design illuminance is specified through two docu-ments. BS EN 13201-2:20031 specifies the minimum maintained average horizontal photopic illuminance for six lighting classes, the S-series, ranging from S6¼2.0 lx to S1¼15.0 lx. BS5489-1 : 20032 is a code of practice and this suggests a strategy for the selection of a lighting class according to crime rate, environmental zone and traffic flow. Furthermore, BS5489-1:2003 suggests a
reduction of one S class (i.e. a reduced illuminance) if lamps of general colour ren-dering index (CRI) Ra60 are used. It is
recognised that CRI may not be an appro-priate metric for defining the impact of lamp spectrum on visual tasks other than the naturalness of colours, and furthermore that the threshold value of 60 is arbitrary. This study was carried out to improve the charac-terisation of lamp SPD and illuminance for visual tasks pertinent to pedestrians at night time.
In residential areas, there is a need for areas to appear brightly lit as people link spatial brightness with safety. Lighting makes an important contribution to making a place feel safe3 and the higher the perception of brightness, the greater the feeling of safety.4 The first part of this report5investigated lamp SPD and illuminances for equal brightness at mesopic levels and found higher correlation with the ratio of scotopic to photopic Address for correspondence: SA Fotios, School of
Architecture, University of Sheffield, Crookesmoor Building, Conduit Road, Sheffield S10 1FL, UK.
luminances (S/P ratio) of the light source than with other lamp characteristics such as CRI, correlated colour temperature (CCT) and gamut area index (GAI).6 The new CIE recommended system for visual performance based mesopic photometry7 which uses the S/P ratio as an input variable, was also found to correlate well with illuminance ratios for equal brightness and thus provides a recog-nised system for predicting the relationship between lamp type and illuminance for a given level of brightness. However, it would be a mistake to recommend lighting based on brightness effects without consideration as to whether or not that lighting would be accept-able to users and how the lighting affected the ability to perform visual tasks. Hence along-side brightness matching trials5 preference judgements (of skin appearance, colours and the lit space) were carried out to give a measure of acceptability and on-axis visual acuity was measured using a Landolt ring task. A review8 of previous studies of visual acuity at mesopic levels concluded that there is little evidence that SPD can affect foveal visual acuity of achromatic targets in mesopic conditions and this was subsequently con-firmed using a Landolt ring test.9At photopic levels, there is disagreement about the extent to which changes in visual acuity caused by differences in SPD matter to the performance of visual tasks in realistic conditions,10,11 a possible explanation being that the effect of SPD is important only when the task is reduced to threshold conditions, these being below normal experience. To exaggerate any difference between different types of light source visual acuity was further examined using an achromatic Landolt ring task of low luminance contrast; the contribution of lumi-nance contrast to identification would thus be reduced, enabling a contribution to acuity from the parvocellular pathways to become more prominent.
The SPD of a light source affects the colour rendition of illuminated surfaces, thus if the
appearance of a surface changes under differ-ent lamps it is possible that its appearance will be preferred more under some types of lamp than others. Schanda12 suggested that the colour appearance of the human complexion may be a key consideration in determining the acceptability of a light source and Kanaya
et al.13 suggested that the appearance of human skin is the tool used in real situations by naı¨ve observers to determine the accept-ability of an illumination. There is some evidence that lamp SPD effects the appear-ance of skin at photopic levels: Quellman and Boyce14 examined preferred appearance of a range of skin tones under different types of lamp and found significant differences between the skin types as to their preference for lamp type. While it may be expected that the preferred appearance of coloured surfaces would change with lamp type, no evidence pertinent to mesopic light levels was located. What is known is that lamp type affects the ability to name colours at mesopic levels, with lamps of higher CRI enabling a higher colour naming accuracy than lamps of lower CRI and this difference diminishes as the lumi-nance decreases towards the scotopic state.9,15,16 Thus, judgements of preferred appearance of hands and colours were carried out under different light sources to give an indication of the acceptability of different light sources.
2. Method
rather a two-colour LED. The preference judgements employed side-by-side (simulta-neous) evaluations and for these the five lamps were observed in all 10 possible paired com-parisons. A sixth type of lamp (CFL: 3729 K,
Ra 79) was used for null condition trials,
forming an eleventh lamp pair.
The viewing chamber of each booth was of approximate dimensions 575 mm deep
680 mm wide660 mm high. The interior surfaces were painted matt grey (Munsell N5) and contained coloured objects, these being four pyramids 60 mm high, one each made from red, green, yellow and blue card. The test lamps were fitted behind the booths.
Light was conveyed into the top of the booth through an internally reflective pipe of diam-eter 190 mm. The illuminance in a booth was adjusted by a rotary control connected to an iris in the pipe, enabling the illuminance to be varied without affecting the SPD or spatial distribution of light. A translucent diffuser was placed above the visible chambers of the booths to further reduce differences in spatial distribution of light between stimuli. Surface luminances were measured at 14 points in each booth to assess the stability of the relative luminance distribution between dif-ferent combinations of lamps and between the two booths. No significant differences were found between the left- and right-hand booths, or between changes in light sources. A reference illuminance of 5.0 lx was used for these trials, measured at the centre of the floor of the booths. The mean luminance of the 14 points at 5.0 lx was approximately 0.25 cd/m2.
Luminances were measured using a
Konica Minolta LS100 luminance meter and illuminances were measured using Konica Minolta T-10 illuminance meters, one per booth. These metres have a spectral sensitivity that closely matches the standard photopic observer, giving an accuracy within2% and all metres were calibrated by Konica-Minolta immediately prior to these tests. The spectral correction factor for HPS lamps and those of broader distribution with this standard of photometer is less than 1%.17,18
Integrating box
Translucent diffuser
Acuity chart
37° visual angle
71° visual angle Light
pipe
Iris damper
Lamp
Lamp housing
Lamp
660 mm
1615 mm
680
mm
[image:4.536.55.256.71.344.2]1000 mm 575 mm
Figure 1 Vertical and horizontal sections through the side-by-side booths used in the tests Notes: The per-pendicular distance from the back wall of the booths to the observer’s eyes when judging preferred appearance is 1575 mm. When reading the acuity chart the observer was seated in line with the central partition between the booths at a distance of 1615 mm from the observer’s eyes to the acuity chart on the back wall of a booth
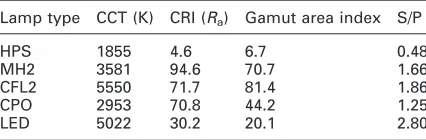
Table 1 Description of the lamps used in the preference and acuity tests
Lamp type CCT (K) CRI (Ra) Gamut area index S/P
HPS 1855 4.6 6.7 0.48
MH2 3581 94.6 70.7 1.66
CFL2 5550 71.7 81.4 1.86
CPO 2953 70.8 44.2 1.25
LED 5022 30.2 20.1 2.80
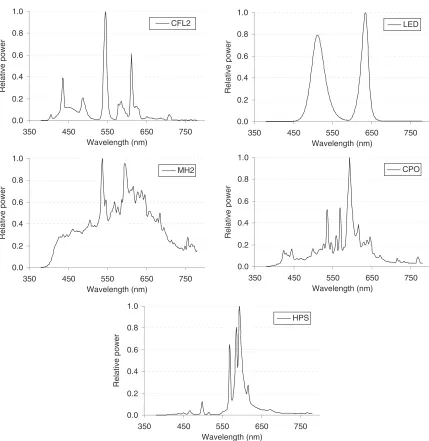
[image:4.536.275.488.96.166.2]Preference was judged by appraisal of three items:
Preferred appearance of hands: following the approach used by Quellman and Boyce,14 the test participant stood
immediately in front of the booths and placed one hand into each booth so that the appearance of human skin could be judged.
Preferred appearance of colours: a Macbeth 24 square colour rendition chart was placed
0.0 0.2 0.4 0.6 0.8 1.0
Wavelength (nm)
Relative power
CFL2
0.0 0.2 0.4 0.6 0.8 1.0
Wavelength (nm)
Relative power
LED
0.0 0.2 0.4 0.6 0.8 1.0
Wavelength (nm)
Relative power
MH2
0.0 0.2 0.4 0.6 0.8 1.0
Wavelength (nm)
Relative power
CPO
0.0 0.2 0.4 0.6 0.8 1.0
350 450 550 650 750 350 450 550 650 750
350 450 550 650 750 350 450 550 650 750
350 450 550 650 750
Wavelength (nm)
Relative power
[image:5.536.54.483.66.507.2]HPS
flat on the floor of each booth, at the front edge, on each side of the central partition. This was again judged when stood imme-diately in front of the booths.
Preferred appearance of the lit space: to gain a judgement of the appearance of an illuminated space rather than of specific objects, the booths were observed without the presence of hands or the colour chart. This judgement was made when seated 1.0 m in front of the booths.
Test participants were asked in which booth they preferred the appearance of the target object, a forced choice task. Preference judge-ments recorded when lighting from both lamps in a pair were set to equal illuminance provided a comparison which controls all variables other than lamp type. However, an application of these data is lighting that is matched for equal brightness not equal illu-minance, and lighting from two lamps matched for equal brightness may be of unequal illuminance.5Therefore, these prefer-ence judgements were recorded on two occa-sions, first, at equal illuminance, with both booths set to the reference illuminance (5.0 lx) and second, at equal brightness, this being the final one of the four brightness matches set by the test participants. The location of lamps to the left- and right-hand booths was counter-balanced between subjects.
On-axis visual performance was examined using low- and high-contrast Landolt ring acuity charts, and in trials these charts were located on the vertical rear wall of one of the booths. The Landolt rings were printed on grey A4 paper (Daler Rowney Canford, dreadnought grey matt paper, 150 gsm) having a reflectance of approximately
r¼0.20. An acuity chart had 12 rows each of five equally sized Landolt rings and mul-tiple versions of the chart with varying gap directions were used. The spacing between Landolt rings in each row was equal to half the diameter of a Landolt ring on that row,
while between-row spacing was equal to twice the diameter of the Landolt rings on the smaller (lower) row: a constant relationship between target size and row spacing was also used for the Bailey–Lovie visual acuity chart.19 With the current charts viewed from a distance of 1615 mm the visual angle sub-tended by the Landolt ring gap decreased from 8.5 minute arc on the top row to 0.7 minute arc on the bottom row, using 0.1 log unit steps as on the Bailey–Lovie chart.19 Luminance contrasts of the Landolt rings to their background wereC¼0.22 for the low contrast chart and C¼0.87 for the high-contrast chart, as measured under a Verivide D65 daylight simulating fluorescent lamp. These ranges of target size and target contrast were determined using acuity and contrast threshold results from previous study9 and were expected to allow all participants to read the largest chart row with 100% accuracy while no one could read the smallest row. The two levels of contrast are also similar to those used by Vrabelet al.20Viewing distance to the centre of the chart was approximately 1615 mm. In order that the threshold perfor-mance level was reached, following previous study,10 participants were instructed to pro-vide a ‘best guess’ when they could not see the Landolt ring orientation. The acuity task ended only when the next (i.e. smaller) row could not be seen to consist of individual symbols.
Luminance of the test chart was measured at five locations, the centres of the top row and bottom row and at three points equally spaced in between these. The range of lumi-nances down the chart for the MH2 lamp, for example, were 0.258 cd/m2 at the top line to 0.224 cd/m2 at the bottom line.
surfaces visible to the test participant had luminances below 3 cd/m2. In this time, the participant was given instructions for the test procedure. The table lamp was then switched off for a further 10 minutes of adaptation. For a given lamp pair the test procedure was:
1) Preference judgements and brightness dis-crimination at equal illuminances (5.0 lx).
2) Brightness matching. Each test participant provided four brightness matches for each lamp pair, counterbalancing both the ini-tial illuminance of the variable stimulus (set by the experimenter to an illuminance clearly higher or lower than the reference) and application of dimming to both sources. These four trials were attempted in a random order.
3) With the illuminance setting of the test participant’s final brightness match, the three preference judgements were repeated at this setting of equal brightness.
4) Visual acuity was examined using the low-and high-contrast charts presented in one booth set to an illuminance of 5.0 lx. The iris in the light pipe connected to the other booth was fully closed. Presentation order of the high- and low-contrast charts was counterbalanced.
The same procedure was used for all 10 lamp pairs and the null condition pair (except that the acuity test was not carried out with the null condition lamps), and these lamp pairs were presented in an order that was balanced between participants. The lamp housing behind each booth accommodated only a single type of lamp, these being fixed to trays and the experimenter slid alternate lamp trays into position between trials. The lamp trays were assembled, so that when slotted into the housing the centre of the light source was aligned with the centre of the light pipe. For the HPS, CFL2, MH2 and CPO
lamps a warm-up period of 5 minutes was allowed, this having previously been found sufficient to enable the SPD to stabilise. The LED lamp, however, required much longer to stabilise, approximately 90 minutes and thus, this lamp was switched on prior to a test session and kept in an adjoining room until it was needed.
Thirty-eight test participants were used, this number being chosen to meet the demands of the variance stable rank sums (VSRS) method for analysing data from the preference judgements.21 All subjects were confirmed as having colour-normal vision using the Ishihara test. Fourteen test partic-ipants were male and 24 were female; 21 were young (aged 18–34), 14 were in the 35–54 age group and 3 were older than 55 years.
3. Results and analysis
3.1 Null condition preference results
The preference task was carried out with the same type of lamp (CFL) in both booths. Table 2 shows the null condition results, formatted to analyse for differences between the left- and right-hand booths and between the two supposed identical lamps used in the null condition trials which were nominally labelled CFLA and CFLB. There were 38
trials, and in the absence of bias the prefer-ence judgements would tend towards 19 (i.e. 50%) in each case. Differences were examined using the binomial test.
Table 2 indicates there was a slight ten-dency to prefer lighting from CFLA rather
than CFLB but the binomial test does not
suggest these differences to be significant. The mean number of votes for CFLAacross all six
Null condition data from the preference trials do not suggest a difference between the two booths. The results of the brightness matching and brightness discrimination null condition tests also suggest that any differ-ences between the booths other than lamp type were negligible.5
3.2 Preferred appearance results
The preference results are shown in Table 3. These data are the percentage of judgements by which the target object under one of each pair of lamps was preferred when presented at equal illuminance and at equal brightness. The MH2 and CPO lamps appear to be the most preferred and the HPS and LED the least preferred. Table 4 shows the total preference votes awarded to each lamp across all paired comparisons in rank order of preference for each target item. The rank order of lamps is not same for every item but there is an apparent trend. The two lamps with the lowest preference scores tend to be
the HPS and LED lamps, except for the appearance of hands where CFL2 has a low score. MH2 and CPO have the highest preference scores for all six items except for the appearance of the space at equal illumi-nance where CFL2 has a higher score than CPO but this is only by one point.
Differences between the lamps were ana-lysed using VSRS.21 The trial was designed with the express intent of analysing the results using VSRS because it was previously applied to discrimination data in the Quellman and Boyce14 study of preferred skin appearance and because the type of data matches that described for use with VSRS.21 Figure 3 shows the lamps which the VSRS test does not find the preference scores to be signifi-cantly different (i.e.p40.05).
[image:8.536.44.489.85.155.2]The pattern apparent in Figure 3 supports the observations drawn from Tables 3 and 4, that the HPS and LED lamps tended to offer the least preferred appearance of hands, colour array and space and the MH2 lamp
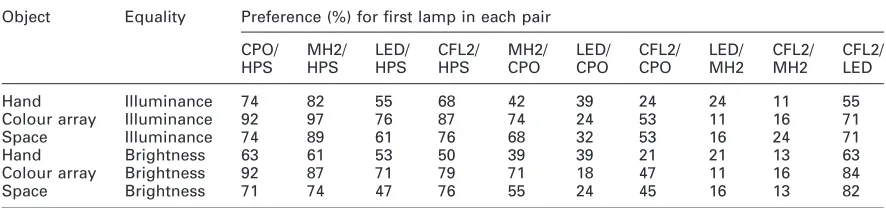
Table 3 Results of the preferred appearance tests; percentage frequency by which the first lamp in each pair was reported to give the preferred appearance of the target object. (n¼38 in each case)
Object Equality Preference (%) for first lamp in each pair
CPO/ HPS
MH2/ HPS
LED/ HPS
CFL2/ HPS
MH2/ CPO
LED/ CPO
CFL2/ CPO
LED/ MH2
CFL2/ MH2
CFL2/ LED
Hand Illuminance 74 82 55 68 42 39 24 24 11 55
Colour array Illuminance 92 97 76 87 74 24 53 11 16 71
Space Illuminance 74 89 61 76 68 32 53 16 24 71
Hand Brightness 63 61 53 50 39 39 21 21 13 63
Colour array Brightness 92 87 71 79 71 18 47 11 16 84
Space Brightness 71 74 47 76 55 24 45 16 13 82
Table 2 Results of the brightness matching null-condition tests
Comparison Result for Equal illuminance Equal brightness
Hands Colour array Space Hands Colour array Space
Spatial position (left-hand vs. right-hand booth
Left-hand booth 21 15 17 22 25 17
Lamp (CFLAvs. CFLB) CFLA 24 24 22 19 22 20
[image:8.536.47.490.226.330.2]and CPO lamps tended to offer the most preferred appearance of these items. This order is supported by the results from all three observation targets; hands, the colour array and the whole space.
Judgements of hand appearance provide the least ambiguity, their being a clear distinction between two groups of lamps, with the HPS, LED and CFL2 providing least preferred hand appearance and the CPO and MH2 providing most preferred hand appearance. For preferred appearance of colours and the whole space, Figure 3 dem-onstrates some overlap; in judgements of the
space at equal illuminance, for example, the HPS and LED are equally preferred and the LED, CFL2 and CPO are equally preferred, but the CFL2 and CPO have significantly higher preference than the HPS.
Figure 3 shows that preference judgements made at equal illuminance and equal bright-ness are reasonably similar. Differences may be explained by differences in illuminance at equal brightness. Consider for example, judgements of the space: at equal illuminance the HPS lamp has a lower preference than the CFL2, but at equal brightness, where the HPS illuminance tended to be higher than the
Observation HPS LED CFL2 CPO MH2
Hands, equal illuminance
Hands, equal brightness
Colour array, equal illuminance
Colour array, equal brightness
Space, equal illuminance
[image:9.536.46.493.85.172.2]Space, equal brightness*
Figure 3 Results of the analysis of preference judgements using the Dunn-Rankin VSRS. This shows lamps which are not suggested to be significantly different (i.e.p40.05) in preferred appearance judgements. (Note*; for preferred appearance of space at equal brightness, the HPS and CFL2 lamps have equal preference scores and the HPS and LED have equal preference, but the LED and CFL2 preference scores were different (p50.05)
Table 4 Overall preference scores and rank order of lamps
Appearance of hands Appearance of colour array Appearance of space
Equal illuminance Equal brightness Equal illuminance Equal brightness Equal illuminance Equal brightness
HPS 46 CFL2 56 HPS 18 HPS 27 HPS 38 LED 40
CFL2 60 LED 57 LED 53 LED 44 LED 52 HPS 50
LED 62 HPS 66 CFL2 86 CFL2 86 CPO 84 CFL2 82
CPO 102 CPO 100 CPO 92 CPO 97 CFL2 85 CPO 94
MH2 110 MH2 101 MH2 131 MH2 126 MH2 121 MH2 114
[image:9.536.126.413.214.401.2]CFL2 illuminance5 the difference in their preference scores was not suggested to be different.
The results of the preference tests suggest that lighting from the MH2 and CPO lamps would be the most acceptable, while lighting from the HPS and LED would be the least acceptable. The rank order of brightness of these lamps was suggested to be (in descend-ing order of brightness) LED, CFL2, MH2, CPO, HPS,5 so the LED lamp, considered to be the brightest, was one of the least acceptable.
3.3 Predicting preferred appearance
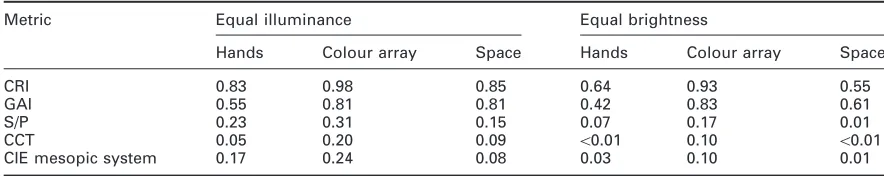
To explore metrics for predicting preferred appearance the test results were plotted against a range of metrics for characterising lamp SPD, i.e. CRI, CCT, GAI and the S/P ratio, and also the CIE system for mesopic photometry.7 The coefficient of determina-tion (R2) of linear regression between the plotted variables was used as a measure of the amount of variability in preference that is explained by each metric.22 A higher R2
suggests a better prediction of preference, although it cannot be used to infer a causal relationship.
This was done initially for ratios of pref-erence scores for each of the 10 lamp pairs and ratios of the prediction metrics. This approach follows that used for the brightness data5 and, because it employs 10 data points (the 10 lamp pairs) rather than the five individual lamps, it improves confidence in the regression relationship. Table 5 shows the
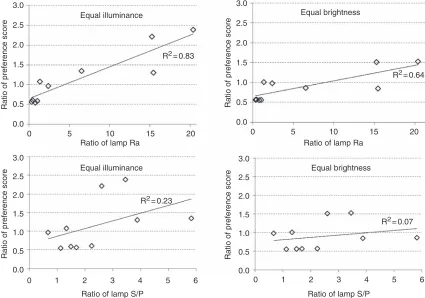
R2values. It is clear that the best prediction of preference is found with the CIE General CRI, followed by GAI. The S/P ratio, CCT and CIE mesopic photometry give poor predictions of preference. Figure 4 shows linear regressions for the results of the preferred appearance of hands at equal illu-minance and equal brightness against ratios of CRI and the S/P ratio.
This analysis was repeated using absolute values of preference scores and prediction metrics. This was done by taking the mean preference score for each lamp averaged across the three rated items (hands, colours and space) for equal brightness and equal illuminance separately and for the two com-bined. There was negligible difference between these approaches to analysing the data. It was again found that CRI gave the best predic-tion of preference (R240.85), followed by GAI (R2¼0.5–0.6) and CCT and the S/P ratio both gave poor predictions (R250.03). Figure 5 shows preference scores for the five lamps, these being the mean of judgements for the three items at equal illuminance and equal brightness, plotted against CRI (R2¼0.91).
[image:10.536.46.488.540.628.2]This analysis suggests that CRI gives a prediction of the preferred appearance of hands, a colour array and a lit space, at mesopic levels under lighting of different SPD that is more precise than does the S/P ratio, CCT, CRI, gamut area and the CIE mesopic system for mesopic photometry. However, it is evident from these results that CRI is not perfect; note for example that while CPO has a higher preference than CFL2 for hand
Table 5 Coefficient of determination (R2) between ratios of lamp metrics and ratios of preference scores
Metric Equal illuminance Equal brightness
Hands Colour array Space Hands Colour array Space
CRI 0.83 0.98 0.85 0.64 0.93 0.55
GAI 0.55 0.81 0.81 0.42 0.83 0.61
S/P 0.23 0.31 0.15 0.07 0.17 0.01
CCT 0.05 0.20 0.09 50.01 0.10 50.01
appearance they have almost the same CRI. These metrics were examined following con-sideration for predicting brightness5and prac-tical lighting guidance requires as few as possible metrics. Alternative metrics for char-acterising colour rendering properties are being evaluated in CIE Technical Committee 1-69, and the proposals from this committee will be used to re-examine the current data.
[image:11.536.55.480.73.371.2]3.4 Acuity results
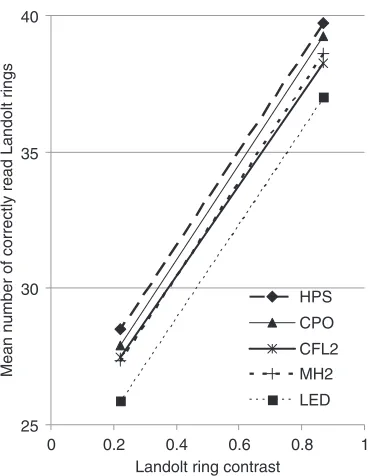
Figure 6 shows the results of the acuity tests. Following previous study,15 the acuity test was analysed by counting number of Landolt ring gap directions correctly identi-fied in each test condition. Analysis of the
3.0
Equal illuminance
R2= 0.83
Ratio of preference score
2.5
2.0
1.5
1.0
0.5
0.0
0 5 10
Ratio of lamp Ra
15 20
3.0
Equal illuminance
R2= 0.23
Ratio of preference score
2.5
2.0
1.5
1.0
0.5
0.0
0 1 2 3 4
Ratio of lamp S/P
5 6
3.0
Equal brightness
R2= 0.07
Ratio of preference score
2.5
2.0
1.5
1.0
0.5
0.0
0 1 2 3 4
Ratio of lamp S/P
5 6
3.0
Equal brightness
R2= 0.64
Ratio of preference score
2.5
2.0
1.5
1.0
0.5
0.0
0 5 10
Ratio of lamp Ra
15 20
Figure 4 Results of the preference tests for the appearance of test subjects’ hands. The left-hand graphs are for judgements made when the two booths were set to equal illuminance, and the right-hand graphs are for judgements made following a match for equal brightness
0 20 40 60 80 100
0 20 40 60 80 100 120 140
Preference score
CIE general colour rendering index (Ra)
[image:11.536.53.257.434.585.2]data did not suggest they were drawn from a normally distributed population. Hence, the primary statistical analyses of difference were carried out using non-parametric tests, the Wilcoxon signed ranks test for comparing two conditions and Friedman’s test for three or more conditions.23 Parametric tests are better at detecting differences than non-parametric tests23 and therefore the conclu-sions drawn were subsequently reviewed using parametric tests, the t-test and analysis of variance (ANOVA) for two conditions and three or more conditions, respectively. The
t-test is suggested to be robust against non-normal populations for larger samples even though the data may be non-normal to a noticeable degree.24 The current sample size of n¼38 is only just below the threshold of
n40 for which it is suggested the t-test can be applied to all distributions.25
Each test participant carried out the low-and high-contrast tasks under each type of
lamp on two separate occasions. Comparison of results gained on the first and second trials suggests a slight learning effect: the mean ratios of scores (second/first) for the 10 test conditions (5 lamps2 target contrasts) were greater than 1.0 in eight conditions, with a maximum ratio of 1.05 and a minimum of 0.98. Wilcoxon’s test does not suggest differ-ences between the first and second trials to be significant for any of the 10 test conditions, and the results shown in Figure 6 are the summation of Landolt rings correctly read in both trials.
Figure 6 suggests that the HPS lamp allowed the greatest number of Landolt rings to be correctly read and the LED the least. Analysis of the results (number of Landolt rings correctly read) using Friedman suggested a significant effect of lamp type (p50.001) for both low- and high-contrast tasks. Analysis using ANOVA suggested that there were significant differences between lamp type (p50.001) and between the two levels of contrast (p50.001) but there was no indica-tion of a significant interacindica-tion between lamp type and contrast (p¼0.761).
Differences between each lamp pair in the number of correctly read Landolt rings were examined using the Wilcoxon test. Conclusions drawn for the low-contrast chart were the same as for the high-contrast chart except for the case of the CPO–CFL2 lamp pair, where results from the high-contrast chart suggest a difference between the lamps (p50.05) but results from the low-contrast chart do not (p40.30). Analysis of differences between lamps was made by con-sideration of the overall pattern of results and also by setting a threshold value of p50.005 to counter capitalising on chance, i.e. the Bonferroni correction to the standard thresh-oldp50.05 for 10 cases.
When interpreted alongside Figure 6 sta-tistical analyses suggest that the LED lamp enabled a lower number of Landolt rings to be correctly identified than did any of the
25 30 35 40
0 0.2 0.4 0.6 0.8 1
Landolt ring contrast
Mean number of correctly read Landolt rings
[image:12.536.63.247.69.307.2]HPS CPO CFL2 MH2 LED
other four lamps (CFL,p50.005; HPS, CPO, MH2, p50.001). The HPS enabled more Landolt rings to be correctly identified than did the MH2 lamp (p50.005) and the CFL2 lamp for the high-contrast task (p50.001), but there was no significant difference between the HPS lamp and the CPO lamp or the CFL2 lamp at low task contrast. Differences between the CPO, MH2 and CFL2 lamps were not suggested to be signif-icant although if the threshold value for a significant difference is retained at p50.05 there are two differences in conclusions about visual acuity drawn from this analysis: the CPO–CFL2 lamps are different at high con-trast, and the HPS–CFL2 lamps are different at low contrast. Overall though, the differ-ences between lamps for visual acuity are small: the greatest difference is that HPS lighting allowed approximately five more Landolt rings to be read than did LED lighting.
Figure 6 suggests that the number of Landolt rings correctly read was greater at the higher contrast than at the lower contrast. For each of the five lamps, the effect of contrast was suggested to be significant (p50.001, Wilcoxon and t-test). The rank order of lamps did not change with the change in contrast.
In previous study, it was found that lamp SPD did not affect visual acuity.9A difference between these two studies is that in the current study test participants were given stronger encouragement to attempt difficult-to-read rows, following the comments from Berman et al.10 This was done by instructing the test participant to attempt to identify gap directions if they could detect the next (i.e. smaller) complete row of Landolt rings.
These results suggest an inverse relation-ship with the S/P ratio, with lighting of lower S/P ratio leading to an increase in Landolt rings correctly read. In addition to disagree-ment with previous studies at mesopic levels which suggest no effect of SPD on visual
acuity8,9 this trend is in opposition to those studies at photopic levels which report a significant effect of SPD on acuity,10,26 with lamps of higher S/P ratio leading to an improvement in acuity and this is apparently due to smaller pupil sizes. The inverse rela-tionship between S/P ratio and visual acuity found in this study is therefore unexpected. Differences in the luminance contrast of the Landolt rings against the background under different light sources were negligible and therefore unable to explain differences in acuity. Further study is being planned to determine if this result is coincidental or is a salient visual phenomenon.
4. Conclusion
These tests suggest that lamp SPD affects the preferred appearance of objects and visual acuity at mesopic light levels. The appearance of human hands, a colour array and a lit space tended to be preferred more when using lighting of higher CRI, and this was found in judgements made with lamps matched for equal illuminance and for equal brightness. There was a slight increase in the ability to read foveal achromatic Landolt rings with HPS lighting compared with the other lamps used, while the LED lighting gave the poorest ability to read the Landolt rings, an inverse relationship with the S/P ratio. It appears that the effect of SPD on acuity was gained by forcing test subjects to attempt targets at threshold levels, so further data are needed to determine the significance of this for tasks of supra-threshold acuity.
Acknowledgements
and Urbis Lighting; the side-by-side booths were procured through a CIE-UK grant.
References
1 British Standards Institution (BSI) BS EN
13201-2:2003.Road Lighting – Part 2:
Performance Requirements. London: BSI, 2003.
2 British Standards Institution (BSI)
BS5489-1:2003.Code of Practice for the Design of Road
Lighting – Part 1: Lighting of Roads and Public Amenity Areas. London: BSI, 2003.
3 Loewen LJ, Steel GD, Suedfeld P. Perceived safety from crime in the urban environment.
Journal of Environmental Psychology1993; 13: 323–333.
4 Boyce PR, Eklund NH, Hamilton B, Bruno LD. Perceptions of safety at night in different
lighting conditions. Lighting Research and
Technology2000; 32: 79–91.
5 Fotios S, Cheal C. Predicting lamp spectrum effects at mesopic levels. Part 1: Brightness.
Lighting Research & Technology (in press). 6 Rea MS, Freyssinier-Nova JP. Color
render-ing: A tale of two metrics. Color Research and
Application2008; 33: 192–202.
7 Commission Internationale de L’E´clairage.
Recommended System for Visual Performance Based Mesopic Photometry. CIE Publication 191. Vienna: CIE, 2010.
8 Fotios SA, Cheal C, Boyce PR. Light source spectrum, brightness perception and visual performance in pedestrian environments:
A review.Lighting Research and Technology
2005; 37: 271–294.
9 Fotios SA, Cheal C. Lighting for subsidi-ary streets: Investigation of lamps of different SPD. Part 1 : Visual performance.
Lighting Research and Technology2007; 39: 215–232.
10 Berman SM, Navvab M, Martin MJ, Sheedy J, Tithof WA. Comparison of traditional and high colour temperature lighting on the near acuity of elementary school children.
Lighting Research & Technology 2006; 38: 41–52.
11 Boyce PR, Akashi Y, Hunter CM, Bullough JD. The impact of spectral power distribution
on the performance of an achromatic visual
task.Lighting Research and Technology2003;
35: 141–161.
12 Schanda J. A combined colour
preference-colour rendering index.Lighting Research and
Technology1985; 17: 31–34.
13 Kanaya S, Hashimoto K, Kichize E.Subjective
balance between general color rendering index, color temperature, and illuminance of interior lighting:Proceedings of the CIE 19th Session (Kyoto), Vienna: CIE, 1979.
14 Quellman EM, Boyce PR. The light source color preferences of people of different skin
tones.Journal of the Illuminating Engineering
Society2002; 31: 109–118.
15 Boyce PR, Bruno LD. An evaluation of high pressure sodium and metal halide light sources for parking lot lighting.Journal of the
Illuminating Engineering Society,1999; 28: 16–32.
16 Chen L.The accuracy of color naming under
different light sources at low photopic to low mesopic conditions. MS thesis. Troy, NY: Rensselaer Polytechnic Institute, 1998.
17 Lambe R.Potential pitfalls when using
luxmeters and implications of lighting level on the relative efficiency of light sources: Proceedings of Lightec 96, Cambridge UK, Sept 9–10: 1996.
18 Konica Minolta.Luminance Meter LS-100
LS-110 Instruction Manual. Japan: Konica Minolta, 1987.
19 Bailey IL, Lovie JE. New design principles for
visual acuity letter charts.American Journal of
Optometry and Physiological Optics1976; 53: 740–745.
20 Vrabel PL, Bernecker CA, Mistrick RG. Visual performance and visual clarity under electric light sources: Part 1. Visual
perfor-mance.Journal of the Illuminating Engineering
Society1995; 24: 69–80.
21 Dunn-Rankin P, Knezek GA, Wallace S,
Zhang S.Scaling Methods. 2nd Edition,
Mahwah, NJ: Lawrence Erlbaum Associates, 2004.
22 Field A.Discovering Statistics Using SPSS.
London: SAGE Publications, 2005.
23 Coolican H.Research Methods and Statistics in
24 Crow EL, Davis FA, Maxfield MW.Statistics Manual. New York: Dover Publications, 1960.
25 Moore DS, McCabe GP.Introduction to the
Practise of Statistics, 2nd Edition, New York: WH Freeman, 1993.
26 Navvab MA. Comparison of visual perfor-mance under high and low color temperature
fluorescent lamps.Journal of the Illuminating