White Rose Research Online URL for this paper:
http://eprints.whiterose.ac.uk/77696/
Article:
Walton, RD, Benson, AP, Hardy, ME et al. (2 more authors) (2013) Electrophysiological
and structural determinants of electrotonic modulation of repolarization by the activation
sequence. Frontiers in Physiology, 4. 281. 1 - 14. ISSN 1664-042X
https://doi.org/10.3389/fphys.2013.00281
[email protected] https://eprints.whiterose.ac.uk/
Reuse
Unless indicated otherwise, fulltext items are protected by copyright with all rights reserved. The copyright exception in section 29 of the Copyright, Designs and Patents Act 1988 allows the making of a single copy solely for the purpose of non-commercial research or private study within the limits of fair dealing. The publisher or other rights-holder may allow further reproduction and re-use of this version - refer to the White Rose Research Online record for this item. Where records identify the publisher as the copyright holder, users can verify any specific terms of use on the publisher’s website.
Takedown
If you consider content in White Rose Research Online to be in breach of UK law, please notify us by
Electrophysiological and structural determinants of
electrotonic modulation of repolarization by the activation
sequence
Richard D. Walton1,2,3, Alan P. Benson1, Matthew E. L. Hardy1, Ed White1and Olivier Bernus1,2,3*
1Faculty of Biological Sciences, Multidisciplinary Cardiovascular Research Centre, School of Biomedical Sciences, Institute of Membrane and Systems Biology,
University of Leeds, Leeds, UK
2Unité Inserm 1045, Centre de Recherche Cardio-Thoracique, Université Bordeaux Segalen, Bordeaux, France 3L’Institut de Rythmologie et Modélisation Cardiaque, Université de Bordeaux, Bordeaux, France
Edited by:
Zhilin Qu, University of California, Los Angeles, USA
Reviewed by:
Zhilin Qu, University of California, Los Angeles, USA
Flavio H. Fenton, Cornell University, USA
*Correspondence:
Olivier Bernus, Inserm 1045, Centre de Recherche Cardio-Thoracique Unité, L’Institut de Rythmologie et Modélisation Cardiaque, Université Bordeaux Segalen, PTIB - Campus Xavier Arnozan, 144 rue Léo Saignat, Avenue du Haut Lévêque, 33600 Bordeaux, France
e-mail: olivier.bernus@ u-bordeaux2.fr
Spatial dispersion of repolarization is known to play an important role in arrhythmogenesis. Electrotonic modulation of repolarization by the activation sequence has been observed in some species and tissue preparations, but to varying extents. Our study sought to determine the mechanisms underlying species- and tissue-dependent electrotonic modulation of repolarization in ventricles. Epi-fluorescence optical imaging of whole rat hearts and pig left ventricular wedges were used to assess epicardial spatial activation and repolarization characteristics. Experiments were supported by computer simulations using realistic geometries. Tight coupling between activation times (AT) and action potential duration (APD) were observed in rat experiments but not in pig. Linear correlation analysis found slopes of−1.03±0.59 and−0.26±0.13 for rat and pig, respectively (p<0.0001). In rat, maximal dispersion of APD was 11.0±3.1 ms but dispersion of repolarization time (RT) was relatively homogeneous (8.2±2.7, p<0.0001). However, in pig no such difference was observed between the dispersion of APD and RT (17.8±6.1 vs. 17.7±6.5, respectively). Localized elevations of APD (12.9±8.3%) were identified at ventricular insertion sites of rat hearts both in experiments and simulations. Tissue geometry and action potential (AP) morphology contributed significantly to determining influence of electrotonic modulation. Simulations of a rat AP in a pig geometry decreased the slope of AT and APD relationships by 70.6% whereas slopes were increased by 75.0% when implementing a pig AP in a rat geometry. A modified pig AP, shortened to match the rat APD, showed little coupling between AT and APD with greatly reduced slope compared to the rat AP. Electrotonic modulation of repolarization by the activation sequence is especially pronounced in small hearts with murine-like APs. Tissue architecture and AP morphology play an important role in electrotonic modulation of repolarization.
Keywords: action potential duration, heterogeneity, ventricular repolarization, electrotonic current, cardiac electrophysiology
INTRODUCTION
Regional variations of the action potential duration (APD) are perhaps the best characterized form of electrophysiological het-erogeneity in the heart. It has been reported in a wide range of species that spatial gradients of APD exist from base to apex and in the transmural plane of healthy myocardium (Wan et al., 2000; Antzelevitch, 2005). Such variations in APD serve to co-ordinate repolarization time (RT) of tissue to maintain normal functioning of the heart and are determined at a cellular level by the density of transmembrane ionic currents in various regions of the heart (Nerbonne and Kass, 2005).
Abbreviations: 3D, Three-dimensional; AP, Action potential; APD, Action poten-tial duration; APD80, Action potential duration at 80% of repolarization; AT,
Activation Time; DT-MRI, Diffusion Tensor Magnetic Resonance Imaging; LV, Left ventricle; Pg, Pig geometry; Pk, Pig kinetics; Rg, Rat geometry; Rk, Rat kinetics;
RT, Repolarization time; RTmax, Maximum repolarization time; RTmin, Minimum
repolarization time.
boundaries and in directions of slow propagation (Zubair et al., 1994).
Several computational studies have investigated the effects of electrotonic currents on repolarization in cardiac tissue.Sampson and Henriquez (2005) for example, observed that electrotonic interactions could completely mask the intrinsic transmural APD gradient in the small mouse heart, but not in the larger rabbit heart. A more recent computational study byCherry and Fenton (2011) found that boundaries act as a sink and shorten APD in otherwise homogeneous tissues. Moreover, APD was abbrevi-ated where APs collide, or significantly increased where APs travel around sharp cusps in tissue geometry, such as occurring at the insertion site of the septum with the ventricular wall. In exper-iments, electrotonic modulation of repolarization by activation sequence has been observed to various extents in myocardium of different species, including humans, and various tissue prepara-tions (Franz et al., 1987; Laurita et al., 1997; Yuan et al., 2001; Banville and Gray, 2002; Yue et al., 2005; Chauhan et al., 2006; Hanson et al., 2009; Walton et al., 2010). However, the species-to-species variability and the effects of tissue geometry have not yet been shown nor elucidated experimentally.
In the present study we aimed to determine the mechanisms underlying species- and tissue-dependent electrotonic modula-tion of repolarizamodula-tion in ventricles. Therefore, we investigated acute electrotonic APD modulation by activation sequence in two distinct species, the rat and the pig, and two different tis-sue preparations, the intact heart (rat) and the left ventricular wedge preparation (pig). The rat is used extensively in cardiac electrophysiology studies (Macchi et al., 2004; Rossi et al., 2008; Wasserstrom et al., 2009), while the pig is more closely related to human in terms of cardiac electrophysiology (Yuan et al., 2001). We used an epi-fluorescence optical mapping technique that provides high spatio-temporal resolution of electrical activity (Walton et al., 2010) to relate epicardial AT to APD and RT. We also utilized detailed computational models of electrical propa-gation in realistic tissue geometries obtained by diffusion tensor magnetic resonance imaging (DT-MRI) to investigate the rela-tive roles of AP morphology and tissue geometry on electrotonic modulation of repolarization.
METHODS
TISSUE PREPARATION
All experimental protocols conformed to the Animals (Scientific Procedures) Act 1986. Male Wistar rats (N=8) weighing 220–250 g were euthanized by stunning and cervical dislocation and hearts rapidly excised. Hearts were submersed in cold (4◦C) cardioplegic solution containing (in mmol/L): glucose, 277.5; KCl, 30; NaHCO3, 25; mannitol, 34.3, pH 7.4. The aorta was
cannulated and perfused at 7 ml/min with bicarbonate buffered saline solution containing (mmol/L): NaCl, 130; NaHCO3, 24;
NaH2PO4, 1.2; MgCl2, 1; glucose, 5.6; KCl, 4; CaCl2, 1.8;
oxy-genated with 95% O2/5% CO2, pH 7.4, 37◦C. Female pigs
(24–26 Kg, N=9) were euthanized by intraperitoneal
injec-tion with sodium pentobarbital (35 mg/Kg) and the hearts were quickly excised. The aorta was cannulated and perfused with cold cardioplegic solution supplemented with heparin (5 U/ml). The left ventricular wall was dissected and the left anterior descending
coronary artery was cannulated and perfused with bicarbonate buffered saline solution at 20 ml/min. In all experiments, the per-fusate was supplemented with 10µM blebbistatin for mechanical
uncoupling of the myocardium.
OPTICAL MAPPING PROTOCOL AND SETUP
The tissue was stained with potentiometric dye DI-4-ANEPPS (50µg/ml bicarbonate buffered saline solution) via the perfusate
at the beginning of the experiment (Walton et al., 2010). Bipolar electrodes were used to stimulate the ventricles over a range of basic cycle lengths from 160 to 83 ms for rats and 1000–256 ms for pigs. Optical recordings were acquired through a high-frame-rate charge-coupled device video camera (SciMeasure Analytical systems, GA, USA) mounted with a lens (focal length 12 mm, 1:0.8 aperture ratio; Computar, London, UK). Excitation light from monochromatic LEDs, 530 nm, (Cairn Research Ltd, Kent, UK) illuminated the epicardial surface. Emission light from DI-4-ANEPPS was filtered through a broadband 700DF50 filter. Images (80×80 pixels) with pixel dimensions of 0.25×0.25 mm for rats and 0.4×0.4 mm for pigs were acquired at 1000 frames per s. Background fluorescence was subtracted from each frame to obtain the voltage-dependent optical signal. Optical APs acquired over 10 s were ensemble averaged and underwent temporal (3 ms kernel) and spatial (1.25 mm kernel) filtration.
DIFFUSION TENSOR MRI
We determined tissue geometry and architecture using DT MRI. Following optical mapping experiments, hearts, and ventricu-lar wedge preparations were perfused with 4% formalin. Fixed hearts were immersed in the perfluoropolyether Fomblin (Sigma-Aldrich, St. Louis, USA) to reduce noise and enhance image contrast. High resolution (200µm isotropic) imaging of the fiber
orientation was performed with a 9.4 T NMR instrument (Bruker BioSpin, Ettlingen, Germany). Diffusion of protons was mea-sured throughout the tissue in a set of 12 optimized directions (Papadakis et al., 1999) using a 3D diffusion-weighted spin-echo sequence with reduced encoding at 20◦C (500 ms repetition time; 15 ms echo time; diffusion gradients with 2 ms duration and 7 ms separation; b=1000 s mm−2). Diffusion tensors, and the
eigenvectors and eigenvalues of these tensors, were calculated from the diffusion measurements at each voxel throughout the tissue using in-house software. No smoothing or interpolation of the diffusion measurements was necessary: seeBenson et al. (2011b) for examples of the calculated fiber directions in rat hearts.
COMPUTER SIMULATIONS
As in previous studies we used a monodomain approach to simulate AP wave propagation in cardiac tissue (Walton et al., 2010). Realistic geometry and fiber orientation (represented in the models by the electrical diffusion tensor D) were obtained from DT-MRI (see above):
Dat a particular point in space is given by
D=D1I+(D1−D2)e1eT1
where D1 andD2 are electrical diffusions along and across the
is the primary eigenvector from DT-MRI, and the superscript T denotes vector transpose. We setD1to 0.095 mm2ms−1in the pig
model and 0.17 mm2ms−1in the rat model, which gave conduc-tion velocities of 0.6 ms−1in the fiber direction in both cases. For anisotropic propagation, we used a 1/4 diffusion ratio (i.e.,D2= D1/4) in rat and 1/9 diffusion ratio in pig, which gave
conduc-tion velocities of 0.3 and 0.15 ms−1, respectively, in the cross-fiber
direction to match conduction velocity ratios measured by optical mapping. Electrical excitation at a particular point in the heart is then given by
∂V
∂t = ∇(D∇V)−Iion
where V is membrane potential (mV), t is time (ms), ∇ is a spatial gradient operator, and Iion is total membrane ionic
cur-rent density (µA/µF). ForIionin the rat, we used the model of
Pandit et al. (2001)with constant ion concentrations,Q10
modi-fications for temperature as inNoujaim et al. (2007). In addition,
GCa,Lwas increased by 75% andGtodecreased by 25% so that the
model APD matched experimentally-recorded APDs. ForIionin
the pig, we used the Luo-Rudy dynamic guinea pig model (Faber and Rudy, 2000) (as no model for the pig is currently available), also with constant ion concentrations, and withGCa,Lincreased
by 25% and GKr andGKs both decreased by 30%, so that the
model APD matched experimentally-recorded pig APD. For a subset of simulations we increased GKr andGKs by a factor of
28.5 to match the pig APD to the rat APD. In the rat left ventri-cle a linear transmural gradient in selected ion channel densities was implemented as inPandit et al. (2001),Walton et al. (2010). For rat right ventricular tissue, the epicardial model conductances were scaled according to the values inBenoist et al. (2011). For the pig model, a transmural gradient was introduced by assum-ing the default model (Faber and Rudy, 2000) was epicardial, increasingGNaby 33% and reducingGtoby 64% for the
endocar-dial model, then linearly scaling these parameters as a function of transmural distance. In all cases, pacing was via a twice-diastolic threshold stimulus current for 10 beats (500 and 167 ms basic cycle lengths for the pig model or rat model, respectively). The models were coded in C, and solved using a forward-time center-space method (Press et al., 2007) and an operator splitting and adaptive time step technique (Qu and Garfinkel, 1999), with a fixed space step of 0.2 mm (as determined by the DT-MRI resolu-tion), a minimum time step oftmin=0.01 ms, and a maximum
time step of T=0.25 ms. No-flux boundary conditions were imposed by setting electrical diffusion along the vector normal to the local tissue surface to zero, a standard approach for finite difference models. See (Benson et al., 2008, 2011a) for further details.
DATA ANALYSIS AND STATISTICS
AT was measured at the level of the maximal time deriva-tive of the AP upstroke in experiments and simulations. APDs were measured from the AT to 80% of repolarization (APD80). RT was measured at the time of 80% of
repolar-ization (RT = APD80 + AT). Linear correlation analysis was
used to determine the relationship between AT and APD80
by comparing gradients of fits. Dispersion of APD80 and
RT were measured as the difference between their respective 5 and 95% confidence intervals of normal sample distribu-tions. Pixels incorporated in the measurement of dispersion were restricted to those with AT ≤10 ms. Statistical analyses
using paired and unpairedt-tests determined significance when
p<0.05.
RESULTS
THE DISTRIBUTION OF THE ACTION POTENTIAL DURATION
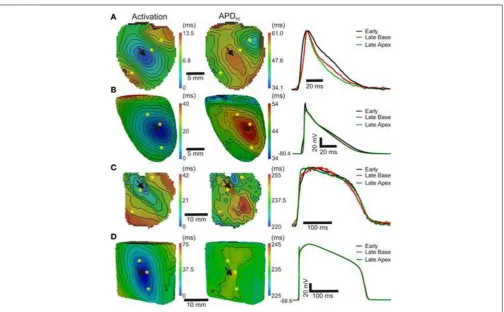
Optical images from the epicardial surface of the rat ventri-cles and the pig left ventricular myocardium were obtained to investigate the relationship between the activation sequence and the spatial distribution of APD80.Figure 1shows activation and
APD80maps for epicardial stimulation of the rat and pig tissues
at 160 and 496 ms basic cycle lengths, respectively.Figure 1A(left panel) shows the activation map across the rat left ventricle fol-lowing stimulation at the anterior insertion site (isochrones are shown every 1 ms). A total AT of 14.5 ms was found across the left ventricle. The corresponding spatial distribution of APD80
was heterogeneous (middle panel). The longest APD80of 58.4 ms
was observed at the pacing location and the shortest of 35.7 ms lay close to the site of the latest AT. The steepest mean spa-tial gradient of APD (1.6±1.1 ms/mm) was found to lie along the direction of slowest AP propagation. Optical APs along the 10 ms isochrone, one from the base and another from the apex, were compared with an AP from an early (4 ms) activation site and aligned by the maximal derivative of the upstroke (right panel). APs from early activated regions were associated with slowed rates of repolarization relative to APs from late activated regions. Figure 1Bshows activation and APD80 maps obtained
from the simulations using the rat heart model. As in experi-ments, regions of early activation were associated with the longest APD80(57.7 ms) that became gradually shorter with AT. Spatial
gradients of APD80were greatest in the directions of slowest
prop-agation, consistent with experiments. APs extracted from voxels with early and late ATs were aligned by AT and superimposed to illustrate the difference in APD (right). As in experiments, rel-ative prolongation of APDs associated with early ATs could be observed.
Figure 1C (left panel) shows the activation map from a coronary-perfused pig left ventricle that was stimulated from the anterior apical region. Smooth anisotropic propagation was observed across the tissue preparation with a total epicardial AT of 44.4 ms (isochrones are shown every 5 ms). Although a hetero-geneous pattern of APD80was found in the pig ventricle (middle
panel), dispersion of APD80 did not seem to correlate with AT.
The longest APD80was observed at the mid-level of the left
ven-tricular wall (276.7 ms) whereas the shortest was found close to the pacing site (237.7 ms). This is further confirmed by examina-tion of individual optical APs obtained at various ATs as shown on the right panel. Interestingly, simulations showed some degree of APD80modulation by the activation sequence with the longest
APD80(238.3 ms) near the pacing site (Figure 1D). Yet, this effect
FIGURE 1 | AT and APD maps from rat and pig myocardium.Rat ventricles were paced from the anterior insertion sites (arrows) in experiments(A)and simulations(B). Pig left ventricular wedge preparations were paced from the apex in experiments(C)and simulations(D). Panels
(from left to right) are AT, corresponding APD maps and AP traces acquired from pixels indicated by∗
. Isochrones are 1 and 5 ms spacing for rat and pig experiments and 2 and 5 ms for the corresponding simulations. AP traces are aligned by activation times.
in part, account for differences in the dispersion of APD and total AT observed between experiments and simulations.
In order to further establish the role of activation sequence we investigated APD80distributions from secondary pacing locations
in all experiments and simulations.Figure 2shows activation and APD80maps from the same experiments as inFigure 1but when
pacing the mid-free wall of the left ventricle.Figure 2Aindicates that the region of longest APD80in the rat heart was shifted to the
new pacing location (compare withFigure 1A). APD80 became
progressively shorter away from this site, predominantly in the direction of slow conduction (optical APs shown in right panel). A shift in APD80to the site of earliest activation was consistently
observed in simulations (Figure 2B). Conversely, changing the pacing location in the pig myocardium did not significantly alter the distribution of APD80in experiments (Figure 2C). Although
a region of long APD80was evident at the pacing location in
sim-ulations (Figure 2D), the spatial gradient of APD80 across the
epicardial surface was very shallow relative to that observed in the rat.
RELATIONSHIP BETWEEN ACTION POTENTIAL DURATION AND THE
ACTIVATION SEQUENCE
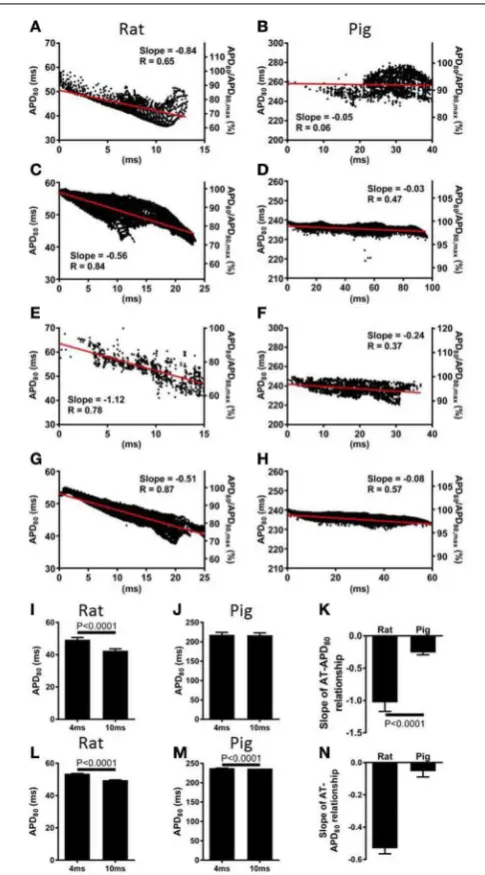
The relationship between AT and APD80 at each pixel of the
imaged surface was quantified by linear regression analysis.
Representative data for rat and pig experiments are shown in
Figures 3A,B, respectively. For all AT-APD plots, the relative APD80from the maximum APD80is shown by the secondaryy
-axes. These plots correspond to the activation and APD80 maps
shown in Figure 1 whereby tissue was paced from the mid-anterior insertion site in rat and apical region of LV in pig. A clear decreasing trend of APD80with AT was revealed in the rat
(slope= −0.84, R=0.65) compared with a relatively shallow relationship and poor correlation in the pig wedge preparation (slope = −0.05, R=0.06). Mean ± SD ofR values of linear regression were significantly less in pig than rat (0.25±0.22 vs. 0.66±0.18,p=0.0002). Relative to the maximum APD80
observed on the imaged surface, APD80 was decreased by as
much as 38.9% in rat but only 16.0% in pig. Linear regres-sion analyses of AT and APD80 relationships in rat (Figure 3C)
and pig (Figure 3D) simulations were qualitatively similar to experiments. We further show that upon changing the loca-tion of pacing of the tissue to the mid-LV free wall, the steep AT, and APD relationship of rat simulations (Figure 3E) and shallow relationship of pig simulations (Figure 3F) were con-served. This data is further supported by statistical comparison of APD80 from early (4 ms) and late (10 ms) ATs. Across all rat
FIGURE 2 | APD distributions for alternative activation sequences in rat and pig myocardium.Rat experiments(A)and simulations(B); and pig experiments(C)and simulations(D)with pacing from the mid free left
ventricular wall (arrows). Panels (from left to right) are AT, corresponding APD maps and AP traces acquired from pixels indicated by∗. Isochrones are as in
Figure 1. AP traces are aligned by activation times.
zones (p<0.0001), while no significant difference was observed in the pig wedge (Figure 3J). Correlations between AT and APD80
for rat and pig experiments were further assessed by compar-ison between slopes of the linear relationship between APD80
and AT. Figure 3K shows that AT-APD80 relationships across
all experiments were significantly steeper in rats compared to pigs (p<0.0001). In simulations, AT and APD80 values were
extracted from the epicardial surface of the LV free wall in accordance with the imaging plane of experiments. We found a significant decrease in APD with AT in both the rat and pig model. However, over a 6 ms interval in AT when pacing the mid-LV fee wall, APD decreased by 7.57% in rat and by only 0.4% in pig (Figures 3L,M). The slope of AT and APD80
relation-ship in pig was only 11.6% of that observed in rat (Figure 3N). For comparison, we report that when pacing the mid-anterior insertion site in rat and apical region of the LV in pig, sim-ilar differences of Mean ± SD APD80 between 4 and 10 ms
isochrones were identified as for the aforementioned pacing loca-tion (7.1 and 0.3%). Accordingly, a difference in the slope of AT and APD80 relationships between rat and pig was observed
(29.6%).
THE DISPERSION OF REPOLARIZATION TIME
Since local RT depends on local APD, it is to be expected that modulation of APD by the activation sequence affects RT
dispersion. Figure 4A shows that, in rat, progressive shorten-ing of the APD throughout the activation sequence plays an important role in homogenizing the spatial dispersion of RT. However, for the pig, a lack of association between APD and AT resulted in RT to follow the sequence of activation and intrinsic heterogeneities of APD (Figure 4B). As total AT of the rat LV is typically <15 ms, the dispersion of RT was calcu-lated from pixels corresponding to the earliest 10 ms of AT. The dispersion of RT (RT95%–RT5%) was 7 and 14 ms for the rat
and pig shown in Figures 4A,B, respectively. Simulations were in accordance with experiments as seen by relatively homoge-neous epicardial RT maps in rat whereas the reverse was seen for pig (Figures 4C,D). Similarly using the secondary pacing location, RT was relatively homogeneous in rat compared to pig. The dispersion of RT was seemingly consistent in rat at 8 (Figure 4E) and 16 ms in pig (Figure 4F). Simulations of the sec-ondary pacing locations were again consistent with experiments (Figures 4G,H).
Comparisons of Mean ± SD (pooled from each pac-ing location) APD80 dispersion and RT dispersion for rat
and pig experiments are shown in Figures 4I,J. The dis-persion of RT is less than APD80 by 25.3% (p<0.0001)
FIGURE 3 | Correlations between AT and APD in rat and pig myocardium. AT and APD plots corresponding to maps shown in
Figure 1 for rat (A) and pig (B) experiments. Slopes for linear correlation analyses are indicated. AT and APD plots of corresponding simulations are shown for rat (C) and pig (D). Similarly, AT and APD plots from an alternative pacing location, as in Figure 2, are shown for rat (E) and pig (F) experiments and rat (G) and pig (H) simulations. Panels (A–H) are also expressed as a percentage of the maximum APD80. Mean ± SD APD
[image:7.595.46.289.60.498.2]corresponding to 4 and 10 ms activation isochrones across all experiments and pooled from each pacing location in rat (I) and pig (J). (K) Equally, slopes of linear correlations between AT and APD were quantified for all experiments and pacing locations and expressed as Mean ± SD. Similarly to experiments, early vs. late activation times were compared for rat (L) and pig (M) simulations shown in Figure 2. (N) Slopes from linear correlations of corresponding AT and APD data are compared. All mean differences were compared using t-tests. Significant differences are indicated if P<0.05.
FIGURE 4 | Left ventricular dispersion of RT in rat and pig
myocardium.RT maps corresponding to maps shown inFigure 1for rat
(A)and pig(B)experiments and rat(C)and pig(D)simulations. Similarly, RT maps for an alternative pacing location, as inFigure 2, are shown for rat(E)and pig(F)and repeated for rat(G)and pig(H)simulations. Stimulation sites are indicated by arrows. Mean±SDdispersion of APD and RT pooled from each pacing location are compared across all experiments in rat(I)and pig(J). All mean differences from experiments were compared using pairedt-tests. Significant differences are indicated ifP<0.05. Similarly to experiments, dispersion of APD and RT were compared for rat(K)and pig(L)simulations shown inFigure 2.
to RT dispersion supported experimental findings showing reduced RT dispersion in rat (41.3%, Figure 4K) but a rel-ative and robust gain of RT dispersion in pig (83.7%,
MODULATION OF ACTION POTENTIAL DURATION AND
REPOLARIZATION TIME BY TISSUE ARCHITECTURE
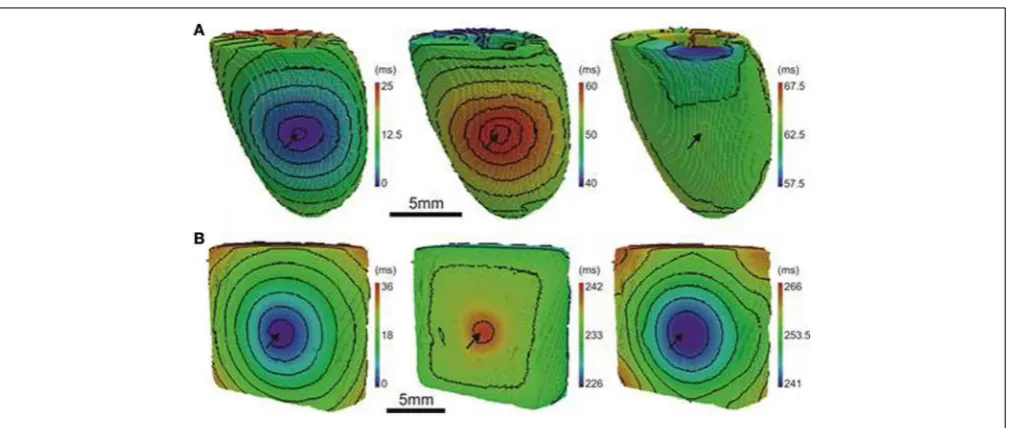
In our rat heart experiments we found that the insertion sites of the two ventricles were the only regions where the AT-APD80
rela-tionship could significantly be altered.Figure 5A shows a wave front propagating from a left ventricular mid-free wall pacing site to the right ventricle (left panels). In these experiments anterior and posterior activity was acquired simultaneously. The corre-sponding APD80 and RT distributions are shown in the middle
and right panels, respectively. The longest and shortest APD80
were still located at the pacing site and the region of latest activa-tion, respectively.Figure 5Bshows APD80profiles obtained from
the maps in Figure 5A (dashed line). The profile was chosen through the pacing location and the site of shortest APD80. On
the anterior side, a region coinciding with the boundary between the left and right ventricle showed a local maximum in APD80
(31.9 ms). This had a significant effect on the local RT with a local increase of as much as 4.1 ms (Figure 5C). Computer sim-ulations in the 3D model of the rat ventricle allow investigation of this phenomenon in more detail.Figure 5Dshows transmu-ral activation and APD80maps in the model. The AP propagated
anisotropically from the left ventricle into the septum and right free wall (left panel). The APD80map reveals a region of enhanced
APD80, and consequently RT, localized to the septal-ventricular
branching site (black box). Furthermore, the site of wave front
collisions in the RV and septum were associated with significantly decreased APD80, RT and enhanced mean gradients of APD80
shortening compared to those observed in the LV free wall (1.4 vs. 0.2 ms/mm).Figures 5E,Ffurther illustrates these findings by plotting APD80and RT, respectively, along the transmural profiles
indicated inFigure 5C(dashed line).
RATE-DEPENDENCY OF ELECTROTONIC MODULATION OF
REPOLARIZATION
In our experiments a strong relationship between APD80 and
AT was preserved at different pacing frequencies in rat but not in pig. APs from short and long pacing cycle lengths are shown for rat (Figure 6A) and pig (Figure 6B) experiments.Figure 6C
shows APD80restitution curves from locations corresponding to
relatively early (4 ms) and relatively late AT (10 ms) isochrones. Throughout the range of pacing cycle lengths applied in rat, rang-ing from 83 to 167 ms, the largest mean difference in APD80
between early and late AT data were found at longer pacing cycle lengths. At shorter pacing cycle lengths restitution curves tended toward convergence as indicated by a reduction in sta-tistical power (although still significant). Convergence of APD80
restitution data at short cycle lengths was attributed to variation in the maximum slope of the restitution profile between early and late regions of AT. The maximal slope of APD80 data
[image:8.595.45.551.375.622.2]resti-tution was larger at regions of early AT compared with late AT
FIGURE 5 | Local modulation of APD in rat hearts by tissue architecture. (A)Hearts were simultaneously imaged from anterior (upper panels) and posterior (lower panels) views. Panels (from left to right) are AT and APD maps from ventricles paced at the mid left ventricular free wall (arrows). Insertion sites of left and right ventricular free walls are indicated by dotted lines in AT maps. Isochrones are spaced 2 ms. Linear profiles of APD(B) and RT (C) measured from anterior (upper panel) and posterior (lower panel) surfaces. APD values
(0.21 vs. 0.08). In pig experiments, APD80restitution was largely
unaffected by AT between pacing cycle lengths ranging from 256 to 1000 ms (Figure 6D). Significant differences of APD80
were observed between early and late AT at 288 and 336 ms only. Despite modest differences in mean APD80at specific cycle
lengths, the maximal slope of restitution was equal (0.63) between early and late AT.
To determine the rate-dependency of electrotonic modulation of repolarization, the slope of linear correlations of the AT-APD80
relationship were quantified across all pacing cycle lengths in rat and pig experiments.Figure 6Eshows the lack of dependence of the AT-APD80slope on pacing cycle length. The mean of the slope
was preserved between a range of −0.57 and −0.82. One-way analysis of variance determined no statistical variation within the sampled pacing cycle lengths (P>0.05). Similarly for pig, slopes of AT-APD80relationships were unaffected by pacing cycle length
(Figure 6F). However, slopes were consistently less steep than for rat, ranging from−0.25 to−0.4 with no statistically significant variation for different pacing cycle lengths (P>0.05).
FIGURE 6 | Restitution properties of APD80and its dependence on
AT. (A)Representative optical AP traces extracted from the same pixel location during pacing with cycle lengths, CL, of 167 and 83ms in rat.
(B)Similarly, optical AP traces from pig paced at 1000 and 256 ms cycle lengths are superimposed. Mean±SDAPD80from 4 and 10 ms
isochrones were plotted against pacing cycle length for rat(C)and pig
(D)(N=7andN=5, respectively). Statistical differences between APD across all pacing frequencies were determined by pairedt-tests (∗P<0.05;∗∗P<0.01). For comparison of the steepness of restitution,
data were fitted with one-phase decay exponential curves. Mean±SD of slopes of linear relationships between AT and APD80were plotted
against pacing cycle length for rat(E)and pig(F). One-way ANOVA was used to determine statistical data variance across pacing cycle lengths tested (P<0.05). No statistical deviations between means of slopes were observed for rat or pig.
DETERMINANTS OF ELECTROTONIC LOAD
The computational models allow investigation of the relative roles of AP shape (or kinetics), tissue size and tissue geome-try on the electrotonic modulation of repolarization. This was first assessed by interchanging rat and pig AP kinetics (Rk and
Pk, respectively) from simulations in rat and pig tissue
geome-tries (Rgand Pg, respectively). InFigure 7RkPgand PkRg
[image:9.595.47.289.297.556.2]sim-ulations were paced at the mid LV free wall, consistent with
Figure 2. Figures 7A,Bshow AT and APD80 maps for the RkPg
and PkRgsimulations, respectively. The regions of longest APD80
was observed close to sites of stimulation in each simulation. In Figure 7C APD80 is plotted against AT for the RkPg (left
panel) and PkRg (right panel) simulations. Maximal spatial in
plane dispersion of APD80 was as much as 48.9% of the
max-imal epicardial APD80 in RkPg simulations, but only 4.1% in
PkRg. The slope of the AT-APD80relationship became less
neg-ative by 54.9 and 58.6% when comparing RkRgto PkRgand RkPg,
respectively. Conversely, the steepness of this relationship became more pronounced by 66.3and 52.5% when comparing PkPgwith
PkRg and RkPg. The computational models were further used
[image:9.595.300.550.341.606.2]to assess the effects of tissue size alone on electrotonic mod-ulation of repolarization by either increasing or decreasing the tissue dimensions by a factor of two in the rat geometry (Rgx2)
FIGURE 7 | The influence of electrophysiological kinetics and tissue geometry on the dispersion of APD.Electrophysiological kinetics for rat (Rk) and pig (Pk) simulations was interchanged between geometries (Rg
and Pg, respectively). Ventricles were paced at the mid LV free wall
(arrows). Panels are maps of AT (left panels) and APD80(right panels)
derived from simulations in the following configurations: RkPg (A)PkRg
(B). Isochrones are 4ms for all maps.(C)AT-APD plots for RkPg(left
panel) and PkRg (right panel) simulations. Slopes of linear correlation
analyses are indicated. Secondaryy-axes show APD80expressed as a
(Figure 8A) and pig wedge (Pgx0.5) (Figure 8B). In Figure 8C
APD80 is plotted against AT for RkRgx2 and PkPgx0.5
simula-tions, respectively. We find that by comparison toFigure 3, the slope of the AT-APD80 relationship becomes less negative by
enlargement of rat heart simulations (−0.19 vs. −0.56). The converse was observed in the pig wedge of reduced dimen-sions, where an increased association between AT and APD80
is observed relative to simulations of true dimensions (−0.1 vs.
−0.03 AT-APD80 slope). To ascertain the effects of AP
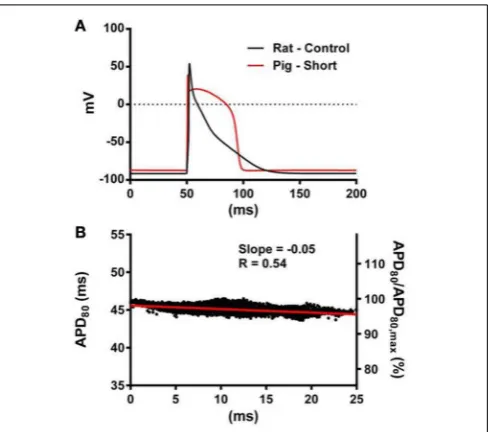
mor-phology alone on electrotonic modulation of repolarization, we compared a modified pig kinetics model with an equivalent APD80 to the rat model.Figure 9Ashows that the modified pig
model retained a spike and dome-like AP with a considerably shortened plateau phase when compared to the unmodified pig AP (Figures 1, 2) and an increased rate of repolarization dur-ing phase 3, relative to the rat AP. Despite APD80 being similar,
epicardial APD80in the Pk,shortRgsimulation showed little
depen-dence on AT (Figure 9B). The slope of AT-APD relationship was less by as much as 92.0% compared to RkRgsimulation (shown
inFigure 3G).
[image:10.595.47.294.348.612.2] [image:10.595.306.551.387.603.2]For comparison to anisotropic simulations, isotropic (no fibers) simulations in rat heart and pig wedge geometries were performed. Here the uniform spread of excitation in rat was
FIGURE 8 | The influence of tissue geometry on the dispersion of APD.
Ventricles were paced at the mid-anterior insertion site of rat and apex of pig geometries (arrows). Panels are maps of AT (left panels) and APD (right panels).(A)Dimensions of rat geometries were increased by a factor of two (RkRgX2).(B)Pig kinetics were simulated in a pig geometry with
dimensions scaled by half (PkPgX0.5). Isochrones are 4 ms for all maps.(C)
AT-APD plots for RkRgX2(left panel) and PkPgX0.5(right panel) simulations.
Slopes of linear correlation analyses are indicated. Secondaryy-axes show APD80expressed as a percentage of maximum APD80.
associated with near uniform gradients of APD80away from the
site of stimulus (Figure 10A). APD80 was found to change near
1:1 with AT shown by a change of 6 ms of AT, from 4 to 10 ms isochrones, modulated APD80 from a Mean ± SD of 57.5±
0.5 ms to 52.5±1.3 ms. Therefore, a near simultaneous repolar-ization time was observed in the left ventricle of the isotropic rat simulation. Simulations in isotropic wedges also revealed a strengthening, although modest, of the relationship between AT and APD using the pig model compared to anisotropic wedges (Figure 10B). Despite this, early vs. late AT modulated APD80
from a Mean ± SDof 238.9±0.3 ms to only 237.1±0.3 ms. Consequently, significant dispersion of RT was still observed, and followed the activation sequence.Figure 11summarizes the slopes from linear correlations of APD80 plotted against AT for
the simulations inFigures 2,7–10.
TRANSMURAL DISPERSION OF ACTION POTENTIAL DURATION
Finally, the influence of tissue geometry in the transmural plane on electrotonic modulation of repolarization was inves-tigated. AT and APD80 values were extracted from transmural
slices corresponding to the level of the pacing site for both rat (RkRg) and pig (PkPg) models. AT-APD80 relationships for rat
and pig revealed clear descending linear distributions of APD80
with AT (Figures 12A,B, respectively). For the RkRg
simula-tion, the shortest APD80 was observed at the latest AT with
an APD80 that was 44.6% shorter than the maximal APD80
within the transmural plane. Percentage shortening of APD80
FIGURE 9 | The influence of AP morphology on coupling of AT and APD.In the rat geometry simulations of rat kinetics were compared to a modified pig kinetics model (Pk,shortRg) wherebyGKsandGKswere
increased by a factor of 28.5 to match the APD80of the rat model.(A)
Single cell AP traces comparing the rat and modified pig kinetics. Whole rat ventricle simulations were paced at the mid LV free wall.(B)AT-APD plot shown for Pk,shortRgsimulation. The comparative AT-APD plot for an RkRg
simulation is shown inFigure 3G. Slope of linear correlation analyses is indicated. Secondaryy-axes show APD80expressed as a percentage of
FIGURE 10 | AT, APD, and RT maps for isotropic simulations.In rat(A)
and pig(B)simulations, the activation sequences (left panels) show no preferential direction of propagation. Sites of stimulation are indicated by arrows. The distribution of APD (middle panels) is tightly coupled to the activation sequence in rat simulations but to a much lesser extent in the pig. A decreasing trend of APD away from the pacing site was observed
uniformly in all directions across the epicardial surface. A similar pattern of APD was observed in the pig simulations however the range of APD values were much smaller. The RT map was relatively homogeneous in the rat simulations compared to the pig (right panels). The RT pattern in pig closely followed the activation sequence. Isochrones are spaced 2 and 4 ms apart for rat and pig, respectively.
FIGURE 11 | The influence of anisotropy, AP morphology, and tissue geometry on the correlation between activation and APD in simulations.Comparison between slopes of linear correlations for each simulation inFigures 2,7–10.
in PkPg was substantially less at 5.6%. The steepness of these
relationships was −0.65 and −0.13 for rat and pig, which corresponds to increases of 27.5 and 62.5% in the transmu-ral plane compared to the epicardial relationships, respectively. Similarly, AT-APD80 relationships were associated with
aug-mentedRvalues in both rat (0.96 vs. 0.87) and pig (0.91 vs. 0.57) models.
DISCUSSION
GENERAL DISCUSSION
The focus of the present study was to characterize the dynamic interplay between APD and the activation sequence in the myocardium with an aim to identify the mechanisms underlying acute electrotonic modulation of repolarization. Such
FIGURE 12 | Correlations between AT and APD in the transmural plane of rat (A) and pig (B) myocardium.AT and APD80plots corresponding to
the horizontal transmural plane at the level of the pacing site in simulations fromFigure 2. Slopes for linear correlation analyses are indicated. Secondaryy-axes show APD80expressed as a percentage of maximum
APD80.
Our experimental results are in agreement with earlier com-putational studies that predicted an important role for the shape of the cardiac AP (Sampson and Henriquez, 2005; Cherry and Fenton, 2011). The electrotonic current is proportional to the membrane potential difference between neighboring cells and depends on the dynamic membrane resistance during repolariza-tion (Sampson and Henriquez, 2005). In pig, due to the plateau phase, regions of tissue activated early in the activation sequence remain in relatively depolarized states long after all tissue has been activated. This significantly reduces the overall spatial gra-dient of the transmembrane potential during repolarization and consequently dampens its electrotonic modulation. Furthermore, the late phase 3 repolarization is strongly dominated by outward potassium currents and relatively small membrane resistance and therefore less sensitive to external currents. Conversely, the rat AP shape provides relatively constant membrane potential gradients throughout the whole repolarization duration. The late repolar-ization phase in the rat heart is also occurring at relatively slow rates, indicating a delicate balance between outward and inward currents, and is thus more susceptible to be affected by electro-tonic currents (Vigmond et al., 2009). Our study is the first to investigate in detail and highlight the differences in electrotonic modulation of repolarization between two different mammalian species experimentally.
The rate dependency of the AT-APD relationship was investi-gated experimentally in both rat and pig ventricles. Reducing the pacing cycle length of tissue leads to AP shortening in both rat and pig myocardium. In our experiments, the shape of the AP, in terms of the rate of phase 3 repolarization, was largely pre-served across all pacing cycle lengths for each species, as can be observed inFigures 6A,B. We did not observe a significant devi-ation of the slope of AT-APD reldevi-ationship across pacing cycle lengths in either rat or pig experiments. Thus, it appears that irrespective of APD and pacing cycle length, the shape of the AP (triangular vs. spike-and-dome) is a main determinant of electro-tonic modulation of repolarization. This is further supported by simulations shown inFigure 9that showed that shortening the pig APD (by abbreviation of the plateau phase whilst retaining a spike and dome AP) to match the rat APD, did not improve the relationship between AT and APD80. These results show clearly
that AP morphology plays a crucial role in electrotonic modu-lation of repolarization whereby the triangulated AP of the rat has significantly greater coupling between AT and APD than a spike-and-dome AP, as in pig.Hanson et al. (2009)using, S1S2 stimulation from the endocardium in human ventricles, observed that AT and activation-recovery interval (analogous to APD) reduced the steepness of linear correlations at S1S2 coupling intervals close to the shortest effective coupling interval. This study utilized noncontact balloon electrodes and therefore could not report on the AP morphology. However, S1S2 stimulation protocol may impose differential effects on AP morphology com-pared with dynamic stimulation since it is well established that the maximal slope of APD restitution is significantly enhanced by the S1S2 pacing protocol (Osadchii, 2012).
The role of tissue geometry on electrotonic modulation of repolarization has previously been investigated in theoretical
models of cardiac propagation.Wang and Rudy (2000)used sim-ulations of single ventricular muscle fibers that expand to multi-ple fibers, thus enhancing the number of neighboring cells at the site of the expansion, and found localized changes to APD at the sites of branching due to enhanced electrotonic load from fiber branches. More recently,Cherry and Fenton (2011)predicted a similar effect occurring at the insertions site of the left and right ventricle, and the septum, in homogeneous but anisotropic two-dimensional simulations of an axial slice of dog heart. In the present study, we investigated experimentally the relative role of tissue geometry on the electrotonic modulation of repolarization. We showed, for the first time, that the effect previously proposed byCherry and Fenton (2011)was present at the level of the whole heart, both in experiments and simulations. Activation from the left ventricular free wall toward the right ventricle in the rat heart was associated with decreasing APD in a near linear trend with the exception of the border region between left and right ventri-cles (Figure 5). A band, extending from the base to the apex, of prolonged APDs was observed. This observation was replicated in 3D simulations using the rat geometry. Here, a localized region of prolonged APD80was observed throughout the ventricular wall at
the intersection of the septum and right ventricular free wall with the left ventricle. Furthermore, this effect significantly altered the intrinsic transmural APD gradient that was implemented in the cellular model (Pandit et al., 2001).
Computational models are a useful tool for investigating the relative role of AP kinetics and tissue properties in the electrotonic modulation of repolarization. In our study we ran additional sim-ulations whereby the AP kinetics of one species was incorporated into the geometry of the other, and vice versa (Figures 7, 11). When using the rat AP and changing the geometry from the rat whole ventricular model to the pig wedge preparation, we observed a pronounced reduction in the steepness of the AT-APD80relationship. However, when using pig AP kinetics in the
rat whole ventricular model we found a more pronounced cor-relation between AT and APD80 than when using the pig wedge
geometry. We also found that scaling up the rat geometry reduced the steepness of the AT-APD80relationship (Figure 8). Reducing
the size of the pig geometry increased the steepness of the linear AT-APD80 relationship. Furthermore, uniform activation
sequences in isotropic simulations were accompanied by tighter coupling of APD80 to AT as shown by more pronounced
nega-tive slopes of linear regression analysis compared to anisotropic simulations for both, rat and pig (Figure 11). The magnitude of the slope for isotropic simulations was still substantially greater in rat than in pig. In addition, the AT-APD80 relationship of
the transmural plane was found to be steeper than on the epi-cardium (Figure 12). These results are consistent with previous two-dimensional simulation studies that showed that electrotonic APD modulation is strongest at pacing sites, tissue boundaries, and wave collisions sites. Increasing tissue size effectively reduces the contributions of the pacing site and tissue boundaries to the overall AT-APD80 relationship, thus leading to less pronounced
Dispersion of RT is an important determinant of the vul-nerability to arrhythmias following a premature activation. In our experiments we found that, due to electrotonic interac-tions, RT was relatively homogeneous in the paced intact rat heart, but more heterogeneous in the pig ventricle (Figure 4). These results suggest that the rat heart would be more resistant against arrhythmias following ectopic activation, than pig ven-tricles. Electrotonic modulation of repolarization could therefore be a contributing factor in the reduced occurrence of sudden cardiac deaths in murine animal models compared to larger species (Sabir et al., 2008). However, our study has also high-lighted structural features that could provide pro-arrhythmic substrates even in the smaller hearts: regions of tissue expan-sion at the insertion site between left and right ventricles were associated with APD prolongation and increased RT dispersion (Zubair et al., 1994). Therefore, regions of expanding conductive tissues such as ventricular insertion sites, insertion of papillary muscles and trabeculae carneae, could have increased vulnerabil-ity to conduction block following premature stimuli. This study provides the first experimental evidence supporting a mecha-nism previously only demonstrated computationally (Cherry and Fenton, 2011) for arrhythmogenesis underlayed by a structural substrate.
FUTURE DIRECTIONS
The present study has shown the influence of electrotonic effects for differing tissue structures and AP morphologies of the rat and pig ventricles. Future studies will be aimed at investigating in more detail the relative influence of intercellular coupling and membrane resistance in different species. Equally, it would be important to investigate this phenomenon in cardiac diseases.
LIMITATIONS
All optical mapping recordings in the current study were obtained from the epicardium. Transmural electrophysiological hetero-geneities are well documented at a cellular level in various species, but to what extent these are modulated by electrotonic currents in tissues remains a topic of debate (Antzelevitch et al., 1998). Fully depth-resolved transmural imaging of APs is currently not fea-sible, thus making it difficult to directly address this important question. Nevertheless, our computer simulations indicate that electrotonic modulation by the activation sequence is stronger in the transmural direction than epicardially, especially in thin ventricles (see Figures 5, 12), which can be sufficient to over-come intrinsic transmural heterogeneities. These findings are in accordance with previous computational studies (Sampson and Henriquez, 2005; Walton et al., 2010) and corroborate experi-mental findings on the rabbit left ventricular wedge cut surface (Myles et al., 2010) and in the intact rat heart (Walton et al., 2010). Furthermore, non-uniformities in tissue geometry can greatly affect transmural patterns of repolarization (Figure 5). Electrotonic modulation by the activation sequence of transmural repolarization dispersion is therefore likely to be important, even in the large intact mammalian heart.
We used an electro-mechanical uncoupler in the experi-ments to prevent motion artifacts and reliably measure repo-larization optically. Furthermore, all computational simulations
ignored cardiac contraction and electro-mechanical coupling. It is well-known that stretch can affect repolarization (Kohl et al., 2011). Activation of the ventricles from an electrode or ectopic source will create heterogeneous stretch patterns during repolar-ization that are likely to impact on dispersion of repolarrepolar-ization. To what extent stretch will impact on the findings of the cur-rent study remains to be investigated, however a tight coupling between activation and repolarization has been reported in sev-eralin vivostudies (Hanson et al., 2009; Yue et al., 2005).
There are differences in absolute AT between simulations and experimental data in our study.
Although realistic geometries are used, several factors may account for differences in total AT between simulations and experiments: (1) we have used a single geometry for the rat heart and pig wedge obtained from separate DT-MRI experiments. Therefore, variations in tissue size and electrophysiological properties across the various optical mapping experiments are not accounted for in simulations; (2) the simulations are run on the complete tissue sample (whole heart or wedge) whereas optical mapping data is obtained from a lim-ited field-of-view; (3) transmural electrophysiological hetero-geneities were included based on available experimental data. However, no other heterogeneities were incorporated in our models (such as base-to-apex gradients or differential con-nexin expression) due to the lack of established data; (4) retrograde activation through the Purkinje network may con-tribute to faster activation in experiment vs. simulation. However, our simulations are in excellent qualitative agreement with experimental data in terms of electrotonic modulation of repolarization.
In our simulations we used a monodomain approach without taking the tissue bath into account. However, this bath is known to increase electrotonic load at the tissue boundaries or at tis-sue heterogeneities such as vessels [see for example (Bishop et al., 2011; Kelly et al., 2013)]. Bath-loading at the tissue boundary is therefore likely to enhance the boundary effects we observe in our monodomain simulations and could play a role in further modu-lating the transmural APD gradient. The main conclusions of our study remain however valid.
CONCLUSION
In conclusion, our study has highlighted that electrophysiolog-ical and structural differences between species and the type of tissue preparations have significant roles in electrotonic modu-lation of repolarization. AP shape, tissue size and tissue geometry should all be taken into account when investigating dispersion of repolarization in cardiac tissue.
ACKNOWLEDGMENTS
REFERENCES
Antzelevitch, C. (2005). Modulation of transmural repolarization. Ann. N.Y. Acad. Sci.1047, 314–323. doi: 10.1196/annals.1341.028
Antzelevitch, C., Shimizu, W., Yan, G. X., and Sicouri, S. (1998). Cellular basis for QT disper-sion. J. Electrocardiol. 30(Suppl.), 168–175. doi: 10.1016/S0022-0736(98)80070-8
Banville, I., and Gray, R. A. (2002). Effect of action potential duration and conduction velocity restitution and their spatial dispersion on alter-nans and the stability of arrhyth-mias. J. Cardiovasc. Electrophysiol.
13, 1141–1149. doi: 10.1046/j.1540-8167.2002.01141.x
Benoist, D., Stones, R., Drinkhill, M., Bernus, O., and White, E. (2011). Arrhythmogenic substrate in hearts of rats with monocrotaline-induced pulmonary hypertension and right ventricular hypertro-phy. Am. J. Physiol. Heart Circ. Physiol. 300, H2230–H2237. doi: 10.1152/ajpheart.01226.2010 Benson, A. P., Al-Owais, M., and
Holden, A. V. (2011a). Quantitative prediction of the arrhythmogenic effects of de novo hERG mutations in computational models of human ventricular tissues.Eur. Biophys. J.
40, 627–639. doi: 10.1007/s00249-010-0663-2
Benson, A. P., Bernus, O., Dierckx, H., Gilbert, S. H., Greenwood, J. P., Holden, A. V., et al. (2011b). Construction and validation of anisotropic and orthotropic ven-tricular geometries for quantitative predictive cardiac electrophysiol-ogy.Interface Focus1, 101–116. doi: 10.1098/rsfs.2010.0005
Benson, A. P., Aslanidi, O. V., Zhang, H., and Holden, A. V. (2008). The canine virtual ventricular wall: a platform for dissecting pharmacological effects on prop-agation and arrhythmogenesis.
Prog. Biophys. Mol. Biol. 96, 187–208. doi: 10.1016/j. pbiomolbio.2007.08.002
Bishop, M. J., Vigmond, E., and Plank, G. (2011). Cardiac bidomain bath-loading effects during arrhyth-mias: interaction with anatomical heterogeneity. Biophys. J. 101, 2871–2881. doi: 10.1016/j.bpj.2011. 10.052
Chauhan, V. S., Downar, E., Nanthakumar, K., Parker, J. D., Ross, H. J., Chan, W., et al. (2006). Increased ventricular repolarization heterogeneity in patients with ven-tricular arrhythmia vulnerability and cardiomyopathy: a human in
vivo study. Am. J. Physiol. Heart Circ. Physiol. 290, H79–H86. doi: 10.1152/ajpheart.00648.2005 Cherry, E. M., and Fenton, F. H. (2011).
Effects of boundaries and geometry on the spatial distribution of action potential duration in cardiac tissue.
J. Theor. Biol.285, 164–176. doi: 10.1016/j.jtbi.2011.06.039 Faber, G. M., and Rudy, Y. (2000).
Action potential and contrac-tility changes in [Na(+)](i) overloaded cardiac myocytes: a simulation study. Biophys. J. 78, 2392–2404. doi: 10.1016/S0006-3495(00)76783-X
Franz, M. R., Bargheer, K., Rafflenbeul, W., Haverich, A., and Lichtlen, P. R. (1987). Monophasic action poten-tial mapping in human subjects with normal electrocardiograms: direct evidence for the genesis of the T wave. Circulation 75, 379–386. doi: 10.1161/01.CIR. 75.2.379
Hanson, B., Sutton, P., Elameri, N., Gray, M., Critchley, H., Gill, J. S., et al. (2009). Interaction of activation-repolarization cou-pling and restitution properties in humans. Circ. Arrhythm. Electrophysiol. 2, 162–170. doi: 10.1161/CIRCEP.108.785352 Kelly, A., Ghouri, I. A., Kemi, O. J.,
Bishop, M. J., Bernus, O., Fenton, F. H., et al. (2013). Subepicardial action potential characteristics are a function of depth and activation sequence in isolated rabbit hearts. Circ. Arrhythm. Electrophysiol. 6, 809–817. doi: 10.1161/CIRCEP.113.000334 Kohl, P., Sachs, F., and Franz, M.
R. (2011).Cardiac Mechano-Electric Coupling and Arrhythmias. 2nd Edn. New York, NY: Oxford University Press.
Kongstad, O., Yuan, S., Hertervig, E., Holm, M., Grins, E., and Olsson, B. (2002). Global and local disper-sion of ventricular repolarization: endocardial monophasic action potential mapping in swine and humans by using an electro-anatomical mapping system.
J. Electrocardiol.35, 159–167. doi: 10.1054/jelc.2002.31825
Lacroix, D., Extramiana, F., Delfaut, P., Adamantidis, M., Grandmougin, D., Klug, D., et al. (1999). Factors affecting epicardial dispersion of repolarization: a mapping study in the isolated porcine heart.
Cardiovasc. Res. 41, 563–574. doi: 10.1016/S0008-6363(98)00269-7 Laurita, K. R., Girouard, S. D.,
and Rosenbaum, D. S. (1996). Modulation of ventricular
repolarization by a premature stimulus. Role of epicardial dis-persion of repolarization kinetics demonstrated by optical map-ping of the intact guinea pig heart. Circ. Res.79, 493–503. doi: 10.1161/01.RES.79.3.493
Laurita, K. R., Girouard, S. D., Rudy, Y., and Rosenbaum, D. S. (1997). Role of passive electrical properties during action potential restitution in intact heart.Am. J. Physiol.273(3 Pt 2), H1205–H1214.
Liang, Y., Kongstad, O., Luo, J., Liao, Q., Holm, M., Olsson, B., et al. (2005). QT dispersion failed to estimate the global dispersion of ventricular repolarization measured using monophasic action potential mapping technique in swine and patients.J. Electrocardiol.38, 19–27. doi: 10.1016/j.jelectrocard.2004. 09.012
Macchi, E., Baruffi, S., Rossi, S., Miragoli, M., Bertuzzi, A., Musso, E., et al. (2004). Does cardiac pacing reproduce the mechanism of focal impulse initiation?J. Electrocardiol.
37(Suppl.), 135–143. doi: 10.1016/j.jelectrocard.2004.08.038 Myles, R. C., Bernus, O., Burton,
F. L., Cobbe, S. M., and Smith, G. L. (2010). Effect of activation sequence on transmural patterns of repolarization and action poten-tial duration in rabbit ventricular myocardium.Am. J. Physiol. Heart Circ. Physiol. 299, H1812–H1822. doi: 10.1152/ajpheart.00518.2010 Nerbonne, J. M., and Kass, R. S.
(2005). Molecular physiology of car-diac repolarization. Physiol. Rev.
85, 1205–1253. doi: 10.1152/phys-rev.00002.2005
Noujaim, S. F., Pandit, S. V., Berenfeld, O., Vikstrom, K., Cerrone, M., Mironov, S., et al. (2007). Up-regulation of the inward recti-fier K+ current (I K1) in the mouse heart accelerates and stabi-lizes rotors. J. Physiol. 578(Pt 1), 315–326.
Osadchii, O. E. (2012). Effects of ventricular pacing protocol on electrical restitution assess-ments in guinea-pig heart.
Exp. Physiol. 97, 807–821. doi: 10.1113/expphysiol.2012.065219 Pandit, S. V., Clark, R. B., Giles, W. R.,
and Demir, S. S. (2001). A math-ematical model of action poten-tial heterogeneity in adult rat left ventricular myocytes. Biophys. J.
81, 3029–3051. doi: 10.1016/S0006-3495(01)75943-7
Papadakis, N. G., Xing, D., Houston, G. C., Smith, J. M., Smith, M. I., James, M. F., et al. (1999).
A study of rotationally invariant and symmetric indices of diffusion anisotropy. Magn. Reson. Imaging
17, 881–892. doi: 10.1016/S0730-725X(99)00029-6
Press, W. H., Teukolsky, S. A., Vetterling, W. T., and Flannery, B. P. (2007).Numerical Recipes: the Art of Scientific Computing, 3rd Edn. Cambridge: Press Syndicate of the University of Cambridge. Qu, Z., and Garfinkel, A. (1999).
An advanced algorithm for solv-ing partial differential equation in cardiac conduction. IEEE Trans. Biomed. Eng. 46, 1166–1168. doi: 10.1109/10.784149
Rossi, S., Baruffi, S., Bertuzzi, A., Miragoli, M., Corradi, D., Maestri, R., et al. (2008). Ventricular activation is impaired in aged rat hearts. Am. J. Physiol. Heart Circ. Physiol. 295, H2336–H2347. doi: 10.1152/ ajpheart.00517.2008
Sabir, I. N., Usher-Smith, J. A., Huang, C. L., and Grace, A. A. (2008). Risk stratification for sudden cardiac death.Prog. Biophys. Mol. Biol.98, 340–6. doi: 10.1016/j.pbiomolbio. 2009.01.013
Sampson, K. J., and Henriquez, C. S. (2005). Electrotonic influences on action potential duration dispersion in small hearts: a simulation study.
Am. J. Physiol. Heart Circ. Physiol.
289, H350–H360. doi: 10.1152/ajp-heart.00507.2004
Vigmond, E. J., Tsoi, V., Yin, Y., Page, P., and Vinet, A. (2009). Estimating atrial action poten-tial duration from electrograms.
IEEE Trans. Biomed. Eng. 56, 1546–1555. doi: 10.1109/TBME. 2009.2014740
Walton, R. D., Benoist, D., Hyatt, C. J., Gilbert, S. H., White, E., and Bernus, O. (2010). Dual excitation wavelength epifluo-rescence imaging of transmural electrophysiological properties in intact hearts. Heart Rhythm 7, 1843–1849. doi: 10.1016/j.hrthm. 2010.08.019
Wan, X., Bryant, S. M., and Hart, G. (2000). The effects of [K+]o on regional differences in electrical characteristics of ventricu-lar myocytes in guinea-pig.
Exp. Physiol. 85, 769–774. doi: 10.1111/j.1469-445X.2000.02048.x Wang, Y., and Rudy, Y. (2000).
Wasserstrom, J. A., Sharma, R., Kapur, S., Kelly, J. E., Kadish, A. H., Balke, C. W., et al. (2009). Multiple defects in intracellular calcium cycling in whole failing rat heart. Circ. Heart Fail. 2,
223–232. doi: 10.1161/
CIRCHEARTFAILURE.108.811539 Yuan, S., Kongstad, O., Hertervig, E.,
Holm, M., Grins, E., and Olsson, B. (2001). Global repolariza-tion sequence of the ventricular endocardium: monophasic action potential mapping in swine and humans. Pacing Clin. Electrophysiol. 24, 1479–1488. doi: 10.1046/j.1460-9592.2001.01479.x
Yue, A. M., Betts, T. R., Roberts, P. R., and Morgan, J. M. (2005). Global dynamic coupling of acti-vation and repolarization in the human ventricle. Circulation 112, 2592–2601. doi: 10.1161/ CIRCULATIONAHA.104.510412 Zubair, I., Pollard, A. E., Spitzer, K. W.,
and Burgess, M. J. (1994). Effects of activation sequence on the spa-tial distribution of repolarization properties. J. Electrocardiol. 27, 115–127. doi: 10.1016/S0022-0736(05)80094-9
Conflict of Interest Statement: The authors declare that the research
was conducted in the absence of any commercial or financial relationships that could be con-strued as a potential conflict of interest.
Received: 21 June 2013; accepted: 18 September 2013; published online: 08 October 2013.
Citation: Walton RD, Benson AP, Hardy MEL, White E and Bernus O (2013) Electrophysiological and structural determinants of electrotonic modulation of repolarization by the activation sequence. Front. Physiol. 4:281. doi: 10.3389/fphys.2013.00281
This article was submitted to Cardiac Electrophysiology, a section of the journal Frontiers in Physiology.