https://doi.org/10.5194/bg-16-3929-2019 © Author(s) 2019. This work is distributed under the Creative Commons Attribution 4.0 License.
Spatial changes in soil stable isotopic composition in response to
carrion decomposition
Sarah W. Keenan1,a, Sean M. Schaeffer1, and Jennifer M. DeBruyn1
1University of Tennessee, Department of Biosystems Engineering and Soil Science, 2506 E.J. Chapman Drive, Knoxville, TN 37996, USA
acurrent address: South Dakota School of Mines and Technology, Department of Geology and Geological Engineering, 501 E. St. Joseph Street, Rapid City, SD 57701, USA
Correspondence:Sarah W. Keenan ([email protected]) and Jennifer M. DeBruyn ([email protected])
Received: 4 December 2018 – Discussion started: 2 January 2019
Revised: 6 September 2019 – Accepted: 14 September 2019 – Published: 11 October 2019
Abstract.Decomposition provides a critical mechanism for
returning nutrients to the surrounding environment. In ter-restrial systems, animal carcass, or carrion, decomposition results in a cascade of biogeochemical changes. Soil micro-bial communities are stimulated, resulting in transformations of carbon (C) and nitrogen (N) sourced from the decaying carrion soft tissues, changes to soil pH, electrical conduc-tivity, and oxygen availability as microbial communities re-lease CO2 and mineralize organic N. While many of the rapid changes to soil biogeochemistry observed during car-rion decomposition return to background or starting condi-tions shortly after soft tissues are degraded, some biogeo-chemical parameters, particularly bulk soil stable δ15N iso-topic composition, have the potential to exhibit prolonged perturbations, extending for several years. The goal of this study was to evaluate the lateral and vertical changes to soil stable isotopic composition 1 year after carrion decomposi-tion in a forest ecosystem. Lateral transects extending 140 cm from three decomposition “hotspots” were sampled at 20 cm intervals, and subsurface cores were collected beneath each hotspot to a depth of 50 cm. Bulk soil stable isotopic com-position (δ15N and δ13C) indicated that 1 year after com-plete soft tissue removal and decay, soils were significantly 15N enriched by 7.5±1.0 ‰ compared to control soils up to 60 cm from the hotspot center, and enrichment extended to a depth of 10 cm. Hotspot soils also contained 10 % more N compared to control soils, indicating that decomposition perturbs N pools. Our results demonstrate that carrion de-composition has the potential to result in long-term changes to soil biogeochemistry, up to at least 1 year after soft
tis-sue degradation, and to contribute to bulk soil stable isotopic composition.
1 Introduction
Nutrient hotspots form from the introduction of carbon (C) and nitrogen (N)-rich compounds into an ecosystem, result-ing in elevated reaction rates compared to surroundresult-ing re-gions (McClain et al., 2003). For terrestrial and aquatic sys-tems, hotspots may be sourced from fallen trees (Lodge et al., 2016), annual deposition of deciduous leaves (Vidon et al., 2010), animal scat (Erskine et al., 1998; van der Waal et al., 2011), or animal carcasses (Parmenter and Lamarra, 1991; Carter et al., 2007; Wheeler et al., 2014; Wheeler and Kavanagh, 2017). Hotspots sourced from animal carcasses, also referred to as carrion hotspots, significantly alter surface and belowground soil physiochemistry and plant communi-ties in terrestrial ecosystems (Carter et al., 2007; Keenan et al., 2018b). These alterations can have significant long-term impacts; for example, large animal carcasses had measurable effects on a prairie ecosystem for at least 5 years (Towne, 2000), and for a decade or more in the Arctic (Danell et al., 2002). In addition to providing a critical source of C and N, carrion hotspots are important sources of ecosystem hetero-geneity (Towne, 2000; Bump et al., 2009b) and promote bio-diversity (Barton et al., 2013).
a labile source of nutrients for insect and vertebrate scav-engers as well as soil microfauna and microbiota (i.e., ne-matodes, bacteria, and fungi). Studies evaluating the conse-quences of carrion decay on soil biogeochemistry have mon-itored decomposition on a range of timescales, from days (Metcalf et al., 2013; Macdonald et al., 2014; Keenan et al., 2018b; Szelecz et al., 2018) to years (Towne, 2000; Bump et al., 2009a; Keenan et al., 2018a) and in different climatic and geographic settings, including temperate forests (Melis et al., 2007; Cobaugh et al., 2015; Keenan et al., 2018b) and Australian rangeland (Macdonald et al., 2014), as well as un-der controlled laboratory settings (Carter et al., 2008, 2010). Some of the key changes that occur in soils following the deposition and decomposition of carrion include changes to pH (both increases and decreases), increased electrical con-ductivity, decreased oxygen availability, increased gas fluxes (CO2, CH4, N2O, H2S), elevated rates of microbially driven C and N cycling, and increased dissolved compounds avail-able to microbes (NH+4, NO−3, Ca2+, and SO24−) (Melis et al., 2007; Aitkenhead-Peterson et al., 2012; Keenan et al., 2018b).
Many of the rapid, pulsed perturbations to soil C and N pools observed at carrion hotspots, such as elevated micro-bial respiration rates (measured as CO2release) and changes to soil pH, return to background biogeochemical conditions during the skeletal stage of decomposition, when soft tis-sues have been largely or completely degraded by insect and vertebrate scavengers (Cobaugh et al., 2015; Keenan et al., 2018b). However, certain biogeochemical measures, includ-ing soil stableδ15N composition, have been observed to re-main enriched in soils collected at carrion hotspots compared to background soils for a protracted period of time, up to several years (Bump et al., 2009a; Wheeler and Kavanagh, 2017). Soil stable isotopic composition integrates all bio-geochemical activity within the soil as well as inputs from plant or animal matter. In contrast with δ15N enrichment, no changes in soilδ13C composition have been observed in surface soils of decomposition hotspots (Wheeler and Ka-vanagh, 2017; Keenan et al., 2018b). A variety of studies have demonstrated the potential for natural abundances of 15N to be used as a tracer of ecological processes, includ-ing N input from animals (urea and feces) in N-limited and isolated ecosystems (Erskine et al., 1998) and input of ma-rine taxa (salmon carcasses) to terrestrial and riparian areas (Kline et al., 1990; Koyama et al., 2005).
While15N enrichment due to carrion decomposition has been demonstrated in previous work, these studies were lim-ited to surface soils (maximum sampling depth of 10 cm) from the center of the hotspots (Bump et al., 2009a; Wheeler and Kavanagh, 2017). This has left a gap in our understand-ing of the spatial extent of carcass enrichment, which is ultimately necessary for quantifying ecosystem impacts of these decomposition inputs. Given the potential for natural abundance15N to serve as a long-term tracer of decomposi-tion processes, the goal of this study was to evaluate spatial
changes in stable15N enrichment at a carrion hotspot 1 year post-decay. In particular, the lateral and vertical extent of sta-ble isotope changes as a result of enhanced biogeochemical reactions in a hotspot is largely unknown. Soils beneath and adjacent to former carrion hotspots (up to∼40 cm, the extent of visible fluid migration) were expected to remain15N en-riched 1 year after decay. Additionally, isotopic enrichment was expected to persist to at least 10 cm depth, the maximum depth examined in previous studies.
2 Materials and methods
2.1 Study area and sample collection
The study site was a mixed deciduous forest in east Tennessee (36◦001.000N, 84◦1301.600W, ∼330 m elevation).
Soils were part of the Fullerton–Pailo complex and charac-terized as Typic Paleudults (Soil Survey Staff, 2018). The A horizon extended to approximately 20 cm depth. Five∼ 23 kg nuisance North American beaver (Castor canadensis) carcasses were placed frozen within scavenger prevention enclosures (1.19×0.74×0.81 m) and allowed to decay nat-urally, starting 31 July 2016. As part of a separate study, approximately 75 g of surface soil (0–5 cm depth) was col-lected a total of five times during decay beneath each animal (Keenan et al., 2018b). For this study, soils were collected on 8 August 2017, 1 year after decomposition, and after bones had been removed from the site. Soils were taken from sur-face transects as well as from cores obtained at depth be-low three carrion hotspots. Approximately 30 g of soil from the top 0–5 cm were collected using a 3 cm diameter auger within the hotspot – an elliptical area 40 to 80 cm in diam-eter of visibly discolored soil (Figs. 1, 2). Surface samples were additionally collected along a linear transect radiating perpendicular from the longest axis of the elliptical hotspot at 20 cm intervals up to 140 cm (Fig. 1). Within the hotspots, soils were cored to a depth of 50 cm using a 10 cm diame-ter auger; cores were partitioned into depth indiame-tervals of 0– 5, 5–10, 10–15, 15–20, 20–30, 30–40, and 40–50 cm depth (Fig. 1).
All soil samples were homogenized to a uniform consis-tency in the field by hand (changing nitrile gloves between samples), removing any rocks, roots, leaves, or vegetation larger than 2 mm. Samples were transported to the lab and processed immediately. Aliquots were oven-dried in tripli-cate at 105◦C for 48 h to determine gravimetric moisture
T able 1. Selected soil biogeochemical data during 1 year of decomposition. Letters indicate hotspot soil samples within each measured dataset (i .e., pH) that were not significantly dif ferent based on one-w ay ANO V A ( p < 0 . 05) and Holm–Sidak post hoc testing. Asterisks indicate significant dif ferences between control and treatment soils. N.M. indicates parameters were not measured. Control samples were homogenized into a single repr esentati v e sa mple and do not ha v e standard de viations. Data, except for 1 year post decay , were pre viously published in K eenan et al. (2018b). Sampling Soil Gra vimetric pH Conducti vity Dissolv ed oxygen T otal carbon T otal nitrogen C / N δ 15 N δ 13 C date moisture (µS cm − 1) (%) (%) (%) Initial 29 July 0 . 299 ± 0 . 012 AB 6 . 79 ± 0 . 1 A 47 . 83 ± 5 . 9 A C 98 . 5 ± 0 . 29 A 5 . 11 ± 0 . 101 0 . 295 ± 0 . 009 17 . 33 ± 0 . 25 A C 1 . 48 ± 0 . 23 A − 27 . 86 ± 0 . 08 Early 1 August 0 . 216 ± 0 . 034 A 6 . 86 ± 0 . 3 A 73 . 53 ± 32 . 2 A N.M. 3 . 927 ± 1 . 08 0 . 245 ± 0 . 058 15 . 93 ± 1 . 7 A C 2 . 65 ± 1 . 66 A − 27 . 73 ± 0 . 42 Early control 1 August 0.219 6.82 36.78 N.M. 4.196 0.247 16.99 1.76 − 27 . 56 Acti v e 3 August 0 . 234 ± 0 . 056 A 8 . 64 ± 0 . 3 B 2150 . 48 ± 1282 BC 9 . 16 ± 7 . 89 BC 4 . 251 ± 0 . 798 0 . 362 ± 0 . 096 12 . 01 ± 1 . 34 BC 6 . 23 ± 1 . 50 B − 27 . 77 ± 0 . 30 Acti v e control 3 August 0.160 6.68* 31.65* 98 . 6 ± 1 . 25* 4.159 0.267 15.58* 1.48* − 27 . 68 Adv anced 9 August 0 . 286 ± 0 . 081 AB 8 . 78 ± 0 . 1 B 1233 ± 494 C 19 . 4 ± 31 . 2 B 4 . 000 ± 1 . 29 0 . 303 ± 0 . 080 13 . 07 ± 0 . 75 BC 8 . 72 ± 2 . 09 B − 27 . 64 ± 0 . 20 Adv anced control 9 August 0.223 6.84* 43.42* 98 . 0 ± 0 . 57* 5.008 0.281 17.82* 1.26* − 27 . 77 Early sk eletal 6 September 0 . 242 ± 0 . 070 A 7 . 58 ± 0 . 4 C 973 . 8 ± 211 A C 97 . 4 ± 0 . 84 A C 3 . 610 ± 0 . 839 0 . 293 ± 0 . 057 12 . 28 ± 0 . 74 BC 9 . 26 ± 1 . 54 B − 27 . 74 ± 0 . 30 Early sk eletal control 6 September 0.121 6.84* 35.08 98 . 3 ± 0 . 50 4.023 0.259 15.53* 1.78* − 27 . 63 Late sk eletal 9 December 0 . 271 ± 0 . 021 AB 6 . 93 ± 0 . 3 A 225 . 2 ± 84 . 8 A C 100 ± 0 A 2 . 668 ± 0 . 352 0 . 214 ± 0 . 030 12 . 51 ± 0 . 67 BC 9 . 25 ± 1 . 33 B − 27 . 41 ± 0 . 25 Late sk eletal control 9 December 0.246 6.73 29.13 100 ± 0 2.084 0.136 15.37* 1.79* − 27 . 30 1 year post decay 10 August 0 . 404 ± 0 . 027 B 6 . 10 ± 0 . 3 D 29 . 47 ± 7 . 6 A N.M. 4 . 253 ± 1 . 07 0 . 285 ± 0 . 036 15 . 24 ± 3 . 49 C 8 . 42 ± 1 . 52 B − 27 . 67 ± 0 . 25 1 year post decay control 10 August 0.449* 6.29* 23.07 N.M. 4.36 0.26 17.08 0.05* − 27 . 73 Protein Microbial respiration rate DOC Ammonium Nitrification potential rate Nitrate DON Accumulated de gree (mg g − 1) (µgCO 2 -C release gdw − 1d − 1) (µg C gdw − 1) (mg NH 4 -N gdw − 1) (mg NO 2 gdw − 1d − 1) (mg NO
−-N3
Figure 1.Schematic cross section view of the locations of soil samples (stars) collected from each of three carrion decomposition sites. Dashed line represents the hotspot – the area of visibly discolored soil. Soils collected at depth extended to the B horizon. The visibly discolored area of soil due to carrion hotspot formation extended approximately 35–40 cm from the hotspot center along the surface and to a few centimeters depth.
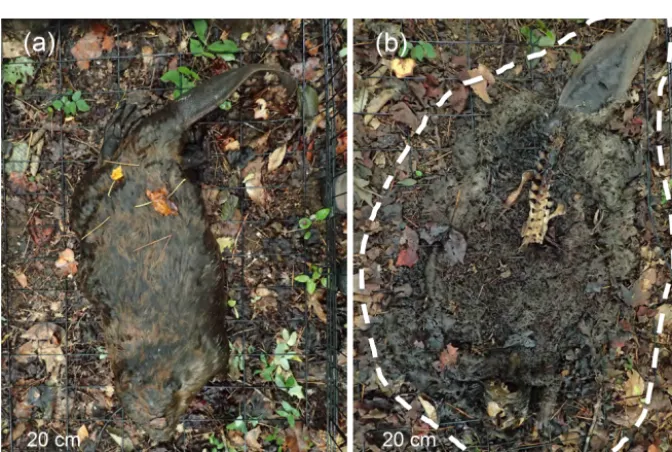
Figure 2.View of a beaver after placement(a)and during advanced decay(b)to demonstrate the lateral migration of carcass-derived fluids
during decay. Both photos are from the same animal, and(b)were taken during advanced decay (8 August 2016). Visible extent of fluid migration is outlined in the white dashed line.
a Flash 2000 elemental analyzer. Soil δ13C and δ15N val-ues were measured on a Delta V Plus continuous-flow (Con-flo IV, Thermo Fisher Scientific) isotope ratio mass spec-trometer. Standards included millet and acetanilide. Millet was used to evaluate linearity. Sample carbon isotopic val-ues were corrected for sample size and instrument drift us-ing millet and acetanilide, and nitrogen values were cor-rected using millet, acetanilide, and urea. Analytic preci-sion was<0.2 ‰ for both carbon and nitrogen. Results are presented inδ notation as parts per mil (‰) whereδ13C= [((13C/12Csample/13C/12Cstandard)−1)×1000]andδ15N=
[((15N/14Nsample/15N/14Nstandard)−1)×1000]. Vienna Pee Dee Belemnite was used as the carbon standard and air was used for nitrogen.
[image:4.612.131.467.292.518.2]headspace CO2was measured immediately after placing and sealing soil into 60 mL serum vials, and also after 24 h (LI-820, Licor Inc.). Vacuum-filtered (1 µm; Ahlstrom, glass mi-crofiber) soil extracts (10 g soil: 40 mL 0.5 M K2SO4) were collected after shaking for 4 h at 150 rpm at room temper-ature and were frozen at −20◦C until the subsequent col-orimetric analysis of ammonium and nitrate (Rhine et al., 1998; Doane and Horwath, 2003). Aliquots were oxidized with a persulfate solution to measure dissolved organic car-bon (DOC) as evolved CO2and dissolved organic nitrogen (DON) colorimetrically as nitrate (Doyle et al., 2004). Ni-trification potential was determined colorimetrically using a modified chlorate block method optimized for microplates (Belser and Mays, 1980; Keeney and Nelson, 1982; Hart, 1994). Soil pH and electrical conductivity were measured from a soil slurry (3 g soil: 6 mL deionized water) using a handheld multi-parameter meter (Orion A329, Thermo Sci-entific). Protein content was determined using the Brad-ford assay (Wright and Upadhyaya, 1996; Redmile-Gordon et al., 2013). Because the goal of this study was to focus specifically on stable isotopes as long-term tracers in carrion hotspots, only surface soils from the five remnant hotspot centers were processed for full physiochemistry.
2.2 Stable isotope analyses
The contribution of carcass-derived nitrogen to bulk soil sta-ble isotopic composition in surface transects was determined using a linear two-member isotope mixing model (Wheeler and Kavanagh, 2017; Keenan et al., 2018b), using bulk con-trol soilδ15N composition (0.1 ‰) as one end-member and beaver decomposition fluid (10.2 ‰) as the other. Decom-position fluid is the by-product of microbial and autolytic processes acting on a carcass after animal death. Fluids con-sist of amino acids, dead and live microbial cells, urea, wa-ter, and lipids, and they represent one of the primary mecha-nisms for return of host’s tissues to the surrounding environ-ment. Decomposition fluid isotopic composition was previ-ously determined, using fluids collected from three decom-posing beavers left on a shallow plastic tray to intercept flu-ids (Keenan et al., 2018b). The linear equation for the isotope mixing model (Wheeler and Kavanagh, 2017) was defined as follows:
CDN=(TEM−SEM) / (FEM−SEM)×100, (1)
where CDN is the carcass-derived N (%), TEM is the aver-ageδ15N of soil from the treatment condition (sampling in-terval along the surface transects), SEM is the end-member control soil stable isotopic composition (0.1 ‰), and FEM is the end-member isotopic composition of decomposition flu-ids (10.2 ‰). The contribution of control soil-derivedδ15N to measured treatment conditions was calculated by subtracting CDN (%) from 100 %.
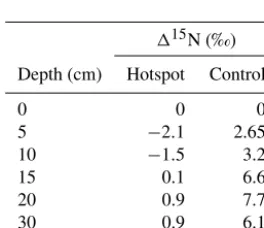
To track changes inδ15N between surface soil and soil col-lected at depth,115N values were calculated by subtracting
the δ15N value of soil at each depth from values obtained at the surface of the hotspot and control sampling locations. Negative115N values indicate that surface soils are15N en-riched compared to soils at depth (Martinelli et al., 1999).
2.3 Statistical analyses
Data were analyzed using SigmaPlot to test for signifi-cant differences between treatments and controls. For both surface and depth transects, data from the three transects were treated as replicates for subsequent statistical analyses. Significance (p <0.05) was determined based on one-way ANOVA analyses with Holm–Sidak post hoc testing. Sig-nificant differences between control and hotspot soils were determined using paired t tests at each sampling depth or transect interval using R (R Core Team, 2018, version 3.5.0).
3 Results
3.1 Surface soil biogeochemical changes during
decomposition
During carrion decomposition, fluids sourced from the car-cass were released into the surrounding environment (Fig. 2). The pulse of nutrient-rich fluids resulted in significant long-term changes to surrounding soil physiochemistry follow-ing fluid degradation by soil microbial communities (Table 1 and Table S1). In particular, after 1 year of decay, soil pH was significantly lower than control, initial, and pre-decay soils (p <0.001; F=59.317). In addition, bulk soil δ15N remained significantly enriched compared to control and starting soil isotopic composition (p <0.001;F =27.948). Other physicochemical parameters, including conductivity, microbial respiration, DOC, DON, ammonium, nitrate, and nitrification potential all returned to background conditions after 1 year. With the exception of the 1 year samples, data were previously published in Keenan et al. (2018b) and are included here for comparison.
3.2 Lateral changes in stable isotopic composition
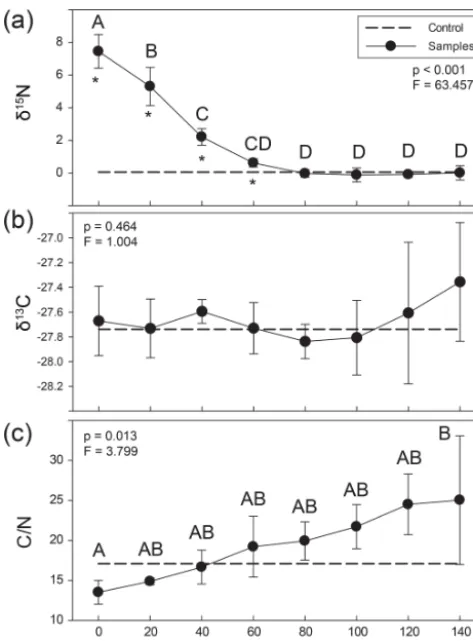
Soils were significantly15N enriched within the visible car-rion hotspot (mean soil composition 7.5±1.0 ‰) and up to 60 cm from the hotspot center (2.2±0.5 ‰) compared to composite control soils (0.1 ‰) (Fig. 3, Table S2) (paired
Figure 3. Lateral changes in soil stable (a)δ15N and(b) δ13C isotopic composition and (c) C/N ratios extending from carrion hotspot centers. Soil was visibly discolored 35–40 cm from the cen-ter (here, 0 cm distance). Letcen-ters indicate soil samples taken at dis-crete distances from hotspot center that were not significantly dif-ferent based on an ANOVA and Holm–Sidak post hoc test. Aster-isks denote the significant differences between control and hotspot soils (ttest) at each respective distance. The dashed line represents control surface soil (0–5 cm) composition.
The influence of carrion decomposition on soil stable
δ15N isotopic composition decreases with increasing dis-tance from the hotspot (Figs. 3a, S1 in the Supplement). Soil C/N composition follows a linear trend, increasing by 0.07 per centimeter from the hotspot center (Fig. S1). Based on linear two-member isotope mixing models, carcass-derived fluids exhibit a linear decrease in contribution to soil isotopic composition with increasing distance from the hotspot. Car-casses contribute to soil stableδ15N isotopic composition up to 60 cm from the hotspot center (Fig. 4), an area that was beyond the decomposition island and was not visibly discol-ored (Fig. 2).
3.3 Vertical changes in stable isotopic composition
Soil collected at depth beneath the three mortality hotspots was significantly15N enriched compared to control soils up
Figure 4.Results of linear two-member isotope mixing
distinguish-ing the contributions of soil and carcass fluid to bulk soil stable iso-topic composition.
to 10 cm depth (Fig. 5). Surface hotspot soils were also en-riched at 30 cm depth compared to the control. Control soils became more15N enriched with increasing depth. There was no significant difference between control and hotspot soil
δ13C and C/N values, and both exhibited the same trends with depth. Soils exhibited13C enrichment with increasing depth and a decline in C/N ratios.
Control soils exhibited a strong positive linear relationship between the negative of the natural log of bulk soil % N and stable isotopic composition, reflecting decreasing N and C availability with increasing depth. Decomposition results in a shift in the observed hotspot soil N isotopic discrimina-tion (D, or the slope of the linear regressions) (Natelhoffer and Fry, 1988), leading to a breakdown of a strong linear relationship compared to control soils (Fig. 6).Ddoes not change for C isotopes in control or hotspot soils.
In general, soils exhibit a trend of increasing115N (the difference between soilδ15N value at a specific depth and
δ15N at the surface) with depth, reflecting15N enrichment in deep forest soils (Martinelli et al., 1999). Hotspot soils exhib-ited lower115N values compared to control soils, indicating little change in15N enrichment with depth (Table 2). Control soils displayed increasing115N with depth, a pattern glob-ally observed in forest soils (Martinelli et al., 1999) (Table 2). Combined withD(Fig. 6), hotspot and control vertical pro-files have distinct N sources and exhibit distinct N pools with depth.
[image:6.612.308.546.67.222.2]Figure 5.Stable isotopic composition and C/N ratios for soils beneath carrion hotspots (closed circles) and at a control location (stars). Letters indicate hotspot soil samples as a function of depth that were not significantly different based on post hoc testing, and asterisks indicate significant differences between control and hotspot soils at each depth interval (both based on one-way ANOVA,p <0.05).
Figure 6.Bulk soil stable isotopic composition and corresponding negative natural log % N(a)and % C(b)for hotspot and control soils
with depth. Linear regressions were fit to hotspot and control datasets.
Table 2.Differences in soilδ15N at depth andδ15N in surface soils
for hotspot and control depth profiles.
115N (‰) Depth (cm) Hotspot Control
0 0 0
5 −2.1 2.65
10 −1.5 3.2
15 0.1 6.6
20 0.9 7.7
30 0.9 6.1
40 1.2 8.4
4 Discussion
Soils associated with carrion decomposition hotspots re-tained biogeochemical markers of vertebrate decay at least 1 year after soft tissue degradation. Within the hotspots, soils remained15N enriched compared to control locations. At this
specific location and soil type, decomposing animals have the potential to exert long-term changes, here at least 1 year, on surface and subsurface soil stable isotopic composition. The beaver carcasses used in this study, which were between 20 and 25 kg in mass, resulted in measurable changes to soil biogeochemistry down to 10 cm depth and up to 60 cm away from the hotspot center, beyond the area that was visibly dis-colored from decomposition fluids. The total % N measured in soils can be used to approximate the contribution of beaver N to soil. During active decomposition, hotspot soils con-tained 36 % more N compared to control soils (0.362 % N vs. 0.267 %). After 1 year, hotspot soils still contained 10 % more N than control soils (0.285 % N vs. 0.260 %), reflect-ing a loss of∼28 % of the beaver-derived N in 1 year. Based on prior calculations, each beaver introduced approximately 0.47–0.79 kg N and 2.7–4.6 kg C to the soil (Keenan et al., 2018b). After 1 year, approximately 0.05–0.08 kg N derived from the carcass remains within the soil.
[image:7.612.101.233.511.625.2]iso-topic composition decreases with increasing distance from the hotspot (Fig. 4). However, the observed isotopic enrich-ment likely reflects a contribution of a 15N-enriched input (carcass fluid) as well as subsequent diagenetic fractionation driven by soil microorganisms. It is likely that the elevated N availability provided by a decomposing carcass would result in additional nitrification and denitrification, which would in-crease theδ15N independent of source mixing. Nitrification potential rates were elevated during earlier stages of decom-position but were not different from control soils after 1 year (Table 1). The two-member mixing model assumes a simple mixing of soil and carcass-derived N, but diagenetic fraction-ation is also likely involved in the observed δ15N patterns along the surface transects.
The contribution of carcass-derived N to soils at depth as well as laterally is influenced by a variety of physical and climatic variables. Here, decay occurred during the summer in east Tennessee, with an average high of 32.2◦C for the
month of August. Carcasses were exposed to measurable pre-cipitation 6 out of 10 d after placement, preventing soft tis-sues from significant desiccation and supporting abundant blowfly larvae and other insect activity. Blowfly larvae mi-grating away from the carcasses on the surface and within the soil to pupate likely provided an important physical mech-anism to distribute beaver-enriched N to surrounding soils. Blowfly larvae can move up to 10 m away from the carcass, and typically extend down into the soil up to 10 cm depth, de-pending on the soil substrate properties (Gomes et al., 2006). As blowfly larvae disperse, they have the potential to phys-ically transport decomposition fluids acquired internally or externally during feeding, release excrement during migra-tion, or die, leaving their tissues to degrade. An estimated 66 % of pupae that disperse to pupate die en route (Putman, 1977). Rainfall may have also contributed to the downward movement of decomposition fluids.
The temporal persistence of isotopic enrichment hotspots is currently unknown but is likely to be ecosystem, carrion type, and carrion mass-specific. A larger carcass would be expected to result in greater lateral and vertical dispersal of carrion-derived fluids, as well as greater changes to ecosys-tem processes, because of the greater volume of decompos-ing soft tissue (Baruzzi et al., 2018). In addition, larger car-casses may host a larger and longer-lived insect community (Parmenter and MacMahon, 2009), including blowfly lar-vae, which may further nutrient dispersal and may impact a larger area. Bump et al. (2009b) observed elevated foliar
δ15N values in plants growing on sites impacted by deer car-cass (∼56 kg) decomposition at least 2.5 years after decay in a temperate hardwood forest, suggesting a long-lived hotspot signature. In some ecosystems, such as the Arctic tundra, iso-topic enrichment is likely to persist for even longer based on perturbations to C and N surrounding muskox after 5 to 10 years of decay (Danell et al., 2002).
Increasing δ13C andδ15N values with depth in soils has previously been observed in a variety of soil types and
cli-matic conditions (Natelhoffer and Fry, 1988; Martinelli et al., 1999; Billings and Richter, 2006). Changes toδ13C with depth are due to progressive cycling of C through microbial biomass (Liang et al., 2017), where selective preservation and biochemical fractionation together lead to13C-enriched organic C in soil (Natelhoffer and Fry, 1988; Billings and Richter, 2006). While we observed a similar increase inδ13C with depth, we did not see a significant change in13C as a result of carcass enrichment. Wheeler and Kavanagh (2017) similarly did not observe a change in soilδ13C following car-rion decomposition, which may be due to the degradation of carcass-derived C (and uptake by microbes and blowfly lar-vae) combined with elevated background C in soil compared to N.
Increasing δ15N values with depth reflects two broad biochemical processes leading to fractionation, both likely driven by microbial activities. First, the preferential excre-tion of15N-depleted compounds during catabolism and an-abolism leaves the residual microbial cells and soil15N en-riched. Second, kinetic fractionation associated with gaseous N loss is also known to result in enrichment, depending on the microbial communities present and N mineralization rates (Evans, 2001; Robinson, 2001; Liang et al., 2017). Over time, as soil profiles develop, accretion of15N-enriched mi-crobial cells, particularly fungi, leads to isotopic enrichment at depth (Billings and Richter, 2006). In contrast, plant and leaf litter are the dominant contributors to N pools in sur-face soils in most temperate forest ecosystems (Vidon et al., 2010), resulting in surface soils that are isotopically depleted compared to the soils at depth. Decomposition hotspots, however, disrupt the expected pattern (Fig. 5), causing sur-face enrichment and likely leave a lasting impact on soil sta-ble isotopic composition.
For systems at or near steady state conditions, the differ-ence in isotopic enrichment between soils at depth and the surface (115N) provides a way to compare soils from dif-ferent geographic and climatic locations (Martinelli et al., 1999), and was used here to compare hotspot soils and those collected at control locations.115N values observed in the control depth profile are within the expected range observed in temperate forests worldwide (2.7 ‰ to 9.1 ‰) (Table 2). However, as a consequence of carrion inputs and decay,
115N values are more similar to those observed in tropi-cal forest ecosystems (1.1 ‰ to 4.3 ‰). In tropitropi-cal systems, lower115N values are thought to reflect more open N cy-cling with elevated N losses (nitrification, nitrate leaching, and ammonia volatilization) under conditions of elevated to-tal N inputs (Martinelli et al., 1999). Whether our observed changes in 115N are due to elevated N cycling rates, dis-equilibrium effects across the soil profile due to changing N inputs from a system dominated by atmospheric dry and wet deposition of nitrate and ammonium to one with carrion-sourced N, or both, is not known.
hotspot soil δ13C (Fig. 6), suggesting that C cycling and pools in soils 1 year after carrion decay are not altered. In contrast, Dvalues for δ15N were different between control and hotspot soils, which reflects a loss of the linear relation-ship and indicates distinct N sources for the two soil profiles. This also emphasizes that decaying carrion provide an impor-tant and potentially distinct N pool for soil ecosystems that have the potential to mask natural (background) processes that control soil profile15N gradients with depth. In addition, differences in D values between the two soils suggest that there may be less discrimination occurring within hotspot soils compared to control soils, likely due to the rapid input of an isotopically enriched N pool (Evans, 2001).
Hotspot soils received the input of beaver-derived fluids (10.2±0.4 ‰) (Keenan et al., 2018b) as well as soft and hard tissues (1.0 ‰ to 4.0 ‰ for beaver bone collagen from Minnesota; Fox-Dobbs et al., 2007). Stable isotopic compo-sition of surface soils strongly suggests that decompocompo-sition fluids are a significant contributing source to bulk soil sta-ble isotopic composition up to 60 cm from the hotspot center (Fig. 4), andδ15N-enriched values in the soil profile at depth also suggest some contributions up to 10 cm depth (Fig. 5). Beyond 10 cm depth, control soils and hotspot soils are indis-tinguishable, suggesting that decomposition fluids do not sig-nificantly influence soil stable isotopic composition. Rather, naturalδ15N enrichment due to soil accretion processes can explain the observed soil stable isotopic composition.
5 Conclusions
The decay of∼23 kg North American beaver carcasses re-sulted in rapid (within days) and long-lived (up to 1 year)15N enrichment in forest soils up to 10 cm depth and∼60 cm dis-tal. Observed15N enrichment at depth and laterally is likely due to a combination of physical movement of fluids during decomposition and the transport of fluids by insects, partic-ularly blowfly larvae. In this system, rainfall during decom-position may have also acted as a physical transport mecha-nism. While likely to be significantly influenced by carcass size, climate, and soil type, decomposition has the potential to exert long-lived influences on soil stable isotopic compo-sition.
Data availability. All data generated in this study are available in the Supplement.
Supplement. The supplement related to this article is available on-line at: https://doi.org/10.5194/bg-16-3929-2019-supplement.
Author contributions. SWK and JMD designed the experiments. All authors assisted with data interpretation. JMD and SMS
pro-vided financial, lab, and analytical resources. SWK and JMD pre-pared the manuscript with contributions from SMS.
Competing interests. The authors declare that they have no conflict of interest.
Acknowledgements. Salvaged nuisance beavers were provided by the USDA, APHIS, Wildlife Services of east Tennessee. Lois S. Taylor, Jose Liquet, Fei Yao, and Jialin Hu assisted with soil collection. Alex Bradley provided lab and instrument access, and Melanie Suess assisted with stable isotopic analyses. The three reviewers are thanked for their constructive feedback that greatly improved this manuscript.
Financial support. This research has been supported by the Na-tional Science Foundation, Directorate for Biological Sciences (grant no. 1549726).
Review statement. This paper was edited by Silvio Pantoja and re-viewed by Lukas Kohl, Michael Philben, and one anonymous ref-eree.
References
Aitkenhead-Peterson, J. A., Owings, C. G., Alexander, M. B., Larison, N., and Bytheway, J. A.: Mapping the lateral extent of human cadaver decomposition with soil chemistry, Forensic Sci. Int., 216, 127–134, https://doi.org/10.1016/j.forsciint.2011.09.007, 2012.
Barton, P. S., Cunningham, S. A., Lindenmayer, D. B., and Man-ning, A. D.: The role of carrion in maintaining biodiversity and ecological processes in terrestrial ecosystems, Oecologia, 171, 761–772, https://doi.org/10.1007/s00442-012-2460-3, 2013. Baruzzi, C., Mason, D., and Lashley, M. A.: Effects of
increas-ing carrion biomass on food webs, Food Webs, 16, e00096, https://doi.org/10.1016/j.fooweb.2018.e00096, 2018.
Belser, L. W. and Mays, E. L.: Specific inhibition of nitrite oxida-tion by chlorate and its use in assessing nitrificaoxida-tion in soils and sediments, Appl. Environ. Microbiol., 39, 505–510, 1980. Billings, S. A. and Richter, D. D.: Changes in stable
iso-topic signatures of soil nitrogen and carbon during 40 years of forest development, Oecologia, 148, 325–333, https://doi.org/10.1007/s00442-006-0366-7, 2006.
Bump, J. K., Peterson, R. O., and Vucetich, J. A.: Wolves modu-late soil nutrient heterogeneity and foliar nitrogen by configuring the distribution of ungulate carcasses, Ecology, 90, 3159–3167, https://doi.org/10.1890/09-0292.1, 2009a.
Carter, D. O., Yellowlees, D., and Tibbett, M.: Cadaver decompo-sition in terrestrial ecosystems, Naturwissenschaften, 94, 12–24, https://doi.org/10.1007/s00114-006-0159-1, 2007.
Carter, D. O., Yellowlees, D., and Tibbett, M.: Tempera-ture affects microbial decomposition of cadavers (Rattus rat-tus) in contrasting soils, Appl. Soil. Ecol., 40, 129–137, https://doi.org/10.1016/j.apsoil.2008.03.010, 2008.
Carter, D. O., Yellowlees, D., and Tibbett, M.: Moisture can be the dominant environmental parameter governing ca-daver decomposition in soil, Forensic Sci. Int., 200, 60–66, https://doi.org/10.1016/j.forsciint.2010.03.031, 2010.
Cobaugh, K. L., Schaeffer, S. M., and DeBruyn, J. M.: Func-tional and structural succession of soil microbial communities below decomposing human cadavers, PLoS One, 10, e0130201, https://doi.org/10.1371/journal.pone.0130201, 2015.
Danell, K., Berteaux, D., and Brathen, K. A.: Effect of muskox car-casses on nitrogen concentration in tundra vegetation, Arctic, 55, 389–392, 2002.
Doane, T. A. and Horwath, W. R.: Spectrophotometric determina-tion of nitrate with a single reagent, Anal. Lett., 36, 2713–2722, https://doi.org/10.1081/AL-120024647, 2003.
Doyle, A., Weintraub, M. N., and Schimel, J. P.: Persulfate digestion and simultaneous colorimetric analysis of carbon and nitrogen in soil extracts, Soil Sci. Soc. Am. J., 68, 669–676, 2004.
Erskine, P. D., Bergstrom, D. M., Schmidt, S., Stewart, G. R., Tweedie, C. E., and Shaw, J. D.: Subantarctic Macquarie Is-land—a model ecosystem for studying animal-derived nitrogen sources using15N natural abundance, Oecologia, 117, 187–193, https://doi.org/10.1007/S004420050647, 1998.
Evans, R. D.: Physiological mechanisms influencing plant ni-trogen isotope composition, Trends Plant Sci., 6, 121–126, https://doi.org/10.1016/S1360-1385(01)01889-1, 2001. Fox-Dobbs, K., Bump, J. K., Peterson, R. O., Fox, D. L., and Koch,
P. L.: Carnivore-specific stable isotope variables and variation in the foraging ecology of modern and ancient wolf populations: case studies from Isle Royale, Minnesota, and La Brea, Can. J. Zool., 85, 458–471, https://doi.org/10.1139/Z07-018, 2007. Gomes, L., Godoy, W. A. C., and Von Zuben, C. J.: A
re-view of postfeeding larval dispersal in blowflies: implications for forensic entomology, Naturwissenschaften, 93, 207–215, https://doi.org/10.1007/s00114-006-0082-5, 2006.
Hart, S. C., Stark, J. M., Davidson, E. A., and Firestone, M. K.: Nitrogen mineralization, immobilization, and nitrification, in: Methods of soil analysis part 2: microbiological and biochemical properties, edited by: Weaver, R. W., Angle, S., Bottomley, P., Bezdicek, D., Smith, S., Tabatabai, A., and Wollum, A., Soil Sci-ence Society of America, Madison, Wisconsin, 985–1018, 1994. Keenan, S. W., Emmons, A. L., Taylor, L. S., Phillips, G., Ma-son, A. R., Mundorff, A., Bernard, E. C., Davoren, J., and DeBruyn, J. M.: Soil physiochemistry and microbial ecol-ogy of a multi-individual grave, PLoS One, 13, e0208845, https://doi.org/10.1371/journal.pone.0208845, 2018a.
Keenan, S. W., Schaeffer, S. M., Jin, V. L., and DeBruyn, J. M.: Mortality hotspots: nitrogen cycling in forest soils during vertebrate decomposition, Soil Biol. Biochem., 121, 165–176, https://doi.org/10.1016/j.soilbio.2018.03.005, 2018b.
Keeney, D. R. and Nelson, M. H.: Nitrogen – inorganic forms, in: Methods of soil analysis, part 2, chemical and microbiological methods, Edited by: Page, A. L., Miller, D. R., and Keeney, D.
R., American Society of Agronomy and the Soil Science Society of America, Madison, WI, 643–698, 1982.
Kline, T. C., Goering, J. J., Mathisen, O. A., Poe, P. H., and Parker, P. L.: Recycling of elements transported upstream by runs of Pacific salmon: 1,δ15N and δ13C evidence in Sashin Creek, southeastern Alaska, Can. J. Fish. Aquat. Sci., 47, 136–144, https://doi.org/10.1139/F90-014, 1990.
Koyama, A., Kavanagh, K., and Robinson, A.: Marine ni-trogen in central Idaho riparian forests: evidence from stable isotopes, Can. J. Fish. Aquat. Sci., 62, 518–526, https://doi.org/10.1139/F04-220, 2005.
Liang, C., Schimel, J. P., and Jastrow, J. D.: The importance of an-abolism in microbial control over soil carbon storage, Nat. Mi-crobiol., 2, 17105, https://doi.org/10.1038/Nmicrobiol.2017.105, 2017.
Lodge, D. J., Winter, D., Gonzalez, G., and Clum, N.: Effects of hurricane-felled tree trunks on soil carbon, nitrogen, microbial biomass, and root length in a wet tropical forest, Forests, 7, 264, https://doi.org/10.3390/F7110264, 2016.
Macdonald, B. C. T., Farrell, M., Tuomi, S., Barton, P. S., Cunningham, S. A., and Manning, A. D.: Carrion decom-position causes large and lasting effects on soil amino acid and peptide flux, Soil Biol. Biochem., 69, 132–140, https://doi.org/10.1016/j.soilbio.2013.10.042, 2014.
Martinelli, L. A., Piccolo, M. C., Townsend, A. R., Vitousek, P. M., Cuevas, E., McDowell, W., Robertson, G. P., Santos, O. C., and Treseder, K.: Nitrogen stable isotopic composition of leaves and soil: tropical versus temperate forests, Biogeochemistry, 46, 45– 65, https://doi.org/10.1023/A:1006100128782, 1999.
McClain, M. E., Boyer, E. W., Dent, C. L., Gergel, S. E., Grimm, N. B., Groffman, P. M., Hart, S. C., Harvey, J. W., John-ston, C. A., Mayorga, E., McDowell, W. H., and Pinay, G.: Biogeochemical hot spots and hot moments at the interface of terrestrial and aquatic ecosystems, Ecosystems, 6, 301–312, https://doi.org/10.1007/s10021-003-0161-9, 2003.
Melis, C., Selva, N., Teurlings, I., Skarpe, C., Linnell, J. D. C., and Andersen, R.: Soil and vegetation nutrient response to bison car-casses in Białeowie˙za Primeval Forest, Poland, Ecol. Res., 22, 807–813, https://doi.org/10.1007/s11284-006-0321-4, 2007. Metcalf, J. L., Parfrey, L. W., Gonzalez, A., Lauber, C. L.,
Knights, D., Ackermann, G., Humphrey, G. C., Gebert, M. J., Van Treuren, W., Berg-Lyons, D., Keepers, K., Guo, Y., Bullard, J., Fierer, N., Carter, D. O., and Knight, R.: A microbial clock provides an accurate estimate of the post-mortem interval in a mouse model system, Elife, 2, e01104, https://doi.org/10.7554/eLife.01104, 2013.
Natelhoffer, K. J. and Fry, B.: Controls on natural15N and13C abundances in forest soil organic matter, Soil Sci. Soc. Am. J., 52, 1633–1640, 1988.
Parmenter, R. R. and Lamarra, V. A.: Nutrient cycling in a fresh-water marsh: the decomposition of fish and fresh-waterfowl carrion, Limnol. Oceanogr., 36, 976–987, 1991.
Putman, R. J.: Dynamics of the blowfly,Calliphora erythrocephala, within carrion, J. Anim. Ecol., 46, 853–866, 1977.
R core team, R: A language and environment for statistical com-puting, available at: https://www.R-project.org/ (last access: De-cember 2018), version 3.5.0, 2018.
Redmile-Gordon, M. A., Armenise, E., White, R. P., Hirsch, P. R., and Goulding, K. W. T.: A comparison of two colorimetric as-says, based upon Lowry and Bradford techniques, to estimate total protein in soil extracts, Soil Biol. Biochem., 67, 166–173, https://doi.org/10.1016/j.soilbio.2013.08.017, 2013.
Rhine, E. D., Sims, G. K., Mulvaney, R. L., and Pratt, E. J.: Im-proving the Berthelot reaction for determining ammonium in soil extracts and water, Soil Sci. Soc. Am. J., 62, 473–480, 1998. Robinson, D.: δ15N as an integrator of the nitrogen cycle,
Trends Ecol. Evol., 16, 153–162, https://doi.org/10.1016/S0169-5347(00)02098-X, 2001.
Soil Survey Staff: Web Soil Survey, Natural Resources Con-servation Service, United States Department of Agriculture, available at: https://websoilsurvey.sc.egov.usda.gov/, last access: 29 May 2018.
Szelecz, I., Koenig, I., Seppey, C. V. W., Le Bayon, R. C., and Mitchell, E. A. D.: Soil chemistry changes beneath decomposing cadavers over a one-year period, Forensic Sci. Int., 286, 155–165, https://doi.org/10.1016/j.forsciint.2018.02.031, 2018.
Towne, E. G.: Prairie vegetation and soil nutrient re-sponses to ungulate carcasses, Oecologia, 122, 232–239, https://doi.org/10.1007/Pl00008851, 2000.
van der Waal, C., Kool, A., Meijer, S. S., Kohi, E., Heitkonig, I. M. A., de Boer, W. F., van Langevelde, F., Grant, R. C., Peel, M. J. S., Slotow, R., de Knegt, H. J., Prins, H. H. T., and de Kroon, H.: Large herbivores may alter vegetation structure of semi-arid savannas through soil nutrient mediation, Oecologia, 165, 1095– 1107, https://doi.org/10.1007/s00442-010-1899-3, 2011. Vidon, P., Allan, C., Burns, D., Duval, T. P., Gurwick, N., Inamdar,
S., Lowrance, R., Okay, J., Scott, D., and Sebestyen, S.: Hot spots and hot moments in riparian zones: potential for improved water quality management, J. Am. Water Resour. Assoc., 46, 278–298, https://doi.org/10.1111/j.1752-1688.2010.00420.x, 2010. Wheeler, T. A. and Kavanagh, K. L.: Soil biogeochemical responses
to the deposition of anadromous fish carcasses in inland riparian forests of the Pacific Northwest, USA, Can. J. Forest Res., 47, 1506–1516, https://doi.org/10.1139/cjfr-2017-0194, 2017. Wheeler, T. A., Kavanagh, K. L., and Daanen, S. A.:
Ter-restrial salmon carcass decomposition: nutrient and isotopic dynamics in central Idaho, Northwest Sci., 88, 106–119, https://doi.org/10.3955/046.088.0206, 2014.