CINET 2.0: A CyberInfrastructure for Network
Science
Sherif Abdelhamid
1, Maksudul Alam
1, Richard Alo
2, Shaikh Arifuzzaman
1, Pete Beckman
3, Tirtha Bhattacharjee
1,
Hasanuzzaman Bhuiyan
1, Keith Bisset
1, Stephen Eubank
1, Albert C. Esterline
4, Edward A. Fox
1, Geoffrey C. Fox
5,
S.M.Shamimul Hasan
1, Harshal Hayatnagarkar
1, Maleq Khan
1, Chris J. Kuhlman
1, Madhav V. Marathe
1,
Natarajan Meghanathan
2, Henning S. Mortveit
1, Judy Qiu
5, S.S. Ravi
6, Zalia Shams
1, Ongard Sirisaengtaksin
7,
Samarth Swarup
1, Anil Kumar S. Vullikanti
1, and Tak-Lon Wu
51Virginia Tech, Blacksburg, VA;2Jackson State University, Jackson, MS;3Argonne National Laboratory, Chicago, IL;
4North Carolina A&T State University, Greensboro, NC;5Indiana University, Bloomington, IN;
6University at Albany, SUNY, Albany, NY; 7University of Houston, Houston, TX
Abstract—Analysis of structural properties and dynamics of networks is currently a central topic in many disciplines including Social Sciences, Biology and Business. CINET, a cyberinfras-tructure for such studies, introduced the concept of supporting network analysis as a service. The basic idea is to allow experts in various disciplines to focus on obtaining domain-specific insights from the results of network analyses instead of worrying about programming details and allocation of computational resources needed to carry out the analyses. A basic version of CINET was released in May 2012. This paper discusses CINET 2.0, a significantly enhanced version that supports complex network analyses through a web portal. CINET 2.0 has already been used for teaching courses related to Network Science at several US universities. In this paper, we discuss how CINET 2.0 significantly extends CINET 1.0 through enhancements to some components and the addition of new components.
I. INTRODUCTION
A. Background
Networks are widely used to represent and study the behav-ior of many real-world systems. According to [17], “network science is the study of network representations of physical, biological, and social phenomena.” Many tools for structural analysis, dynamics simulation, and visualization are currently available; some of these are mentioned in Section VIII. Many tools are stand-alone applications that a user downloads, in-stalls, compiles, and runs. In contrast, using cyberinfrastructure for network analyses is a useful approach for domain experts and novices who may not be computer experts or have access to high performance computing platforms that are needed to run these applications.
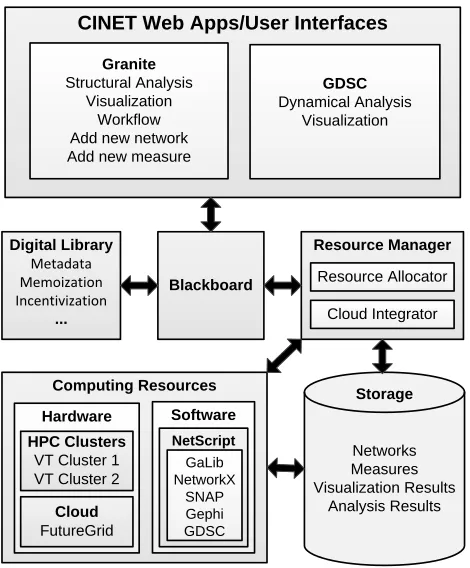
We present version 2.0 of the CINET cyberinfrastructure for structural and dynamical evaluation of networks and for network generation. CINET is an open access, web-based system. The user interface is the front end of a distributed system that has sophisticated applications on the back end that run on high performance compute clusters and other compute resources. An extensible, flexible middleware connects the front and back ends to several additional modules that include a digital library (DL) and resource manager (RM). Current meta-applications are(i)Granite, an umbrella application for
network structural analysis that supports NetworkX, SNAP, GaLib, and Gephi applications; and (ii) GDSCalc or GDSC that computes dynamics of networks.
CINET 2.0 is designed for self-sustainability and self-management: it now has automated capabilities for users to contribute both networks and applications, the recent inclusion of the SNAP [25] application being a concrete example. Users are encouraged to contribute through an incentivization service: providers of networks and code are listed with their contributions in the user interface for all users to see, and the number of times each contribution is used is made available to providers. It ispervasiveandeasy to use: it is accessed through the Internet, and provides all required hardware and software resources. This makes CINET attractive for researchers, edu-cators, and students whose focus is on network science, and who may have no background in computer science. Usability is a first-order attribute of the system: the workflows and on-screen information make user-interaction intuitive. CINET also serves as a prototype for open science, illustrating how data and methods can be made publicly available. It can also serve as a repository for massive open online courses (MOOCs), and other multi-modal information. Content currently exists (e.g., links to course notes), accessible through the CINET landing page [3], and will grow with additional use. This content also supports research, education, and training.
We emphasize that this paper (its descriptions of the system design, selected components, user interface, exam-ples, data plots, and course usage) are all beyond those of CINET 1.0 [10]. Consequently, for example, our contributions here are solely based on new work; for example, the data plots presented in this paper could not have been generated with CINET 1.0. Hence, the previous paper and this one are in many ways complementary.
B. Contributions
TABLE I: CINET components and features that are new or significantly upgraded from version 1.0 to 2.0; “–” indicates a feature that was not supported by CINET 1.0.
Components and
Features CINET 1.0 CINET 2.0
Network
visualization –
New. Offers network mining through
visualization.
NetScript – New. A domain specific language enabling
programming across different graph libraries.
Resource manager – New. Enhances performance and makes
system scalable.
Workflows – New. Provides workflows as a service.
Incentivization – New. DL service giving credits to users for
new contribution to CINET.
Digital library (DL) Basic
features.
Re-architected. Memoization has been completely reworked.
Graph libraries GaLib,
Net-workX [20]. New addition. SNAP [25] application.
Service: add new network.
Basic service with manual processing.
Fully automatedwith validity checking for new networks.
Service: add new network algorithm.
Basic service with manual processing.
Fully automatedwith sandbox isolation feature for executables.
Granite user interface.
Basic user interface.
Re-designedto integrate new features and enhance usability.
GDSC Basic
features.
Re-architecteduser interface improves usability. Number of graph templates and vertex functions have each doubled.
Middleware Basic
features.
Re-designedto enhance scalability and efficiency.
Compute (hardware) resources
Two VT HPC clusters.
New addition. FutureGrid [32]. Numbers of
networks; network algorithms; parallel algorithms; network generators.
Numbers, respectively, are: 85, 95, 2 and 17.
Numbers haveincreasedto 112, 144, 9 and
28, respectively.
1. System Usability.Usability is a major system enhancement,
reflected in a completely redesigned user interface (UI). The landing page [3] content includes descriptions of the appli-cations and selected networks and links to appliappli-cations and other resources. Granite and the Graph Dynamical Systems Calculator (GDSC) applications are reached through theTools menu item. Granite UI screens are automatically populated with descriptions of networks and graph measures when they are highlighted, whereas in the previous version, extra button clicks were required to view this information. Search functions enable networks and software modules (i.e., implementations of algorithms; also called measures) to be searched based on name and other attributes that can be filtered (e.g., networks can be searched based on the numbers of vertices and edges, and whether graphs are weighted, labeled, or connected). When multiple networks and measures are selected, the running list is displayed so that they can easily be tracked. Graph visualizations are provided with networks, and for graphs where these do not exist, a user can request its generation (new digital library services also help in this regard). These visualizations are then available to all users. All jobs for a user are provided in a single screen, with real-time status updates for analyses in-progress, in order to improve user feedback. Similar improvements have also been made in the UI for GDSC, but are not presented here for space reasons. Output data and plots can be viewed on-screen, downloaded to a user’s local machine, and in the case of Granite, can be archived.
2. Software and hardware infrastructure.Cloud computing
(i.e., FutureGrid) resources totaling 5000 cores, are now avail-able within CINET to complement the 2000 cores provided by two HPC clusters at Virginia Tech. A new resource manager (RM) dynamically assigns jobs to hardware platforms. Beyond this resource allocator, a cloud integrator manages jobs as-signed to different cloud resources. Four digital library (DL) services are new or significantly enhanced. These include a memoization service that has been completely rebuilt based on a new design, and extended to store previously computed results (version 1.0 had a prototype implementation). Among other things, this module improves user experience by quickly returning pre-computed results where available. Other services include the ability to add new networks and new measures; these features are now fully automated with error checking and sandbox capabilities, respectively. The incentivization service—to give proper credit to CINET contributors—was also redesigned.
3. Domain specific language software service.NetScript is a
new domain specific language (DSL) developed for CINET. We view NetScript as a software service since one of its main purposes is to compose reusable workflows that combine or pipeline applications (through their inputs and outputs) to produce results that no single application can provide. It offers a common platform for programming across different graph libraries (e.g., GaLib, NetworkX, SNAP).
4. New and enhanced applications. Features of two
exist-ing applications (GaLib and GDSC) have been significantly extended. For example, the number of parallel algorithms in Table I—all of which were built for incorporation into GaLib— has increased four-fold. These parallel implementations are based on new state-of-the-art algorithms (e.g., [12, 11]). The numbers of networks, algorithms, and graph generators within Granite have also increased, as indicated in Table I. The numbers of graph generators and dynamics models in GDSC have both more than doubled, and now any update scheme is possible. These extensions, when combined, dramatically increase the range of network dynamics that can be evaluated. Moreover, a job submission system, data persistence, and auto-regression testing are among its new capabilities. We have integrated new algorithms from NetworkX. The SNAP graph analysis application [25] is newly integrated into CINET. Gephi [14] has also been integrated for graph visualization.
Reviewer use. To facilitate the review process, we are
providing a login account for Granite to any interested reviewer. Both the username and password of the ac-count are demo1234. Granite can be accessed via web-sitehttp://cinet.vbi.vt.eduand following the menu
itemTools → Granite.
II. SYSTEMOVERVIEW
Computing Resources
Software
NetScript
Hardware Digital Library
Metadata Memoization Incentivization
...
CINET Web Apps/User Interfaces
Granite
Structural Analysis Visualization
Workflow Add new network Add new measure
GDSC
Dynamical Analysis Visualization
Blackboard
Resource Manager
Resource Allocator
Cloud Integrator
Networks Measures Visualization Results
Analysis Results
Storage
HPC Clusters
VT Cluster 1 VT Cluster 2
Cloud
FutureGrid
GaLib NetworkX
[image:3.612.57.292.53.337.2]SNAP Gephi GDSC
Fig. 1: Primary CINET system components.
are not merely data objects, but rather are Java objects that contain run parameters and methods that describe workflows.
The web applications, Granite and GDSCalc (or GDSC), are distinct entities, each with its own UI. A user provides information through the UI and submits a job. The submission process generates a job request in a format recognized by the cyberinfrastructure. This request is then put on the blackboard. Metadata may be obtained from the DL. Jobs are executed by (software) applications (e.g., NetworkX, GaLib, SNAP, GDSC, Gephi) that reside on computing resources as shown in Fig. 1. Decisions regarding what applications and hardware to use are made by the RM. Data may be retrieved from storage, guided by the RM. Results are put in storage and DL metadata may be updated. Results are returned to the web application through the blackboard.
III. APPLICATIONS
In this section, we survey Granite applications and GDSC, with a pronounced emphasis on the former.
A. Granite
1) Granite User Interface: We present a series of UI screens from Granite in order to illustrate the web-application’s capabilities and its usability features. Fig. 2 provides a sum-mary of all of a user’s analyses (the screen is cropped for space reasons). For each analysis, its name is given, along with the network(s) and measure(s) used, time of last update, and current status. At the top of the screen are the Granite first-order capabilities:Network Analysis,Network Generation,
Networks, and Measures. The Archivecreates a backup of a user’s data, andAdmin is for administrator functions.
5/14/2014 GRANITE
http://cinet.vbi.vt.edu/granite/granite.html#allAnalysis 1/1
|Visit CINET
Network Analysis Network Generators Networks Measures Archive Admin
Network Dynamics and Simulation Science Laboratory (NDSSL) Virginia Bioinformatics Institute, Virginia Tech Blacksburg, Virginia
Version: 0.18.6
Network Analysis
Copyright © GRANITE System 2013. All rights reserved.
| Help Centre Administrator
Search Analysis
Display 10 records
BFS Miami Contact Net… BFS Tree Wed May 14 2014 20:33:3… IN-PROGRESS Kill Hide
Betweenness Cent… Dolphins' Social Ne… Betweenness Cent… Wed May 14 2014 20:32:3… COMPLETED View Report Hide
k-Core Karate network k-Core Wed May 14 2014 20:31:5… COMPLETED View Report Hide
d Max Planck - Flickr … Component Size Di… Mon May 05 2014 20:54:5… COMPLETED View Report Hide
Testing non-pre co… Artificial graph wit… Center Mon May 05 2014 07:31:1… EXPIRED Hide
Test Failed Jobs Airlines Bridge Edges Mon May 05 2014 04:30:1… COMPLETED View Report Hide
Airlines1 Airlines Cc Distribution - St… Mon May 05 2014 02:26:3… FAILED Completed W… Hide
k core1 Astrophysics Collab… k-Core Mon May 05 2014 02:26:0… FAILED Completed W… Hide
Test2_5may Max Planck - Flickr … Component Size Di… Mon May 05 2014 02:04:5… FAILED Completed W… Hide
Test1_5may Yeast PPI network Remove high-degr… Mon May 05 2014 02:03:3… FAILED Completed W… Hide
1-10 of 151
[image:3.612.313.579.86.203.2]Analysis Networks Measures Updated On Status Actions Display
Fig. 2: Cropped view of Granite UI showing records of network analyses for theAdminuser. A user can submit a new network analysis request by clicking the+New Analysisbutton at the right and then selecting a set of networks and network algorithms, and providing input parameters for the algorithms.
5/15/2014 GRANITE
http://cinet.vbi.vt.edu/granite/granite.html#analysis 1/2
|Visit CINET
Network Analysis Network Generators Networks Measures Archive Admin
Back New Analysis
Selected Networks: Airlines California Web Graph Miami Contact Network
SAVE CANCEL
Details Visualization
NO YES YES No 2092147 52698100 Contact NDSSL Miami Contact Network
Directed Weighted Labeled Connected No. Of Nodes No. Of Edges Type Contributor Url AddedBy Description
Miami is a synthetic, but realistic, social contact network for Miami city. Each node is a person from Miami city, and there is an edge between two persons if they 'physically' interact with each other within a 24 hour period.
Network Dynamics and Simulation Science Laboratory (NDSSL) Virginia Bioinformatics Institute, Virginia Tech
1) Enter Analysis Details & Add Network (s)
Analysis name *
Analysis 1
Networks
2) Add Measure
| Help Centre Administrator
Search Networks
Display 10 records
Israel-V3-ver2
Karate network
Large Network (PA model) with a large averag…
Large Network (PA model) with a moderate av…
Les Miserables
LiveJournal Social Network
Max Planck - Flickr Social Network
Miami Chung-Lu
Miami Contact Network
Miami G(n,p)
71-80 of 115
[image:3.612.316.572.295.476.2]Select NETWORKS
Fig. 3: Multiple graph selections (see top of cropped screen). Current selection is a Miami contact network.
5/15/2014 GRANITE
http://cinet.vbi.vt.edu/granite/granite.html#analysis 1/2
|Visit CINET
Network Analysis Network Generators Networks Measures Archive Admin
Back New Analysis
Selected Measures: Articulation Point PageRank Radius Minimum Spanning Tree
Previous Analyze SAVE CANCEL
Details Parameters
Submit Minimum Spanning Tree
Input Graph: Source Node: 20
Output File: output.out
Network Dynamics and Simulation Science Laboratory (NDSSL) Virginia Bioinformatics Institute, Virginia Tech Blacksburg, Virginia
Version: 0.18.6
1) Enter Analysis Details & Add Network (s)
2) Add Measure
Measures
| Help Centre Administrator
Search Measures
Display 10 records
Largest Clique Containing A Given Node
Likelihood
Maximal clique containing a given node
Maximum Flow
Minimum Cut
Minimum Spanning Tree
Number Of Common Neighbors
Number Of Connected Component
Out-Degree Centrality
PageRank
51-60 of 70
[image:4.612.47.305.53.234.2]Select MEASURES
Fig. 4: Multiple measure selections. Current selection is mini-mum spanning tree, and to the right, the root node of the MST is specified. The screen capture is cropped at top and bottom.
measures have been selected. This figure and the previous one illustrate how one network analysis job can consist of multiple measures executed on multiple graphs.
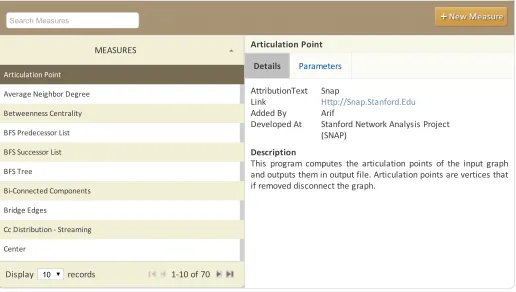
To add a new measure, a user clicks the Measuresbutton shown at the top of Fig. 2. The user is taken to the screen shown in Fig. 5. Existing graph measures are displayed and a new one can be added by clicking the +New Measurebutton. Another screen (not shown) requests inputs from the user, including the software to be uploaded. Analogous procedures exist for adding networks.
5/15/2014 GRANITE
http://cinet.vbi.vt.edu/granite/granite.html#measure 1/1
|Visit CINET
Network Analysis Network Generators Networks Measures Archive Admin
Details Parameters
Snap
Http://Snap.Stanford.Edu
Arif
Stanford Network Analysis Project (SNAP)
Articulation Point
AttributionText Link Added By Developed At
Description
This program computes the articulation points of the input graph and outputs them in output file. Articulation points are vertices that if removed disconnect the graph.
Network Dynamics and Simulation Science Laboratory (NDSSL) Virginia Bioinformatics Institute, Virginia Tech Blacksburg, Virginia
Version: 0.18.6
Measures
Copyright © GRANITE System 2013. All rights reserved.
| Help Centre Administrator
Search Measures
Display 10 records
Articulation Point
Average Neighbor Degree
Betweenness Centrality
BFS Predecessor List
BFS Successor List
BFS Tree
Bi-Connected Components
Bridge Edges
Cc Distribution - Streaming
Center
1-10 of 70
[image:4.612.321.564.155.262.2]MEASURES
Fig. 5: This screen shows a partial list of graph measures, with the articulation point graph measure from SNAP highlighted. To add a new measure to CINET, click the +New Measure button.
2) Granite Compute Engines: Granite contains three graph applications: GaLib, NetworkX [20] and SNAP [25]. SNAP was added in CINET 2.0. Table II summarizes the types of modules (algorithms) implemented and the numbers of modules implemented per application. Table III provides anal-ogous data for the networks in Granite. Fig. 6 shows how the numbers of networks and modules in CINET have grown over
[image:4.612.322.567.311.449.2]time. Fig. 7 illustrates the speedup (scalability) of the parallel triangle counting algorithms [12] for large graphs. The degree distribution of a 1-billion node Preferential Attachment graph generated by a parallel algorithm [11] is shown in Fig. 8.
TABLE II: Statistics of available network modules (algorithms and generators) in CINET
(a) Different types of network mod-ules
Type Modules
Centrality 32 Shortest path 19 Connectivity 11 Subgraph count 13 Net. generator 28
Others 41
Total 144
(b) Network modules adapted from different graph libraries
Graph library Modules
GaLib 71
NetworkX [20] 62
SNAP [25] 11
Total 144
TABLE III: Statistics of available networks in CINET
(a) Different types of networks
Type Number
Social 21
Co-appearance 6 Collaboration 19 Transportation 9
Web 5
Biological 2 Autonomous 20 Infrastructure 5
Others 25
Total 112
(b) Networks collected from different sources
Source Networks
SNAP [25] 41
Pajek [15] 9
M. Newman [28] 10 SocioPatterns [9] 11
NDSSL [13] 20
ITZ [23] 5
Gephi [14] 2
Others 14
Total 112
B. GDS Calculator
Agraph dynamical system(GDS) is a discrete dynamical
system consisting of four elements: (i) a graph G where vertices are agents and an edge from vertexva tovb meansva
influences the dynamics ofvb;(ii)a setF ofvertex functions
fa, wherefadescribes howvaupdates its state;(iii)anupdate
schemeW that specifies how the vertex functions are ordered;
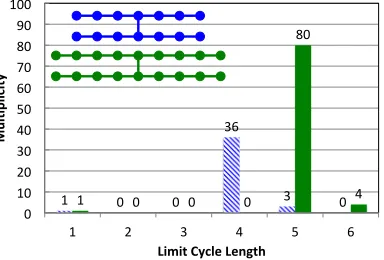
(iv) a state set K for vertices. GDSC provides users with an interface to specify different combinations of these four inputs, and computes, among other things, the long-term cycle structure of the dynamical system. Informally, since G and K are both of finite size, deterministic GDSs will eventually repeat system states (i.e., the states of all vertices in a graph), giving rise to limit cycles of repeating states. Limit cycles are of interest because they represent the GDS’s long-term dynamics.
Example 1: We evaluate the effects of graph structure on the sizes of limit cycles and their multiplicities (i.e., the num-ber of cycles of a given size). We evaluate two trees, shown in blue and green in Fig. 9. We useK={0,1}and abithreshold GDS, where each vertex is assigned (k01, k10) = (1,3). This
[image:4.612.47.305.444.590.2]● ● ● ● ● 0 50 100 150
2010 2011 2012 2013 2014
Year
Number
s
● Modules
[image:5.612.287.556.56.164.2]Networks
Fig. 6: Collection of networks and mod-ules (network algorithms and genera-tors) growing over time. SNAP [25] is a brand new addition to graph libraries.
0 20 40 60 80
0 100 200 300
Number of Processors
Speedup F actor PA−100M PA−25M PA−50M PA−5M
Fig. 7: Parallel algorithms in GaLib are highly scalable, e.g., parallel trian-gle counting [12] algorithm shows good scalability for networks with billions of edges. Here, P A−nM are Preferen-tial Attachment networks withnmillion nodes and an average degree of 50.
● ● ● ● ● ● ●● ●●●●●● ●●●●● ●●● ●●●●●●●●● ●● ●●●●●●●●●●● ● ●●●●● ● ●●●●●● ● ●●●● ● ● ● ● ● ● ● ●●●●●● ●●●● ● ● ●● ● ● ●● ● ●●● ● ● ● ● ● ●●●● ●● ● ● ● ● ● ● ● ● ● ●●● ● ● ● ● ● ●●●● ● ● ● ● ●●●●● ● ●● ● ● ● ● ● ● ● ● ● ●●●●●●●● ●● ● ● ● ● ● ● ● ● ● ● ● ● ● ● ●●● ● ● ●●●●●●●●●●● ● ●●●●●●●●●●●●●●●●●●●●●●● ●●● ● 100 101 102 103 104 105
100 101 102 103
Degree
[image:5.612.58.218.56.161.2]Number of Nodes
Fig. 8: Degree distribution of a large Preferential Attachment graph with 1 billion nodes and 4 billion edges. Par-allel algorithm for Preferential Attach-ment model [11] in GaLib was used to generate this graph.
to state 0 if less than three vertices (including itself) are in state 1. We use sequential update where the vertex functions are executed sequentially in the order (v1, v2, . . . , vn). As
the tree grows, the maximum limit cycle size increases: the maximum limit cycle for the blue graph is 5, while that for the green (larger) graph is 6. In both cases, the largest number of limit cycles occurs for a cycle length that is less than maximum.
1 0 0 36
3 0 1 0 0 0
80
4 0
10 20 30 40 50 60 70 80 90 100
1 2 3 4 5 6
Mu l$ pl ic ity
[image:5.612.78.270.386.516.2]Limit Cycle Length
Fig. 9: Limit cycle lengths and their multiplicities for the graphs (blue and green) in the figure; see Example 1.
IV. NETSCRIPT: A DOMAINSPECIFICLANGUAGE FOR
NETWORKANALYTICS
NetScript [30] is an embedded DSL written in Python. We chose Python for its short learning curve and extension modules for integration with different programming languages. As a result, any existing graph library or tool can be plugged into NetScript and can be used through a high level interface. NetScript currently works with GaLib and NetworkX, and Matplotlib [5], a Python 2D plotting library, as a visualization tool. It provides a simple computational interface for domain experts to specify workflow of cross library graph modules and to visualize and plot the networks and outputs, respectively. It functions as a meta-graph library providing a superset of graph modules and visualization features from different libraries.
It offers data structures for collections, such as Graph, Edge, Node, Property (weight, label, etc.), overloaded oper-ators and methods for the data structures, and functions for different graph modules. Moreover, it supports many atomic operations, e.g., add or remove nodes and edges, on Graphs and compute XOR, Union, etc., among them. NetScript maps the functions to graph modules of different libraries and hides all the complexities, such as converting between network formats, from users. It further supports error handling across the libraries.
A workflow is the execution of a multi-step network analysis, i.e., a sequence of computational modules, where the output of one module can be fed as an input to the next module. A set of predefined workflows has been integrated into Granite. Users can run such workflows in one network analysis from the Granite UI. Moreover, users can design their own workflows using NetScript. TheAdd New Measureservice further allows users to add these workflows to Granite and use them for analyzing networks through the Granite UI. The following is an example of a workflow illustrating the utility of NetScript. Example 2: Generate a set of (say 10) Erd˝os-R´enyi ran-dom graphs with the number of nodesn= 1000, probability of picking each possible edgep= 0.1 (i.e., average degree 100), and a specific property (e.g., diameter ≥4). Both NetworkX and GaLib have Erd˝os-R´enyi graph generators but neither of them supports graph generation with user defined properties. We provide a code snippet below for generating an Erd˝os-R´enyi graph with the specified property using NetScript.
1 G = generateGraphNP(1000, 0.1) 2 while diameter(G) < 4:
3 G = shuffle(G, 0.2)
The first line uses a NetworkX functiongenerateGraphNP
graph conversion between line 2 and 3 as shown in Fig. 10. NetScript hides these low-level concerns (graph conversion and data structure passing) from the users and makes it easy to interleave functionalities of different graph libraries from a simple interface.
NetworkX (Python Lib.)
NetworkX (Python Lib.)
Graph conversion & data structure
passing
GaLib (C++ Lib.)
[image:6.612.52.298.122.173.2]1 2 3
Fig. 10: Use of different graph libraries in the three-line code snippet given in Example 2. NetScript provides a user-friendly high level interface by hiding the complexities of graph conversion and data structure passing across different graph libraries.
V. VISUALIZATION
Our network visualization tool is a newly developed and integrated service that can give useful insights into a network by highlighting important nodes, edges and communities in a graph or a subgraph. The primary features and benefits of visualization are: (i) it provides eight layout algorithms from the literature such as Force Atlas, Yifan Hu and Fruchterman Reingold; (ii) it offers feature-based organization, i.e., the node sizes can be proportional to their degrees, betweenness cen-trality and pagerank values, and thus helps network mining by finding influential nodes and links; (iii) it allows for finding and coloring different communities by using community detection algorithms from the literature; (iv) it can visualize node and edge attributes; (v) it supports interactive visualizations, e.g., zoom in, zoom out and focusing on neighbors of a selected node; (vi) it offers visualization of subgraphs that is very use-ful, especially for massive networks; and (vii) it has a download option in different formats (e.g., pdf, jpg). Some visualizations of the Miami social contact [13] and Amazon co-purchase [7] networks are shown in Figs. 11 and 12 respectively. A high
Fig. 11: Visualization of the communities in a 1000 node subgraph of Miami social contact network [13].
Fig. 12: Visualization of an Amazon co-purchase net-work [7].
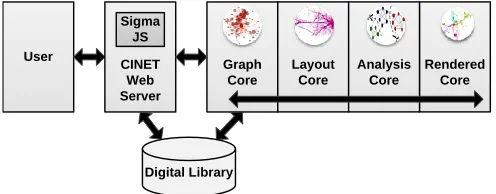
level overview of the functionality of visualization service is depicted in Fig. 13. We have used SigmaJS, a JavaScript library for rendering a (graph) object within a UI at the front end and the Gephi library [14] in the back end. Gephi is an interactive visualization and exploration platform for networks. Our work then became primarily one of integration. We have chosen
Gephi because it is open source, modular and easily extensible through plugins. It also offers many visualization features. If a user requests a visualization of a network, the network is converted into gexf format, an XML representation, that allows for dynamically adding multiple attributes to nodes and edges. Then, user-specified layout algorithms determine object locations. Other measures (betweenness, pagerank, degree, etc.) are computed and applied to fix the size and color of the nodes and edges. Finally, the rendered graph is visualized to the user through a web rendering script after storing it in cooperation with the DL. The user interface shows a static view of the visualization by default. Clicking on the static visualization pops up a new window providing a detailed and interactive visualization. All visualizations are stored along with their input parameters, thus allowing users to access and download any previous visualization. This is another feature facilitated by the memoization service of the DL (described in the next section).
User
CINET Web Server Sigma JS
Graph Core
Rendered Core Layout
Core
Analysis Core
Digital Library
Fig. 13: Functionality of the visualization service. Our work involved integrating Gephi, SigmaJS with the DL and other parts of CINET.
VI. CYBERINFRASTRUCTURE
In this section, we discuss the new and upgraded compo-nents of the cyberinfrastructure, i.e., compute resources, RM, and DL services.
A. Compute Resources
FutureGrid [32] is a cloud infrastructure comprised of geographically distributed heterogeneous HPC clusters. Fu-tureGrid has collectively more than 5000 processing cores, and has been recently integrated with CINET.
B. Resource Manager
The RM [16] ensures compute resource availability and sharing, data reliability and transfer, security, assignment of jobs to specific resources, and reliability of assigned jobs. RM handles the complexities associated with shared and distributed memory for parallel algorithms to run on heterogeneous re-sources. It performs these tasks transparently; no user input is required. Currently, jobs are assigned to one of the two VT clusters or to FutureGrid resources. RM has the following two major components.
1. Resource Allocator (RA). This component allocates
[image:6.612.321.569.264.361.2] [image:6.612.66.309.487.591.2]2. Cloud Integrator (CI). This component is deployed in a cloud infrastructure to achieve synchronization between job submission and resource availability and to optimize resource consumption. In a shared cloud environment, research groups act as tenants with restricted permissions and rated resource consumption. This motivated the adoption of a self-initiating and self-sustainable cluster of virtual machines (VMs) man-aged by the portable batch system (PBS)-based Torque Re-source Manager. The PBS cluster hosts the execution brokers and establishes a Master-Worker relationship based on the dynamic compute environment with VM’s as nodes. So we introduce the modified concept of a VM-aware PBS cluster.
Salient features of VM-aware PBS cluster are as follows. (i) Job Isolation:VM environment provides a sandbox feature for any malicious codes uploaded by users. (ii)Optimized resource consumption: The suite builds a wrapper over the Torque and Maui scheduler to offer a stable and light-weight PBS. RM constantly monitors system health and efficiently spins up/down VMs as per PBS queue weight. (iii) Data Reliability and Transfer: The data is procured by worker VM’s from an internal NFS server hosting persistent data containers (logical volumes). Data movement is restricted to an intranet except in the transfer of analysis results. (iv) Portability and Self-sustainability: CI provides platform independent deployment and can be exported to supported cloud infrastructures (Open-stack/Eucalyptus). (v) Parallelization:It facilitates distributed and parallel execution of jobs through rule-based policies. (vi)Fault Tolerance:RM provides seamless fail-over multiple clusters (or cloud domains). Pluggable resources make the system more flexible and scalable.
C. Digital Library and Services
The DL of CINET acts as a central repository of informa-tion and uses the 5S formal framework [19]. The DL supports modeling and simulation by retrieving and archiving metadata for networks, network analysis algorithms, generators, visu-alizations, analyses results, users and by offering various DL services.Metadata Serviceis the core DL service that supports execution of network analyses jobs by providing metadata through the DL broker (see [10] for detail). The digital library has been completely redesigned for improved usability and scalability of the system. We confine our discussion to four recently integrated or significantly enhanced services.
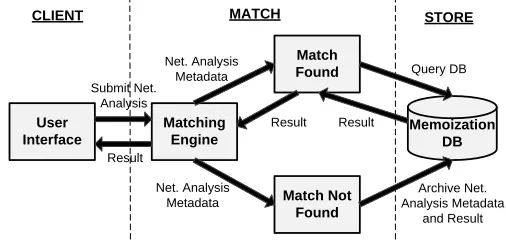
1. Memoization Service [21]. If a network analysis job is
requested for the first time by any user, this service captures and archives the input parameters, metadata and output files generated by the system. If the same job is requested again by any user, the memoization service retrieves and provides the archived results to the user instead of recomputing the results. This is illustrated in Fig. 14. Thus, memoization significantly enhances the user experience by indexing, archiving, preserv-ing, and reusing network analysis results, yielding reduced turn-around-time to provide the user with results. Since this service has been integrated, about 63% (542 out of 856) of the network analyses have used the memoization service to retrieve archived results without recomputing, thus saving around 1.8 GB of space. As CINET grows, this benefit is expected to increase.
2. Incentivization Service.This service captures and archives
contributors of networks, algorithms, generators, compute
re-User Interface
Matching Engine
Match Found
Match Not Found
Memoization DB Net. Analysis
Metadata
Result
Archive Net. Analysis Metadata
and Result Query DB Submit Net.
Analysis
Result
CLIENT MATCH STORE
Result
[image:7.612.321.574.46.167.2]Net. Analysis Metadata
Fig. 14: Memoization framework.
sources and visualization features in the DL. CINET uses this information to attribute methods and data in UI screens and in output artifacts to ensure that contributors are properly recognized.
3. Add New Network Service. This service allows users
to add new networks to Granite. An uploaded network is automatically validated through semantic and syntactic checks. Metadata are specified by the user for a valid network. Users have the choice of keeping the network visibility as private (visible only to the user who contributed) or public (visible to all users).
4. Add New Measure Service. Users can add new measures
(algorithms) with the help of a system administrator. This process is fully automated where a new measure is added with detailed information of input and output parameters. Users are prompted to provide valid range and type of input parameters, that are later used in determining validity of user inputs for network analysis requests. Moreover, users just provide the graph library name and are insulated from the complexities of cross platform executions. When a new measure is added to Granite, RM executes the binaries (executables) in a VM to ensure about the safety of the binary. Only safe-to-run (certified by RM) measures are added to Granite. Similar services exist for adding new network generators as well. These fully automated services make the system self-sustainable.
VII. EDUCATIONALUSE
CINET was used as the primary software tool in two network science courses in the Computer Science departments at North Carolina A&T State University (NCAT), Greensboro, NC, USA during Spring 2014 and the University at Albany— State University of New York (UAlbany), Albany, NY, during Fall 2013. Both of these courses used the book by Easley and Kleinberg as the required text [18]. CINET has been used in a few undergraduate courses at University of Maryland–College Park and in graduate and undergraduate courses at Virginia Tech (VT). University of Houston and Jackson State University will use CINET in courses in the Fall 2014.
NCAT envisions offering another course for non-computer scientists, where Granite and NetScript would be the only computational resources used. CINET was used at UAlbany in a combined graduate/undergraduate course in much the same ways as at NCAT; the course instructors collaborated in developing curricula. The UAlbany course also included a course project that used CINET. The class at UAlabany was well received and the students found CINET easy to use, and extremely useful in understanding the concepts. Three students enrolled in a subsequent independent study course to explore additional topics in Network Science. In a graduate course at VT in Spring 2014 on digital libraries, a homework assignment focused on the DL aspects of CINET. In another graduate course at VT on multimedia, CINET was used for both classroom instruction and homework assignments.
VIII. RELATEDWORK
We have compared CINET with several existing graph algorithm libraries and dynamic simulation tools, such as NetworkX [20], SNAP [25], NodeXL [6], Pajek [15], Network Workbench [29], Pegasus [8] and DVD [31] in our previous paper [10] and we do not repeat them here. Many libraries and tools have been developed in the recent years. Among them, Giraph [1] is a distributed graph processing platform that is built on top of Hadoop’s MapReduce implementation. Giraph is the open source counterpart to Pregel [27], a graph pro-cessing architecture developed by Google. The GraphLab [26] project develops a parallel computation framework tailored to machine learning and data mining. Twitter has an open source big graph processing library, Cassovary [2], for the Java Virtual Machine. It can analyze graphs that are up to billions of edges in size. Green-Marl [22] is a DSL for parallel graph algorithms that allows users to describe algorithms in intuitive ways. The Green-Marl compiler translates a given DSL program into an equivalent, parallelized, high-performing program in C++. JUNG [4] is a software library providing a visualization framework and a number of algorithms from graph theory. Gephi [14] is an open source interactive visualization platform for networks. It also offers some networks and a few network algorithms.
Each existing graph library or tool focuses on a few specific features, such as networks, static analysis, dynamic analy-sis, visualization and workflows. Pegasus, Giraph, GraphLab, Green-Marl and CINET have platforms for parallel algorithms. Network Workbench, Pegasus and CINET provide web portals for network analysis with compute resources in the back-end. However, none of the existing tools provide a superset of features, such as a rich set of networks, network algorithms and generators, dynamic simulation engine, visualization, ap-proximate and parallel algorithms, workflows, domain specific language, HPC resources, resource manager, and contributor-based content that support education and collaborative research through a web portal, as does CINET. In addition, various integrating services (add new networks, network algorithms, generators and memoization) make CINET self-manageable andself-sustainablein the long run, which is a novel feature. The system continues to grow in terms of numbers of networks, algorithms, services, and computing resources.
IX. CONCLUSION
CINET 2.0 has been described in this paper. It is a signifi-cant step forward from CINET 1.0 [10], with new software and hardware capabilities: resource manager, NetScript, and cloud computing resources. Others have been literally reworked from scratch for better usability, scalability, and enhanced feature sets: the UIs for both Granite and GDSC, and four services of the DL. The latter includes fully automated services for adding new networks and measures, which are critical for a self-sustainable and self-manageable CINET. By the end of year 2014, the number of networks and methods will grow to over 200 and 150, respectively. Also, we will have at least a prototype version of InterSim [24] operational, which will enable agent-based simulations, and DL services will be expanded. We have approached NSF for XSEDE resources and Argonne National Laboratory’s compute resources will also be integrated through the RM. CINET can also be expanded to a general data analytic library to address the analysis of big data from diverse areas such as computational biology, life science, business and finance.
REFERENCES
[1] “Apache Giraph,” https://giraph.apache.org/, [Online].
[2] “Cassovary,” https://blog.twitter.com/2012/cassovary-big-graph-processing-library. [3] “CINET website,” http://cinet.vbi.vt.edu/, [Online].
[4] “JUNG,” http://jung.sourceforge.net/, [Online]. [5] “Matplotlib,” http://matplotlib.org/, [Online]. [6] “NodeXL,” http://nodexl.codeplex.com/, [Online]. [7] “Orgnet LLC,” http://www.orgnet.com/, [Online].
[8] “Project pegasus,” http://www.cs.cmu.edu/∼pegasus/, [Online].
[9] “SocioPatterns,” http://www.sociopatterns.org/datasets/, [Online].
[10] S. Abdelhamid et al., “Cinet: A cyberinfrastructure for network science,” in
e-Science, Oct 2012, pp. 1–8.
[11] M. Alamet al., “Distributed-memory parallel algorithms for generating massive
scale-free networks using preferential attachment model,” inSC ’13, pp. 91:1–12.
[12] S. Arifuzzaman, M. Khan, and M. Marathe, “Patric: A parallel algorithm for
counting triangles in massive networks,” inCIKM, 2013, pp. 529–538.
[13] C. L. Barrett et al., “Generation and analysis of large synthetic social contact
networks,” inWinter Simulation Conference, 2009.
[14] M. Bastian, S. Heymann, and M. Jacomy, “Gephi: An open source software for exploring and manipulating networks,” 2009.
[15] V. Batagelj and A. Mrvar, “ Pajek - Program for Large Network Analysis,”
Connections, vol. 21, no. 2, pp. 47–57, 1998.
[16] T. Bhattacharjeeet al., “VM-aware PBS Cluster: Resource Manager to Integrate
Cloud Infrastructures with CINET,” NDSSL, Virginia Tech, May 2014, nDSSL Technical Report Number: 14-054.
[17] Committee on Network Science for Future Army Applications, National Research
Council,Network Science. The National Academies Press, 2005, [Online].
[18] D. Easley and J. Kleinberg,Networks, Crowds and Markets: Reasoning About A
Highly Connected World. New York, NY: Cambridge University Press, 2010.
[19] E. Fox, M. Goncalves, and R. Shen,Theoretical Foundations for Digital Libraries:
The 5S (Societies, Scenarios, Spaces, Structures, Streams) Approach. San Francisco: Morgan & Claypool Publishers, July 2012.
[20] A. A. Hagberget al., “Exploring network structure, dynamics, and function using
NetworkX,” inSciPy, Pasadena, CA, USA, Aug. 2008, pp. 11–15.
[21] S. M. S. Hasanet al., “An extensible digital library service to support network
science,” inICCS, 2013, pp. 419–428.
[22] S. Hong, H. Chafi, E. Sedlar, and K. Olukotun, “Green-marl: A dsl for easy and
efficient graph analysis,” inASPLOS XVII. NY, USA: ACM, 2012, pp. 349–362.
[23] S. Knightet al., “The internet topology zoo,”Selected Areas in Communications,
IEEE Journal on, vol. 29, no. 9, pp. 1765–1775, October 2011.
[24] C. Kuhlman et al., “A General-Purpose Graph Dynamical System Modeling
Framework,” inProceedings of the 2011 Winter Simulation Conference (WSC 2011).
[25] J. Leskovec, “Stanford Network Analysis Project,” http://snap.stanford.edu/.
[26] Y. Lowet al., “Distributed graphlab: A framework for machine learning and data
mining in the cloud,”Proc. VLDB Endow., vol. 5, no. 8, pp. 716–727, Apr. 2012.
[27] G. Malewiczet al., “Pregel: A system for large-scale graph processing,” inACM
SIGMOD 2010, NY, USA, pp. 135–146.
[28] M. Newman, “Network data,” http://www-personal.umich.edu/∼mejn/netdata/.
[29] NWB Team, “Network Workbench Tool. Indiana University, Northeastern Univer-sity, and University of Michigan,” http://nwb.cns.iu.edu, 2006, [Online].
[30] Z. Shamset al., “NetScript: A Domain Specific Language for Network Analytics,”
NDSSL, Virginia Tech, May 2014, nDSSL Technical Report Number: 14-053.
[31] H. Vastaniet al., “Discrete Visualizer of Dynamics (DVD) v1.0,” http://dvd.vbi.vt.
edu/cgi-bin/git/dvd.pl, 2012, [Online].
[32] G. von Laszewski et al., “Design of the futuregrid experiment management