International Journal of Innovative Technology and Exploring Engineering (IJITEE) ISSN: 2278-3075, Volume-9 Issue-2, December 2019
Performance Evolution of Different Machine
Learning Algorithms for Prediction of Liver
Disease
Muktevi Srivenkatesh
Abstract: Liver malady is an overall medical issue that is related with different inconveniences and high mortality. It is of basic significance that illness be recognized before such huge numbers of these lives can be spared. The phases of liver ailment are a significant viewpoint for focused treatment. It is a terribly troublesome undertaking for therapeutic analysts to foresee the disease inside the beginning times on account of sensitive manifestations. Generally the side effects become evident once it's past the point of no return. To beat this issue, we have liver infection forecast. Liver sickness might be distinguished with incalculable order systems, and these have been classified the utilization forecast of a number highlights and classifier blends. In this investigation, we applied five sort of classifiers that is Naïve Bayes, logistic regression, support vector machines, Random Forest, K Nearest Neighbour for the examination of liver malady. The classification exhibitions are assessed with 5 distinctive by and large execution measurements, i.e., precision, kappa, Mean absolute error (MAE), Root mean square error (RMSE), and F measures. The objective of this query work is to foresee liver infection with different machine learning and pick most efficient algorithm.
Keywords: Liver Disease, Machine Learning Algorithms, Performance Evaluators, toxins
I. INTRODUCTION
Classification is very important feature of data mining .Classification is the process of finding a model (or function) that describes and distinguishes data classes or concepts. The model is derived based on the analysis of a set of training liver data (i.e., data objects for which the class labels are known).
The model is used to predict the class label of objects for which the class label that is having liver disease or not having liver disease that is unknown.
Machine learning investigates how computers can learn (or improve their performance) based on liver data. A main research area is for computer programs to automatically learn to recognize complex patterns and make intelligent decisions based on liver data.
Revised Manuscript Received on December 05, 2019.
Dr. M.Srivenkatesh, Associate Professor, Department of Computer Science, GITAM Deemed to be University, Visakhapatnam, Andhra Pradesh, India
Supervised learning is basically a synonym for classification. The supervision in the learning comes from the labeled examples in the liver training data set.
Liver disease is one of the most "death-dealing disease on the planet. The fundamental driver of liver harm is Fatty liver, Liver Fibrosis, Cirrhosis, hepatitis and diseases [1]. In the beginning times of liver" illness, it is exceptionally hard to identify even though liver tissue has already been harmed. It requires numerous specialists to analyse the damage. [2] This can contort pharmaceutical medications, so early finding is essential to spare the patient.
There are four types of liver diseases.
A. Inflammation
One of the main functions of liver is to detoxify your blood of toxins found in the blood of toxins in the food we eat and the products we use .The first sign of liver damage is inflammation .Inflammation in the liver is a sign of your immune system responding to foreign substances such as too much toxins .The can cause our liver to enlarge.
They are many causes for inflammation .Excess fat in the liver, too much toxins or a viral infection in the liver can make liver tender and swell up .These are some conditions might cause inflammation in the liver non-alcoholic fatty liver and liver hepatitis including viral hepatitis
B. Fibrosis
Scar tissue will not do the work that healthy liver tissue can. Moreover, connective tissue will keep blood from flowing through your liver. As a lot of connective tissue builds up, your liver might not work likewise because it once did. Or, the health of your liver should work more durable to create up for the scarred part.
If your disease is diagnosed and treated with success at this stage, there‘s still an opportunity that your liver will heal itself over time.
Toxins might build up in your brain, inflicting issues with concentration, memory, sleeping, or different mental functions.
Once you‘ve been diagnosed with liver disease, treatment can concentrate on keeping your condition from obtaining worse. It should be potential to prevent or slow the liver harm .It‘s necessary to safeguard the healthy liver tissue you‘ve got left.
C Cirrhosis
As cirrhosis of the liver becomes worse, the liver isn‘t treated, and the liver will fail and cannot be ready to work or in the least.
Cirrhosis will cause variety of complications, together with liver disease. In some folks, the symptoms of cirrhosis of the liver could also be the primary signs of disease.
D. Liver Cancer
Cancer that starts within the liver is termed primary cancer of the liver. Cirrhosis of the liver and hepatitis B are leading risk factors for primary cancer of the liver. However cancer can develop within the liver at any stage in the progression of disease.
The remaining of the research discussion is organized as follows: Section II briefs Literature, Section III describes brief description of selected algorithms Section IV describes Patient Data Set and attributes, Section V discusses Proposed Technique Section VI describes analysis of various algorithms Section VII Describes Performance measure of classification Section VIII briefs discussion and evaluated Results, and Section IX determines the Conclusion of the research work and Section X describes References
II. LITERATURE SURVEY
Chieh-ChenWu et.al [3] has predicted liver disease using machine learning algorithms that could assist physicians in classifying high risk patients and make a novel diagnosis
Joel Jacob1 et.al [4] aims to compare the classification algorithms based on their performance factors. To serve the medicinal community for the diagnosis of liver disease among patients, a graphical user interface has developed using python. The GUI can be readily utilized by doctors and medical practitioners as a screening tool for the liver disease.
V.V. Ramalingam , A.Pandian, R. Ragavendran[5] has given an overview on relative survey on machine learning techniques that has been used on various liver disease datasets.
Nazmun Nahar, Ferdous Ara [6] has calculated the performance of various decision tree techniques and compare their performance. They have used decision tree techniques which includes J48, LMT, Random Forest, Random tree, REPTree, Decision Stump, and Hoeffding Tree. They analysis proves that Decision Stump provides the highest accuracy than other techniques.
Dr. S. Vijayarani, S.Dhayanand [7] has predicted liver diseases using classification algorithms. Their work includes Naïve Bayes and support vector machine (SVM). These classifier algorithms are compared based on the performance factors i.e. classification accuracy and execution time. From the experimental results it is observed that the SVM is a better classifier for predict the liver diseases.
Shambel Kefelegn, Pooja Kamat[8] has discussed and performed by using different data mining classification algorithm to get better result compared with the earlier liver diseases prediction study. Their study predicted and analysing liver disorder diseases to produce better performance accuracy by comparing various data mining classification algorithm and the performance of the accuracy is measured by confusion matrices.
k. Thirunavukkarasu ; Ajay S. Singh ; Md Irfan ; Abhishek Chowdhury[9] has predicted liver disease using different classification algorithms. They used machine learning
algorithms used for this purpose of their work is Logistic Regression, K-Nearest Neighbour and Support Vector Machines. Accuracy score and confusion matrix is used to compare this classification algorithm.
Somaya Hashem et.al[10] has evaluated different machine learning techniques in prediction of advanced fibrosis by combining the serum bio-markers and clinical information to develop the classification models. The machine learning algorithms under study were able to predict advanced fibrosis in patients with HCC with AUROC ranging between 0.73 and 0.76 and accuracy between 66.3% and 84.4%.
Binish Khan1, Piyush Kumar Shukla , Manish Kumar Ahirwar [11] has discussed and analysed the parameters of various classification algorithms and compare their predictive accuracies so as to find out the best classifier for determining the liver disease. They compare various classification algorithms such as Random Forest, Logistic Regression and Separation Algorithm with an aim to identify the best technique. Based on their study, Random Forest with the highest accuracy outperformed the other algorithms and can be further utilised in the prediction of liver disease.
Sivakumar ,D Manjunath Varchagall, Ambika L GUsha S[12] has analysed human life quality attributes in forecasting the chronic liver disease with machine learning techniques. Classification methods, K-means clustering calculation and the C4.5decision tree approaches are utilized and have liver illness forecast process is demonstrated with precision of 94.36 rates in C4.5 rates with k implies grouping procedures .
Geeta Kadu,Dr.Ranjana Raut[13] has implemented Artificial Neural Network(ANN) for the classification of normal and diseased liver .In their study they have done the Multi-layered Perceptron Neural Network(MLP NNT) Machine learning has been used for the classification of three different types of Liver Diseases viz , ‗healthy liver‘, ‗fibrotic liver‘ and ‗cirrhotic liver‘. Several performance evaluation parameters have discussed.
III. MACHINE LEARNING ALGORITHMS Supervised Learning Algorithms
Supervised learning uses labeled training data to learn the mapping function that turns input variables (X) into the output variable (Y). In other words, it solves for f in the following equation:
Y = f (X)
This allows us to accurately generate outputs when given new inputs.
Classification is used to predict the outcome of a given sample when the output variable is in the form of categories. A classification model might look at the input data and try to predict labels like ―having liver disease‖ or ―not having liver disease.‖
International Journal of Innovative Technology and Exploring Engineering (IJITEE) ISSN: 2278-3075, Volume-9 Issue-2, December 2019
It means combining the predictions of multiple machine learning models that are individually weak to produce a more accurate prediction on a new sample. Bagging with Random Forests, Boosting with XGBoost — are examples of ensemble techniques.
A.K-Nearest Neighbor Algorithm
One common classification scheme based on the use of distance measures is that K nearest neighbours (KNN).This technique assumes that the entire liver training set includes not only the data in the set but also the desired classification for each item . In effect, this liver training data becomes the model .When a classification is to be made for new item, its distance from each item in the liver training must be determined .only k closest entries in the liver training set are considered further. The new item is then placed in the class that contains the most items from this set of k closest items. B. Support Vector Machines
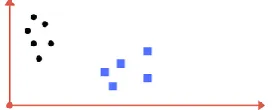
[image:3.595.92.230.337.392.2]A Support Vector Machine (SVM) is a discriminative classifier formally defined by a separating hyper plane. In other words, given labeled training data (supervised learning), the algorithm outputs an optimal hyper plane which categorizes new examples. In two dimensional space this hyper plane is a line dividing a plane in two parts where in each class lay in either side
.
Fig .1.Draw a line that separates black circles and blue squares.
We might have come back up with one thing almost like following image (image B). It fairly separates the 2categories. Any purpose that's left of line falls into black circle category and on right falls into blue sq. category. Separation of categories. That‘s what SVM will. It finds out a line/ hyper-plane (in dimensional area that separate outs classes).
C. Logistic Regression
Linear regression is not always appropriate because the data may not fit a straight line but also the straight line values can be greater than 1 and less than 0 .Thus ,they certainly cannot be used as the probability of occurrence of the target class .Under these circumstances logistic regression is used . Instead fitting data into straight line logistic regression uses logistic curve.
Simple Logistic Regression
Output = 0 or 1, Hypothesis => Z = WX + B hΘ(x) = sigmoid (Z)
Sigmoid Function
Fig 2. Sigmoid Activation Function
If ‗Z‘ goes to infinity, Y(predicted) will become 1 and if ‗Z‘ goes to negative infinity, Y(predicted) will become 0.
D. Naive Bayes
Assuming that the contribution by all attributes is independent and that each contributes equally to the classification problem, a simple classification scheme is Naïve Bayes. Bayes classification has been proposed that is based on bayes rule of conditional probability. By analysing the contribution of each independent attribute, a conditional probability is determined .A classification is made by combining the impact of different attributes have on the prediction to be made The approach is called naïve bayes because it assumes the independence between various attribute values
Step 1: Compute the ‗Prior‘ probabilities for each of the class
Step 2: Compute the probability of evidence that goes in the denominator.
Step 3: Compute the probability of likeli hood of evidences that goes in the numerator.
Step 4: Substitute all the equations into the Naive Bayes formula, to get the probability that it is a required item
The conditional probability of B given A can be computed. The Bayes Rule that we use for Naiv e Bayes, can be derived from these two notations.
P(A/B)= P(A ∩ B)/P(B) ,P(B/A)=P(A ∩ B)/P(A)
A. The Bayes Rule
The Bayes Rule is a way of going from P(X|Y), known from the training dataset, to find P(Y|X).
What happens if Y has more than 2 categories? we compute the probability of each class of Y and let the highest win.
P(X/Y)= P(X ∩ Y)/P(Y) [P( Evidence/Outcome ) (Known from Training Data)]
P(Y/X)= P(X ∩ Y)/P(X) [P(Outcome /Evidence) (To be Predicted for Test Data)]
B. The Naive Bayes
The Bayes Rule provides the formula for the probability of Y given X. But, in real-world problems, you typically have multiple X variables. When the features are independent, we can extend the Bayes Rule to what is called Naive Bayes. It is called ‗Naive‘ because of the naive assumption that the X‘s are independent of each other.
When there are multiple X variables, we simplify it by assuming the x‘s are independent so the bayes rule . P(Y=k/X) = P(X/Y=k) * P(Y=k)/ P(X) where ,k is a class of Y becomes ,Naïve Bayes P((Y=k/X1,.Xn)= P(X1/Y=k)*P(X2/Y=k)…*P(Xn/Y=k)*P(Y=k)/P(X1)* P(X2)…P(Xn)
This can be considered as Probability of
Outcome/Evidence (Posterior Probability=P(Likelihood of evidence)*Prior/ Probability of Evidence
F. Random Forest
[image:3.595.47.290.663.789.2]The fundamental thought behind this is to join different choice trees in deciding the last yield as opposed to depending on individual choice trees.
Approach:
• Pick at irregular K information focuses from the preparation set.
• Build the choice tree related with those K data points .
• Choose the number Ntree of trees you need to construct and rehash stage 1 and 2.
• For another data point, make every last one of your Ntree trees anticipate the estimation of Y for the data point, and allot the new data point the normal over the majority of the anticipated Y values.
IV. PATIENT DATA SET
[image:4.595.321.531.313.547.2]The complete of 583 cases with ten attributes was amassed for the Liver data set from kaggle. The attribute ―diagnosis‖ described as the measurable are with free sure imply two means person with liver disease and one mean that person with no longer liver disease .Table I suggests the attributes values of liver disease data set .The data set having 416 no cases and 167 yes cases
Table I. Liver Data Set Serial Number Attribute
1 Age
2 Gender
3 Total Billirubin
4 Direct Bilirubin
5 Alkaline Phosphotase
6 Alamine
Aminotransferase
7 Total Protiens
8 Albumin
9 Albumin and Globulin
Ratio
10 Data Set Class
V. PROPOSED TECHNIQUE
The principle destinations of this examination is to propose a technique that can create Classification Association Rules (CARs) productively and measure which strategy gives the more level of right anticipated an incentive for early conclusion of liver malady. The relative investigation of proposed strategy has been finished with other cutting edge methods. The concise subtleties of different advances are depicted as pursues:
A. Selection
We have considered kidney data set from Kaggle .We have considered 10 attributes of Liver data set as stated in section IV .They are 400 tuples in this data set and this set having
416yes (having liver disease )cases and 167 no cases(not having liver disease ) .
B. Pre-processing and Transformation
The liver dataset is set up in ARFF (Attribute-Relation File Format) document position standard of liver malady dataset. The information is changed over into right position for execution of cooperative methods. Different things required are the expulsion of right qualities for missing records, copy records evacuate pointless information field, standard information position, adjust information in a convenient way and so on. The considered liver data have few missing data values for different attributes.
D. Performance Evaluation
The performance evaluation of various machine learning algorithms like correctly classified instances, incorrectly
classified instances, kappa statistic, Mean absolute error
[image:4.595.56.280.356.638.2](MAE), Root Mean square error (RMSE)are to be discussed. We are about to do calculation of True positive rate, False positive rate Precision, Recall, F-Measure, Roc values and confusion matrix of various considered machine learning algorithms.
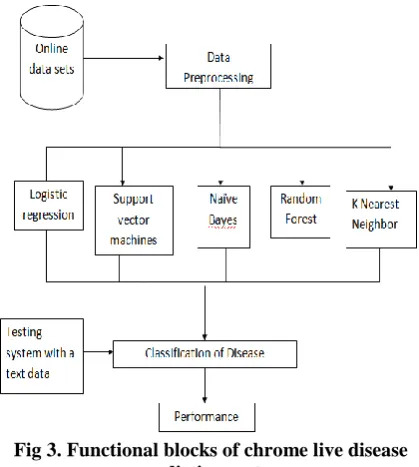
Fig 3. Functional blocks of chrome live disease prediction system
VI. PERFORMANCE MEASURES FOR
CLASSIFICATION
One can use following execution measures for the request and figure of imperfection slanted module as shown by his/her own need. Confusion Matrix: The confusion matrix is used to measure the introduction of two class issue for the given instructive record. The right corner to corner parts TP (True positive) and TN (True Negative) adequately describe Instances similarly as FP (false positive) and FN (false negative) wrongly request Instances. Confusion Matrix Correctly Classify Instance TP+TN Incorrectly Classify Instances.
True positives imply the positive liver tuples that were precisely named by the classifier,
International Journal of Innovative Technology and Exploring Engineering (IJITEE) ISSN: 2278-3075, Volume-9 Issue-2, December 2019
False positives are the negative liver tuples that were erroneously set apart as positive tuples False negatives are the positive liver tuples that
were incorrectly stamped negative tuples
[image:5.595.317.535.47.153.2] A confusion matrix for positive and negative tuples is as follows
Table II. Components of Confusion Matrix Predicted Class
Yes No
Actua l Class
Ye s
True Positives(TP )
False Positives(FP)
P
No False Negatives(F N)
True Negatives(T N)
N
P
Complement N
Complement P+ N Components of Confusion Matrix
A confusion matrix for positive and negative liver tuples for the considered data set is as follows Table III. Confusion matrix of Various Algorithms Name of the
algorithm
Classes Liver
disease = yes
Liver disease = no
K-Nearest Neighbour
Liver disease = yes
Liver disease = no
36
11
7
5
Total 47 12
Support Vector Machines
Liver disease = yes
Liver disease = no
42
16
1
0
Total 58 1
Logistic Regression
Liver disease = yes
Liver disease = no
41
12
2
4
Total 53 6
Navi Bayes Liver disease = yes
Liver disease = no
15
1
28
15
Total 16 43
Random Forest
Liver disease = yes
Liver disease = no
39
11
5
4
[image:5.595.51.547.63.749.2]Total 50 9
Fig .4. Graphical Presentation of various algorithms The accuracy of a classifier on a given test set is the percentage of test set tuples that are correctly classified by the classifier. That is,
Table IV. Various Measurements Formula
Measure Formula
Accuracy, Recognition Rate
TP+TN --- P+N
Error
,Misclassification Rate
FP+FN --- P+N
Sensitivity, True Positive rate, Recall
TP --- P
Specificity, True Negative Rate
TN --- N
Precision TP
--- TP+FP F, F1, F-score,
Harmonic mean of precision and recall
2* Precision* Recall ---
Precision +Recall
Table V. Results of Precision, Recall,F1-Score for various algorithms with Liver data base is as follows Name of
the algorithm
Averag es
Precisio n
Recal l
F1-Scor
e
Suppor t
K-Nearest Neighbor
0.77 0.84 0.80 43
0.42 0.31 0.36 16
Micro Averag
e
0.69 0.69 0.69 59
Macro Averag
e
Weighted Average
0.67 0.69 0.68 59
Support Vector Machines
0.72 0.98 0.83 43
0.00 0.00 0.00 16
Micro Average
0.71 0.71 0.71 59
Macro Average
0.36 0.49 0.42 59
Weighted Average
0.53 0.71 0.61 59
Logistic Regression
0.77 0.95 0.85 43
0.67 0.25 0.36 16
Micro Average
0.76 0.76 0.76 59
Macro Average
0.72 0.60 0.61 59
Weighted Average
0.74 0.76 0.72 59
Navi Bayes
0.94 0.35 0.51 43
0.35 0.94 0.51 16
Micro Average
0.51 0.51 0.51 59
Macro Average
0.64 0.64 0.51 59
Weighted Average
0.78 0.51 0.51 59
Random Forest
0.78 0.91 0.84 43
0.56 0.31 0.40 16
Micro Average
0.75 0.75 0.75 59
Macro Average
0.67 0.61 0.62 59
Weighted Average
0.72 0.75 0.72 59
[image:6.595.89.540.33.661.2]Fig 5 .Comparison of Micro, Macro, Weighted Average of various algorithms
Table VI: Accuracy Measure for Liver Disease Dataset
Name of
the Algorithm
Correctly Classified instances (%)
Incorrectly Classified instances (%) K-Nearest
Neighbour
69.49 30.50
Support Vector Machines
71.18 28.81
Logistic Regression
76.27 23.72
Navi Bayes
50.84 49.15
Random Forest
74.57 25.42
Table VII: Accuracy Measure for Liver Disease Dataset
Name of
the Algorithm
Kappa Statistics
Mean Absolute Error K-Nearest
Neighbour
0.16 0.30
Support Vector Machines
-0.03 0.28
Logistic Regression
0.25 0.23
Navi Bayes
0.18 0.49
Random Forest
0.25 0.25
Table VII: Accuracy Measure for Liver Disease Dataset
Name of
the Algorithm
Root Mean Squared Error
Relative Absolute Error (%)
Root Relative Square Error(%) K-Nearest
Neighbour
0.55 77.18 49.92
Support Vector Machines
0.53 72.89 47.15
Logistic Regression
0.48 60.02 38.83
Navi Bayes
0.70 124.34 80.43
Random Forest
0.50 64.31 41.60
[image:6.595.46.299.45.679.2]International Journal of Innovative Technology and Exploring Engineering (IJITEE) ISSN: 2278-3075, Volume-9 Issue-2, December 2019
Fig.5. Comparison of incorrectly classified instances of various algorithms
C. Kappa Statistics
[image:7.595.308.531.94.283.2]Kappa Statistic: The kappa measurement is a proportion of how intently the liver data instances characterized by the machine learning classifier coordinated the liver data named as ground truth, controlling for the exactness of an irregular classifier as estimated by the normal precision.
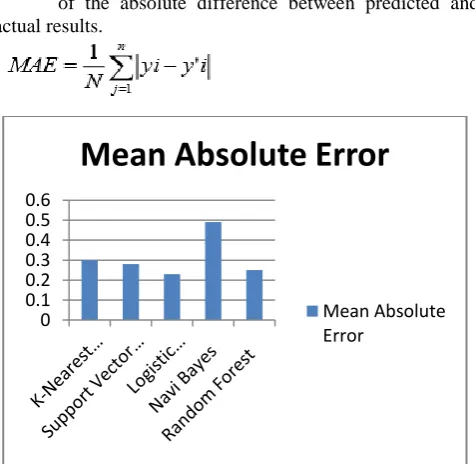
Fig 6 .Comparison of kappa statistic of various algorithms D. Mean Absolute Error
Mathematical representation of mean absolute error (MAE) is the mean liver test instances
of the absolute difference between predicted and actual results.
[image:7.595.46.280.310.482.2]
Fig.7. Comparison of Mean Absolute Error of various algorithms
E. Root Mean Squared Error
The size of root mean squared error (RMSE) is determined and It's the square base of the normal of squared contrasts among anticipated and genuine outcomes.
Fig.8. Comparison of Root Mean Squared Error of various Algorithms
[image:7.595.312.527.321.490.2]F. Root Absolute Error .It is the root of Absolute Error.
Fig.9. Comparison of Relative Absolute Error G. Root Relative Squared Error
Fig.10.Comparison of Root Relative Square Error of various Algorithms
0 20 40 60
Incorrectly classified
instances(%)
Incorrectly classified instances(%)
-0.050 0.050.1 0.150.2 0.250.3
Kappa Statistics
Kappa Statistics
0 0.1 0.2 0.3 0.4 0.5 0.6
Mean Absolute Error
Mean Absolute Error
0 0.2 0.4 0.6 0.8
Root Mean Squared
Error
Root Mean Squared Error
0 50 100 150
Relative Absolute
Error(%)
Relative Absolute Error(%)
0 20 40 60 80 100
K
-…
Su
p
p
o
rt
…
Lo
gis
tic
…
N
av
i …
Root Relative
Squared Error(%)
[image:7.595.50.288.530.762.2]VII. DISCUSSION
In this examination, we applied Machine Learning algorithms on ceaseless liver illness dataset to foresee patients who have interminable liver ailment, and the individuals who are not debilitated, in light of the information of each characteristic for every patient. Our objective was to think about various arrangement models and characterize the most productive one. Our examination was made based on five calculations positioned among the K-Nearest Neighbour, Support Vector Machines, Logistic Regression, Navi Bayes, Random Forest
With respect to, which speaks to the level of occasions ordered accurately, we see a variety calculated relapse having 76.27 % pursued by different calculations
Concerning estimation of indicators, the estimations of Mean total error(MAE), Root Mean Square error(RMSE), Relative Absolute error(RAE), Root relative square error (RRSR) demonstrated that Logistic Regression indicators scored the most reduced qualities (MAE = 0.23) (RMSE = 0.48, RAE =60.02%, RRSE = 38.83) trailed by different calculations .
VIII. CONCLUSION
As end, the use of information digging systems for prescient examination is significant in the wellbeing field since it enables us to confront ailments prior and accordingly spare individuals' lives through the expectation of fix. In this work, we utilized a few learning calculation K-Nearest Neighbour, Support Vector Machines, Logistic Regression, Navi Bayes, Random Forest to foresee patients with constant liver disappointment infection, and patients who are not experiencing this illness. Re-enactment results demonstrated that Logistic Regression classifier demonstrated its exhibition in foreseeing with best outcomes regarding precision and least execution time.
REFERENCES
1. D.A.Saleh F. Shebl M.Abdel-Hamid et.al ―Incidence and risk factors for hepatitis c infection in a cohort of women in rural Egypt‖,Tans.R.Soc.Trop ,Med,Hyg,vol.102 ,2008,PP.921-928.
2. S.A.Gonzalez dan E.B.Keeffe,‖Acute liver failure , ‖dalam Handbook of Liver Disease, Third Edition ,Ohiladelphia,Elesiver,PP 20-33,2012.
3. Chieh-ChenWu et.al ―Prediction of fatty liver using machine learning algorithms‖, Computer methods and medicines in Bio Medicines . 4. Joel Jacob, Joseph Chakkalakal Mathew, Johns Mathew, Elizabeth
Issac, ―Diagnosis of Liver Disease Using Machine Learning Techniques‖ International Research Journal of Engineering and Technology (IRJET) ,Volume: 05 Issue: 04 , Apr-2018
5. V.V. Ramalingam , A.Pandian, R. Ragavendran, ―Machine Learning Techniques on Liver Disease - A Survey‖, International Journal of Engineering & Technology, 7 (4.19) (2018) 485-495
6. 6.. Nazmun Nahar, Ferdous Ara , ―Liver Disease Prediction using by using different decision tree techniques‖ International Journal of Data Mining & Knowledge Management Process (IJDKP) Vol.8, No.2, March 2018.
7. Dr. S. Vijayarani, S.Dhayanand , ―Liver Disease Prediction using SVM and Naïve Bayes Algorithms‖, International Journal of Science, Engineering and Technology Research (IJSETR) Volume 4,Issue 4 ,April 2015,816-820
8. Shambel Kefelegn, Pooja Kamat, ―Prediction and Analysis of Liver Disorder Diseases by using Data Mining Technique: survey ‖,International Journal of pure and applied mathematics ,volume 118,No 9,765-770,2018
9. k. Thirunavukkarasu ; Ajay S. Singh ; Md Irfan ; Abhishek Chowdhury, ―Prediction of Liver Disease using Classification Algorithms‖, International Conference ,2018.
10. Somaya Hashem et.al , ― Comparison of Machine Learning Approaches for Prediction of Advanced Liver Fibrosis in Chronic
Hepatitis C Patients‖,IEEE/ACM Transactions on Computational Biology and Bioinformatics
11. Binish Khan1, Piyush Kumar Shukla , Manish Kumar Ahirwar ,
―Strategic Analysis in Prediction of Liver Disease Using Different Classification Algorithms‖, International Journal of Computer Sciences and Engineering Open Access Research Paper Vol.-7, Issue-7, July 2019.
12. Sivakumar ,D Manjunath Varchagall, Ambika L GUsha S , ―Chronic Liver Disease Prediction Analysis Based on the Impact of Life Quality Attributes‖International Journal of Recent Technology and Engineering (IJRTE) ISSN: 2277-3878, Volume-7, Issue-6S5, April 2019.