Abstract: With the advent of wireless communication, the problem of data security is of greatest interest. In this paper, spread spectrum techniques have been employed due to its advantages in providing data security. Further, the mechanical integrity of a transformer is investigated using an off-line diagnosis test called as Frequency Response Analysis (FRA). The FRA data of a transformer has been taken as the input signal which is being transmitted from the field where transformer is kept and received at the control room. Furthermore, Direct Sequence Spread Spectrum (DSSS) and Frequency Hopping Spread Spectrum (FHSS) are employed on FRA data and analyzed the signals by transmitting over Additive white Gaussian noise (AWGN) and Rayleigh faded Channels.
Keywords : Spread Spectrum, DSSS, FHSS, BPSK, FRA. I. INTRODUCTION
Achieving improved efficiency in power and bandwidth are two major challenges in the field of wired/wireless communication. Therefore, these two important parameters have to be addressed in order to achieve better performance in the recent wireless technology applications [1]. However, sometimes it is necessary to compromise at efficiency to achieve high security and reliability. When a signal is transmitted from one point to other point in wireless, it needs to be encountered two environments such as fading environment and jamming environment [2]. In order to achieve improved performance in both of these channels, spread spectrum is proposed in the literature [3]. Spread spectrum can be defined as a modulation technique in which pseudo-random sequence is used in expanding the actual bandwidth of the signal to reduce the multipath fading, increase the range and multiple access capability [4]. As shown in Figure 1, spreading is performed after the modulation and dispreading is performed before the demodulation to retrieve the original information. There are mainly two spread spectrum techniques being used in recent technologies such as Direct Sequence Spread Spectrum (DSSS) and Frequency Hopping Spread Spectrum (FHSS) [5].
Revised Manuscript Received on October 10, 2019
* Correspondence Author
[image:1.595.322.549.167.329.2]B Siva Kumar Reddy*, Associate Professor, Dept. of ECE, CMR Engineering College, Kandlakoya, Telangana, India-501401. Email:
Fig. 1. Spread spectrum in a basic Digital Communications System [2]. A. Direct Sequence Spread Spectrum
In DSSS transmission, the input signal is spread at base-band and then modulated by a carrier signal [6]. The data transmission is carried out in two steps. The first step is to secure the information by coding it with some pseudorandom bit sequence. The next step is to modulate the information with the help of a carrier signal. Using this methodology, the modulation process is separated from the spreading process. An important property of DSSS system is that it can easily be operated in even strong channel interference [7], [8]. A DSSS system effectively reduces the effect of noise on the transmitted data. It easily diminishes the interfering signal to a level up to the processing gain of the system itself. An interfering signal is reduced by a factor which may be as high as the processing gain. Interference handling capacity of a DSSS transmitter depends on the length of pseudorandom bit sequence. If the bit sequence length is increased the data becomes more secure. The major parts of DSSS are baseband data signal, PN sequence, modulation and transmission channel. The security and reliability of the system mainly depends on the quality of Pseudorandom number generators (PRNGs) [9].
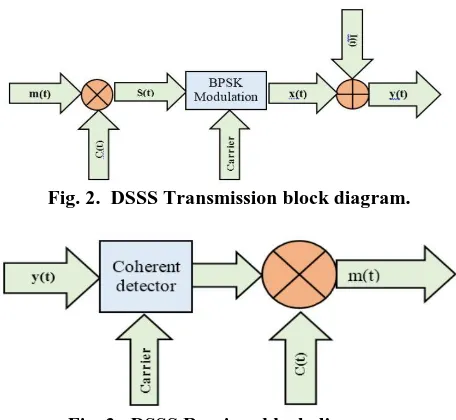
B. DSSS modulation and demodulation process During transmission phase a PN sequence c(t) is used to spread the baseband signal m(t) [10] and the combined spread signal s(t) is applied to (BPSK) modulator. The modulated signal is transmitted over AWGN channel and Rayleigh channel as shown in Figure 2. The coherent detector is used to demodulate the received signal y(t) and same PN code is used as shown in Figure 3. As the code consists of +1s and -1s, by this operation the PN code is removed and original data is obtained.
Spread Spectrum Sensing Techniques for
Transformer Frequency Response Data
It is observed that the dispread operation is the same as the spread operation. different carrier signals which are chosen randomly using PN sequence [11], [12]. FHSS is a wireless technology of CDMA scheme that distributes its signal over frequencies that are continuously varying. Each frequency band is again separated into a set of smaller frequencies.
[image:2.595.59.287.153.363.2]Fig. 2. DSSS Transmission block diagram.
Fig. 3. DSSS Receiver block diagram.
C. Frequency Hopping Spread Spectrum
In this method, different signals can be transmitted by signals randomly hop among a set of predefined arrangement of frequencies. Even if interference is occurring it only affects the signal for a very short interval. A narrow frequency band is required for a single carrier frequency whereas a much wider bandwidth is required for frequency hopping of signals while transmitting the data. At a given time, just a minor part of bandwidth is used for transmission. As a result the whole bandwidth remains the same [13]. FHSS does not provide any extra protection against wideband noise, however this method significantly reduces the losses that occur due to narrowband interference sources.
D. FHSS modulation and demodulation process The transmitted signal is spread among different channels and the entire bandwidth is separated into various sub-channels in a frequency-hopping spread spectrum (FHSS) system. For example, it is supposed that the channel is being divided into 8 different channels denoted as f1, f2, f3, f4, f5, f6, f7, f8. The signal „hops‟ among the above channels in the given order: f5, f8, f3, f6, f1, f7, f4, f2 as shown in Figure 4 [14]. The baseband signal is multiplied with different varying frequencies and then modulated onto a carrier. The PN source generates a new bit value for a frequency of the carrier. This parameter is utilized to look up a channel in the channel table, and that determines the
E. Frequency Response Analysis (FRA) of a Transformer In our contribution, we have applied spread spectrum sensing techniques on FRA data of a transformer. Dick and Erven introduced the term „FRA‟ to diagnosis a transformer [15]. Recently, FRA measurement became a mandatory diagnosis test for transformers in industries. It is observed that FRA measurement not only provides transformer mechanical integrity but also significant information about transformer internal condition [16]. Therefore, in this paper, FRA data is used as an input information to perform spread spectrum techniques. The FRA data obtained by transformer modeling in MATLAB is shown in Figure 5 [17].
Fig. 5. FRA input data. II. CHANNELS
To model and identify the effects of electromagnetic trans-mission of a data on wireless communication channels, the channel models are frequently used. Due to the presence of reflectors in the environment, the transmitter and receiver are badly affected. This can cause the information to traverse a different path than the desired one [18]. As a consequence, the receiver perceives an overlapping of multiple transmitted signal, each traveling across a different path. In this paper, AWGN and Rayleigh channel models are used to analyze the received signals.
A. AWGN Channel
[image:2.595.317.536.318.490.2]B. Rayleigh Channel
Rayleigh fading is a model used to analyze the effect of a medium of propagation on a transmission signal, like the ones that used by devices [20]. In this method, the magnitudes of transmitted signals are varied randomly as per a Rayleigh distribution, where that distribution is the combination of two uncorrelated Gaussian random variables.
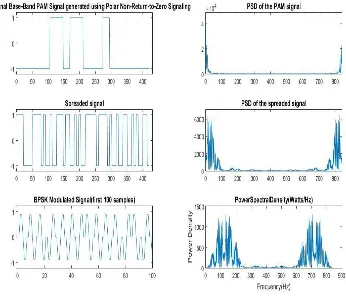
III. RESULTS AND DISCUSSION Figures 6 and 7 show the DSSS transmission over AWGN and Rayleigh channels, respectively. The first sub plot represents the input baseband signal which is the FRA taken from transformer and converted to binary data. In the second sub plot the binary data is spreaded using pseudorandom bit sequence. The third sub plot represents the first 100 samples of the BPSK modulated data. The corresponding power spectral density of the signals can be found out on right side. It is observed that the PSD in AWGN channel is much higher as compared to Rayleigh channel.
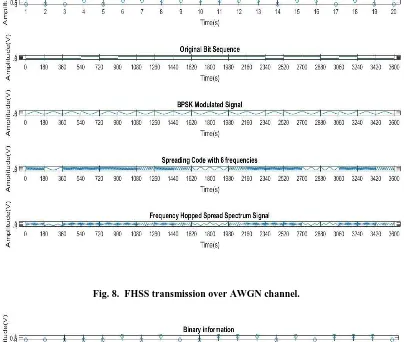
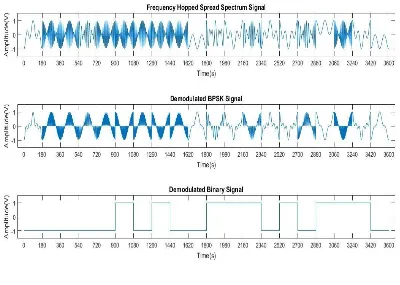
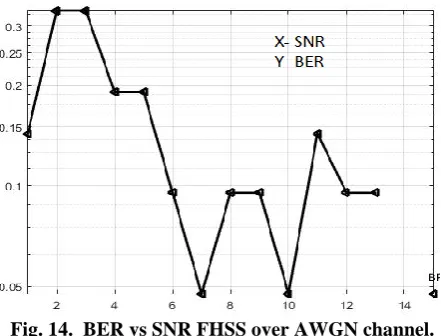
Figures 8 and 9 show the FHSS transmission over AWGN and Rayleigh channels, respectively. The first sub plot rep-resents the input baseband signal which is the FRA taken from transformer and converted to binary data. In the second sub plot the binary data is spreaded using six different frequencies on which the data hops. The third sub plot represents the first 100 samples of the BPSK modulated data. Figures 10 and 11 show the FHSS demodulated data over AWGN and Rayleigh channel which is same as the original bit sequence.
Fig. 6. DSSS transmission over AWGN channel.
[image:4.595.129.475.411.707.2]Fig. 8. FHSS transmission over AWGN channel.
Fig. 10. FHSS received signal over AWGN channel.
[image:6.595.102.502.403.688.2]Fig. 12. BER vs SNR DSSS over AWGN channel.
Fig. 13. BER vs SNR DSSS over Rayleigh channel.
[image:7.595.71.272.246.412.2]Fig. 14. BER vs SNR FHSS over AWGN channel. In this paper, the FRA data of a transformer is successfully transmitted and received over AWGN and Rayleigh channels. Two communication channels are implemented and performance is analyzed in terms of BER and SNR. The results obtained by using two different channels show that for DSSS system BER decreases as the number of users increase while for Rayleigh channel there is frequent change in the BER. With the help of spread spectrum sensing we have compared the strengths of signals in DSSS and FHSS. It is
Fig. 15. BER vs SNR FHSS over Rayleigh channel. REFERENCES
1. Sikora, Marcin, et al. Bandwidth-and power-efficient routing in linear
wireless networks. IEEE Transactions on Information Theory 52.6 (2006): 2624-2633.
2. Available at: webmail.aast.edu/mangoud/bb2.pdf
3. Peterson, Roger L., Rodger E. Ziemer, and David E. Borth.
Introduction to spread-spectrum communications. Vol. 995. New Jersey: Prentice hall, 1995.
4. Ansari, Imran Shafique, et al. New results on the sum of Gamma
random variates with application to the performance of wireless communication systems over Nakagamim fading channels. Transactions on Emerging Telecommunications Technologies 28.1 (2017).
5. Kaur, Navpreet, I. KaurAulakh, and Renu Vig. Analysis of Spread
Spec-trum Techniques in Cognitive Radio Networks. International Journal of Applied Engineering Research 11.8 (2016): 5641-5645.
6. Quyen, Nguyen Xuan, et al. Chaotic direct-sequence spread-spectrum
with variable symbol period: A technique for enhancing physical layer security. Computer Networks 109 (2016): 4-12.
7. Guo, Yichao, et al. Long-term integration based on two-stage
differen-tial acquisition for weak direct sequence spread spectrum signal. IET Communications 11.6 (2017): 878-886.
8. Wang, Ruichi, et al. Direct Sequence Spread Spectrum-Based PWM
Strategy for Harmonic Reduction and Communication. IEEE Transac-tions on Power Electronics 32.6 (2017): 4455-4465.
9. Chugunkov, Ilya, and Rami Muleys. Pseudorandom numbers
generators quality assessment using graphic tests. Electrical and Electronic Engi-neering Conference (ElConRusNW), Proceedings of the 2014 IEEE NW Russia Young Researchers in. IEEE, 2014.
10. Hasan, Md Mehedi, Jag Mohan Thakur, and Prajoy Podder. “Design
Implementation of FHSS and DSSS for Secure Data Transmission.” International Journal of Signal Processing Systems (2014).
11. Swamy, M. Katta, et al. Performance analysis of DSSS and FHSS
techniques over AWGN channel. Development (IJECIERD) 3.2 (2013)
12. Liu, Feng, et al. ”Compressive Sampling for Detection of
Frequency-Hopping Spread Spectrum Signals.” IEEE Transactions on Signal Pro-cessing 64.21 (2016): 5513-5524.
13. Xu, Fang, et al. ”Performance of CZT-assisted parallel combinatory
mul-ticarrier Frequency-Hopping Spread Spectrum over shallow underwater acoustic channels.” Ocean Engineering 110 (2015): 116-125.
14. Available URL at: http://www.geocities.ws/sarvamus/FH.htm
15. E. P. Dick and C. C. Erven, Transformer diagnostic testing by
frequency response analysis, IEEE Trans. Power App. Syst., Vol. PAS-97, No. 6, pp. 21442153, 1978.
16. Bagheri, Mehdi, B. T. Phung, and Trevor Blackburn. ”Transformer
[image:7.595.57.278.446.614.2]17. Yucek, Tevfik, and Huseyin Arslan. A survey of spectrum sensing algorithms for cognitive radio applications. IEEE communications surveys
a. tutorials 11.1 (2009)
18. Kolade, Oluwafemi, Jaco Versfeld, and Michael van Wyk.
Soft-Decision Decoding of Permutation Block Codes in AWGN and Rayleigh Fading Channels. IEEE Communications Letters 21.12 (2017): 2590-2593.
19. B. Siva Kumar Reddy, and B. Lakshmi. "Channel estimation and
equalization in OFDM receiver for WiMAX with Rayleigh distribution." 2013 International Conference on Advanced Electronic Systems (ICAES). IEEE, 2013.
20. Shah, Syed Muslim, Raza Samar, and Muhammad Asif Zahoor Raja.
”Fractional-order algorithms for tracking Rayleigh fading channels.” Nonlinear Dynamics 92.3 (2018): 1243-1259.
AUTHORS PROFILE
Dr B. Siva Kumar Reddy, is currently working as an Associate Professor, Department of Electronics and Communication Engineering, CMR Engineering College, Hyderabad, India. He had received B.Tech (Electronics and Communication Engineering) and M.Tech (Very Large Scale Integrated Circuits Design) degrees from Jawaharlal Nehru Technological University, Hyderabad (JNTUH), PhD in the field of Wireless Communication from National Institute of Technology, Warangal, India, in 2009, 2012 and 2016, respectively. His area of research includes Multi Carrier Modulations, OFDM, internet of Things (IoT), PAPR Reduction techniques, Spectral leakages, Adaptive Modulation and Coding, Spectrum Sensing, Channel
Estimation/Equalization/Synchronization, 3GPP, WiMAX, LTE,
Performance analysis of sensors, Embedded sytems and Software Defined Radio. He is an ISTE (Indian Society for Technical Education) life time member and invited member of IDES (Institute of Doctors, Engineers and Scientists).
Dr Anuj Kumar Goel is working as Professor of Electronics and Communication engineering in C.M.R. Engineering College, Hyderabad, India. He has the teaching experience of Twelve years. He had completed his Ph.D. in MEMS Modeling from
Maharishi Markandeshwar (Deemed to be
![Fig. 1. Spread spectrum in a basic Digital Communications System [2].](https://thumb-us.123doks.com/thumbv2/123dok_us/8171713.252153/1.595.322.549.167.329/fig-spread-spectrum-basic-digital-communications.webp)