This is a repository copy of Polysulfide-triggered fluorescent indicator suitable for super-resolution microscopy and application in imaging.
White Rose Research Online URL for this paper: http://eprints.whiterose.ac.uk/130875/
Version: Supplemental Material
Article:
Hoskere, A.A., Sreedharan, S., Ali, F. et al. (3 more authors) (2018) Polysulfide-triggered fluorescent indicator suitable for super-resolution microscopy and application in imaging. Chemical Communications, 54 (30). pp. 3735-3738. ISSN 1359-7345
https://doi.org/10.1039/c8cc01332b
[email protected] https://eprints.whiterose.ac.uk/ Reuse
Items deposited in White Rose Research Online are protected by copyright, with all rights reserved unless indicated otherwise. They may be downloaded and/or printed for private study, or other acts as permitted by national copyright laws. The publisher or other rights holders may allow further reproduction and re-use of the full text version. This is indicated by the licence information on the White Rose Research Online record for the item.
Takedown
If you consider content in White Rose Research Online to be in breach of UK law, please notify us by
S1
Supporting information for
Polysulfide-Triggered Fluorescent Indicator Suitable for
Super-Resolution Microscopy and Application in Imaging
Anila Hoskere A,a Sreejesh Sreedharan,b Firoj Ali,a Carl G. Smythe,c Jim A. Thomasb* and Amitava
Dasa,d*
a
Organic Chemistry Division, CSIR-National Chemical Laboratory, Pune-411008, India.
b
Department of Chemistry, University of Sheffield, Sheffield, S3 7HF, UK, Email:
c
Department of Biomedical Science, University of Sheffield, Sheffield, S10 2TN, UK.
d
CSIR-Central Salt & Marine Chemicals Research Institute, Bhavnagar: 364002, Gujarat,
S2
CONTENTS Page
General experimental methods. S3
Scheme 1: Synthetic route for 2-(benzoylthio)benzoic acid S4
Synthesis of 2-(benzoylthio)benzoic acid S4
Synthesis of MB-Sn S4
Fig. S 1: Reaction of MB-Sn with Na2S2 S5
Fig. S 2: Absorption spectrum of MB-Snand emission spectra of MB-OH S6
Fig. S 3: Absorption spectra of MB-Sn and MB-OH and absorption changes of
MB-Sn in the presence of Na2S2
S6
Fig. S 4: Time dependent emission of MB-Snin the presence or absence ofNa2S2 S7
Fig. S 5: pH dependent emission changes of MB-Sn in the presence of Na2S2 S7
Fig. S 6: pH dependent emission response S8
Fig. S 7: Intensity v/s Concentration plot and detection limit calculation S8
Fig. S 8: Interference studies with thiols and S8 S9
Structured Illumination Microscopy-Experimental details S9
Fig. S 9: Cytotoxicity assay S12
Fig. S 10: Wide-field fluorescence microscopy images with exogenous H2Sn S13
Fig. S 11: Co-staining with ER-Tracker S13
Fig. S 12: Co-staining with Hoechst S14
Fig. S 13: Time dependent emission in cells S14
Fig. S 14: 1H NMR spectrum of2-(benzoylthio)benzoic acid S15
Fig. S 15: 13CNMR spectrum of2-(benzoylthio)benzoic acid S15
Fig. S 16: HRMS spectrum of 2-(benzoylthio)benzoic acid S16
Fig. S 17: 1H NMR spectrum of MB-Sn S16
Fig. S 18: 13CNMR spectrum of MB-Sn S17
Fig. S 19: HRMS spectrum of MB-Sn S17
Fig. S 20: 1H NMR spectrum of reaction product MB-OH S18
Fig. S 21: HRMS spectrum of reaction product MB-OH S18
S3
General experimental methods:
All the commercial reagents were used as received without further purification. Solvents
were dried using standard procedures. HPLC grade solvents were used for spectral
measurements. 1H and 13C NMR spectra were recorded on Bruker 400/500 MHz FT NMR
(Model: Advance-DPX 400/500) using TMS as an internal standard. High-resolution mass
spectra were recorded on JEOL JM AX 505 HA mass spectrometer. UV-Vis spectra were
recorded using Shimadzu UV-1800 spectrometer. Fluorescence measurements were carried
out on quanta master-400 steady state fluorescence spectrometer. Na2S2 was purchased from
Dojindo molecular technologies Inc. Japan. Quantum yield was calculated by using
Rhodamine B as reference standard.2 All the Structured Illumination Microscopy (SIM) and
Wide Field Fluorescence Microscopy experiments were performed by using Delta Vision
OMX-SIM (GE Healthcare). The Post processing SIM reconstructions were performed by
using Soft Worx software. Images were analysed and processed using ImageJ software.
General experimental methods for UV-Vis and fluorescence studies:
A stock solution of MB-Sn(5×10⁻³M) was prepared in HPLC grade acetonitrile and the same
solution was used for all the studies after appropriate dilution with 20 mM Phosphate buffer
solution (pH 7.4). For spectroscopic measurements, stock solution of the probe was diluted
by using Phosphate buffer: CH3CN (9:1 v/v) mixture and the effective final concentration of
the probe was made as 10 µM. CTAB (5 mM) was prepared in ethanol and 50 µM of CTAB
was used for all the studies. After a thorough screening of the different solvent/buffer
combinations, we found that 10 µM of MB-Sn in Phosphate buffer: CH3CN (9:1 v/v) and 50
µM of CTAB provided the best results. Hence, this combination was used for all the spectral
measurements. Emission measurements were done using λExt= 530 nm with the emission slit
widths of 4/4 nm.
All the ROS, RNS used in the study were freshly prepared. Concetration of H2O2 was
determined by measuring the absorption at 240 nm ( = 43.6 M-1cm-1).4 Perchlorate
concentration was determined by measuring the absorption at 292 nm ( = 360 M-1cm-1).5
Hydroxyl radicals were generated in situ by the Fenton reaction of FeSO4 with H2O2.6Final
concentration of H2O2 and FeII was 200 µM and 50 µM respectively. 1O2 was generated by
the reaction of NaOCl with H2O2. Final concentration of OCl- and H2O2 was 50 µM and 200
µM respectively. Superoxide was prepared by adding 1mg of KO2 to 1ml of dry DMSO
S4
buffer. Na2S2 is highly unstable and readily decomposes in the buffer, so solutions were
freshly prepared as and when required and used immediately. CTAB is necessary to ensure
the stability of Na2S2. Hence, 50 µM of CTAB was used for the spectroscopic measurements.
Synthesis: BODIPY core and MB-OH were prepared by following our previous reports.1,2
Scheme 1: Synthetic route for 2-(benzoylthio)benzoic acid.
Synthesis 2-(benzoylthio)benzoic acid: Thiosalicylic acid (1.5 g, 9.72 mmol) was dissolved
in 25 ml of sodium bicarbonate (3 g, 35.71 mmol). The mixture was cooled to 0oC and
benzoyl chloride (1.15 ml, 9.72 mmol) and solid sodium carbonate (1.5 g, 14.15 mmol) was
added. The reaction mass was stirred at 0o C for 30 minutes and then allowed to warm to
room temperature. Reaction was stirred at room temperature for 1 hour. It was acidified with
conc. HCl, which resulted in a pure white precipitate. It was filtered and washed with water
to afford 2-(benzoylthio)benzoic acid as white solid 72% Yield. 1H NMR (DMSO-d6, 500
MHz): δ (ppm) 7.95 (2H, d, J = 7.6 Hz), 7.91 (1H, d, J = 7.2 Hz), 7.73-7.70 (1H, t) ,
7.63-7.57 (5H, m). 13C NMR (DMSO-d6, 125 MHz): δ (ppm) 189.33, 167.94, 137.48, 136.54,
136.38, 134.74, 132.28, 130.88, 130.42, 129.75, 127.54, 126.86. HRMS (ESI): m/z calculated
for C14H11O3S [M+H] 259.0423 found 259.0419. (Data matched with literature report3)
Synthesis of MB-Sn: 2-(benzoylthio)benzoic acid (150 mg, 0.58 mmol) was dissolved in 20
ml of dry CH2Cl2 . It was cooled to 0o C and N,N'-Dicyclohexylcarbodiimide (DCC) (121 mg,
0.58 mmol) was added. It was stirred at the same temperature for 1 hour. Then MB-OH (200
mg) and a catalytic amount of 4-dimethylaminopyridine (DMAP) was added. The reaction
mass was allowed to warm to room temperature and stirred overnight. The reaction mass was
filtered in order to remove the urea impurity and subsequently concentrated under reduced
pressure. Crude was purified by silica gel flash column chromatography using EtOAc and
hexane. The compound was eluted at 13% EtOAc. Off-pink solid yield 18%. 1H NMR
(CDCl3, 400 MHz): δ (ppm) 1.41 (3H, s), 1.45 (3H, s), 2.62 (3H, s), 6.03 (1H, s), 6.63 (1H,
s), 7.23 (2H, d, J = 6.7 Hz), 7.32 (3H, d, J = 7.3 Hz), 7.37-7.41 (1H, m), 7.50-7.56 (6H, m),
S5
29.72, 117.51, 119.38, 121.55, 122.00, 127.60, 127.90, 128.14, 128.46, 128.83, 129.01,
129.15, 129.64, 133.84, 134.46, 137.23, 142.35, 152.23, 155.87, 164.60, 189.36. HRMS
(ESI): m/z calculated for C40H31N2O3BF2 S [M+Na]691.2009 found 691.2003.
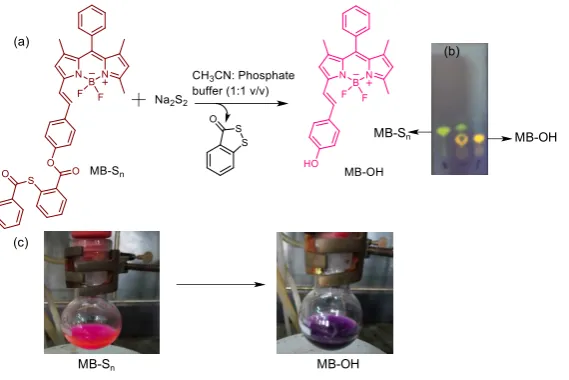
Reaction of MB-Sn with Na2S2:
(c)
MB-OH MB-Sn
(a)
(b)
[image:6.595.159.444.176.366.2]MB-Sn MB-OH
Fig. S1: (a) Reaction of MB-Sn with Na2S2. (b) Thin layer chromatography analysis under hand held
365 nm UV-lamp showing the formation of MB-OH. (c) Corresponding colour change in the reaction
mass observed after the addition of Na2S2.
MB-Sn (0.015 mmol) was dissolved in 2 ml CH3CN and 2 ml of Phosphate buffer (pH 7.4)
containing 200 µM of CTAB. To this Na2S2 (0.15 mmol) was added. Immediate change in the
colour from pale pink to purple was observed. The reaction mass was further stirred for 30
minutes and it was monitored by TLC. The reaction mass was diluted with EtOAc organic
layer was separated and dried over sodium sulphate and concentrated. It was purified by
preparatory chromatography method. 1H NMR (CDCl3, 400 MHz): δ (ppm) 1.39 (3H, s), 1.42
(3H, s), 2.60 (3H, s), 6.00 (1H, s), 6.58 (1H, s), 6.81 (2H, d, J = 8.5 Hz), 7.22 (1H, d, J = 16.5
Hz), 7.31 (2H, m), 7.33-7.52 (6H, m). HRMS (ESI): m/z calculated for C26H24N2OBF2
S6
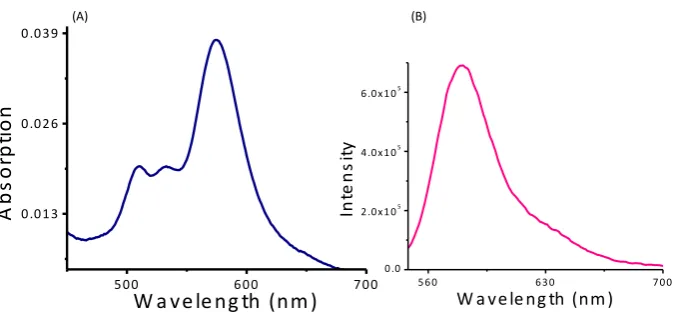
Absorption spectrum of MB-Sn and emission spectrum of MB-OH
5 0 0 6 0 0 7 0 0
0 .0 1 3 0 .0 2 6 0 .0 3 9
A
b
s
o
rp
ti
o
n
W a v e le ng th (nm )
5 6 0 6 3 0 7 0 0
0 .0 2 .0 x 1 05 4 .0 x 1 05 6 .0 x 1 05
In
te
n
s
it
y
W a v e le ng th (nm )
(A) (B)
Fig. S 2: (A) Absorption spectra of MB-Sn (10 µM). (B) Emission spectra of MB-OH (5 µM) in
phosphte buffer (20 mM) : CH3CN (9:1 v/v), at pH 7.4 containing 50 µM of CTAB.
Absorption spectrum of MB-Sn and MB-OH and absorption changes of MB-Sn in the
presence of Na2S2
5 0 0 6 0 0 7 0 0 0 .0 2
0 .0 4
A
b
s
o
rb
a
n
c
e
W a v e le ng th (nm ) 0 2 0µM
4 0 0 5 0 0 6 0 0 7 0 0 0 .0 0 0
0 .0 1 5
0 .0 3 0 MB -O H
MB -S
n
A
b
s
o
rb
a
n
c
e
W a v e le ng th (nm )
(A) (B)
Fig. S 3: (A) Absorption spectra of MB-Sn and MB-OH (10 µM each) in phosphate buffer:
Acetonitrile (9:1 v/v) containing 50 µM CTAB. (B) Absorption changes of MB-Sn in the presence of
[image:7.595.139.476.97.253.2] [image:7.595.138.471.390.537.2]S7
Time dependent emission study
2 5 0 5 0 0 7 5 0 1 0 0 0
2 .5 0 x 1 05 5 .0 0 x 1 05 7 .5 0 x 1 05
In
te
n
s
it
y
T im e (in s e c onds )
[image:8.595.144.460.107.331.2]P robe only P robe + N a 2S 2
Fig. S 4: Time dependent emission response of MB-Sn (10 µM) in the absence or presence of Na2S2
(10 µM) in 20 mM phosphte buffer: CH3CN (9:1 v/v), at pH7.4 containing 50 µM of CTAB. λExt =
530 nm. Emission was monitored at 584 nm.
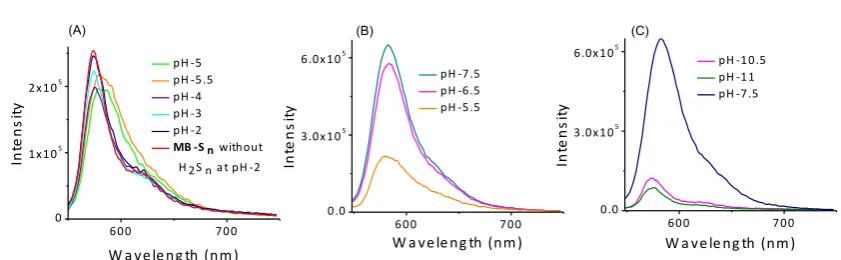
pH dependent study
6 0 0 7 0 0
0
1 x 1 05
2 x 1 05
pH -5 pH -5 .5 pH -4 pH -3 pH -2
MB -S n without
H 2S n a t pH -2
In
te
n
s
it
y
W a v e le ng th (nm )
6 0 0 7 0 0
0 .0
3 .0 x 1 05
6 .0 x 1 05
pH -7 .5 pH -6 .5 pH -5 .5
In
te
n
s
it
y
W a v e le ng th (nm )
6 0 0 7 0 0
0 .0
3 .0 x 1 05
6 .0 x 1 05
pH -1 0 .5 pH -1 1 pH -7 .5
In
te
n
s
it
y
W a v e le ng th (nm )
(A) (B) (C)
Fig. S 5: Emission response of MB-Sn (10 µM) in the presence or absence of Na2S2 (10 µM) at
[image:8.595.90.511.456.586.2]S8
0 .0 3 .0 x 1 0-6
6 .0 x 1 0-6 9 .0 x 1 0-6 2 .5 0 x 1 05
5 .0 0 x 1 05 7 .5 0 x 1 05
In
te
n
s
it
y
C onc e ntra tion (
µ
M)
E quation y = a + b*x A dj. R -S quare 0.97064
V alue S tandard E rror B Intercept 139568.29891 12112.04114 B S lope 5.05775E 10 3.10426E 9 E quation y = a + b*x
A dj. R -S quare 0.97381
V alue S tandard E rror B Intercept 138236.09655 11596.11292 B S lope 5.13472E 10 2.97203E 9
E quation y = a + b*x A dj. R -S quare 0.98248
V alue S tandard E rror B Intercept 142101.34648 9072.82495 B S lope 4.93028E 10 2.32533E 9
2 4 6 8 1 0
2 .0 x 1 05 4 .0 x 1 05
6 .0 x 1 05 MB -S n only MB -S n + H 2S n
In
te
n
s
it
y
[image:9.595.163.430.94.289.2]pH
Fig. S 6: Emission response of MB-Sn (10 µM) at different pH in the absence or presence of Na2S2
(10 µM). λExt = 530 nm.
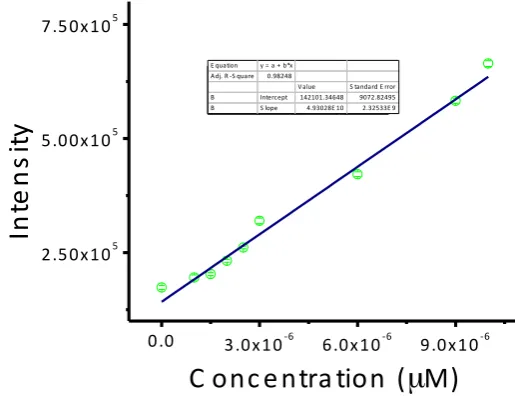
Detection limit calculation
Fig. S 7 : Intensity v/s concentration plot
The detection limit was calculated based on the fluorescence titration. The standard deviation
of the blank was determined by measuring the emission spectra of MB-Sn 7 times without the
addition of Na2S2.
The detection limit (DL) of MB-Sn was determined from the following equation:
DL = K * Sb1/S
[image:9.595.127.385.392.590.2]S9
Sb1 is the standard deviation of the blank;
S is the slope of the calibration curve.
From the graph, we get slope = 4.93028 x 10¹⁰, and the Sb1 value was found to be 427.5843.
Thus, using the above formula we get the Detection Limit = 23.65x 10⁻⁹ M.
Interference studies with thiols
1
2
3
4
5
6
7
8
9
0 .0
5 .0 x 1 0
51 .0 x 1 0
61 .5 x 1 0
62 .0 x 1 0
6In
te
n
s
it
y
[image:10.595.122.453.242.495.2]D iffe re nt A na ly te s
Fig. S 8: Emission response of MB-Sn (10 µM) in the presence of biothiols and S8. (From 1-9 MB-Sn
only; Cys; Homocysteine, GSH; H2S; S8; Cys+ S8;GSH+ S8;MB-Sn+ Na2S2.
Structured Illumination Microscopy Experiments with MB-Sn probe
(A) General Description:
Structured Illumination diffracts the beam into three parallel beams and they are combined by
the objective to produce 3D interference fringe patterns in the sample. Multiple images are
obtained by adjusting the fringe pattern and by slicing through the sample with respect to
different focal planes generating a series of images of the sample and this image volume is
known as Z-stack. Each frame of the Z-stack is reconstructed so that it could provide
S10
the resolution close to two fold, which is not achieved by using conventional light
microscopy.
(B) Sample preparation (SIM and Wide-Field Microscopy):
RAW 264.7 cells were seeded on coverslips (22 mm X 22 mm, 170 ± 5 µm square Cover
glasses) placed in six well plates in DMEM culture medium containing (10% FBS and 1%
Penicillin-Streptomycin) for 24 hours at 37¡C, 4% CO2. After 24 hours when 70%
confluency was achieved the cells were washed with DMEM culture medium then cells were
treated with MB-Sn (10 µM) for 25 minutes. Cells were then washed thrice with culture
medium and further treated with different Na2S2 for 20 minutes. After that cells were washed
again with Phosphate Buffer Saline (2X PBS). After carrying out the Live cell uptake of the
MB-Snprobe and Na2S2, the cells were fixed with 4% PFA for 15 minutes and then washed
thrice with PBS and then the coverslips were mounted using a mounting medium
(Vectashield h-1000).The coverslips were then sealed using nail varnish and the samples
were then imaged by Structured Illumination Microscopy and also Wide-field Fluorescence
Microscopy. For the endogenous detection, cells were pre-treated with various concentration
of (0-2500 nano gramas/ml) Lipopolysaccharides (16 hours). (LPS is known to stimulate
H2Sn production in cells through CSE pathway). Cells were washed and further treated with
MB-Sn(10 µM) for 25 minutes. And images were captured by following the same procedure
mentioned above.
Structured Illumination Microscopy and High Resolution Microscopy:
Instrument Specification:
The Delta Vision OMX system is a Microscope which surpasses normal microscopy
resolution limits. It allows imaging beyond the surface of the coverslips by using multiple
probes to retrieve exhaustive biological information from all directions. This InstrumentÕs
Structured Illumination Microscopy technology enables to image deeply the biology and
resolves features which are literally close to invisible through traditional light microscopy.
Delta Vision OMX is a flexible microscope and it works well with all kinds of probes
S11
Data Processing:
(A) Structured Illumination Microscopy (SIM):
Structured Illumination Microscopy (SIM) carried out by us using the Delta Vision OMX is
basically a Wide Field Microscopy technique based on MoireÕs effect. The Resolution
improvement is achieved based on the Reconstruction of the acquired image by using the
inbuilt software namely Soft Worx. The Z stacks acquired during the Imaging are post
processed by using the reconstruction option of Soft Worx. SIM acquisition is dependent
mainly on the imaging parameters and acquisition parameters and this varies depending on
the sample and in particular on the nature of the probe. The MB-Sn probe was Excited at 568
nm and the emission was collected at 586 nm (Alexa Flour 568 Channel of the Delta Vision
OMX). In the case of MB-Sn probe, the Structured Illumination experimental conditions for
single colour experiments were mainly dependent on the thickness of the Z stack (sections 80
to 100), section spacing (0.125 to 0.150), thickness of the sample (8 to 10). As MB-Sn probe
is a very bright probe, for the SIM acquisition, we needed to vary the %T and exposure time.
Therefore in all our Single colour experiments the exposure time was between 3 to 10 and the
%T was in the range of 10 to 50. The Colocalization experiments were performed with ER
Tracker Green. The Dual colour experiments were performed with Hoechst. In both of these
experiments, the SIM conditions of these Co-staining agents were maintained in accordance
with the MB-Sn probe which would be discussed in the later sections.
(B) 3D SIM Projection:
The offline processing of Structured Illumination Microscopy (SIM) images was carried out
by using FIJI (ImageJ) software. The option Stacks (3D project) was employed in obtaining a
3D projection of the Structured Illumination Microscopy images obtained by using the Delta
Vision OMX-SIM Microscope.
Colocalization SIM and Wide Field Microscopy Experiments:
(A) Colocalization Experiments with ER Tracker Green:
The Co-staining experiments with ER Tracker Green was carried out by Incubating the ER
Tracker Green (1 µM) further for 30 minutes after incubating the RAW cells with MB-Sn(10
S12
20 minutes. The ER-Tracker Green was excited at 488 nm and the Emission was collected in
the FITC Channel (500 nm to 550 nm).
(B) Dual Colour SIM and Wide-Field Microscopy Experiments:
The Dual colour experiments with Hoechst as the nuclear stain was carried out by incubating
the Hoechst-33342 (500 nM) for 30 minutes after incubating the LPS treated RAW cells with
MB-Sn (10 µM) for 25 minutes. Hoechst was excited at 405 nm and the emission was
collected in the DAPI channel (420 nm to 500 nm).
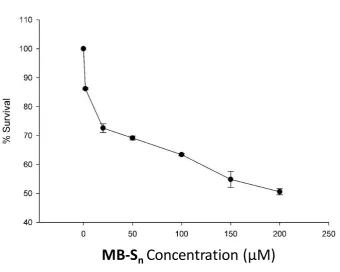
Cytotoxicity Assay
[image:13.595.120.461.290.562.2]MB-S
nConcentration (μM)
Fig. S 9: MTT assay to determine cytotoxicity of MB-Sn
The in vitro cytotoxicity of MB-Sn on RAW 264.7 macrophages were determined by MTT
(3-(4, 5-Dimethylthiazol-2-yl)-2, 5-diphenyltetrazolium bromide, a yellow tetrazole) assay.
RAW 264.7 cells (7 x 10³) were seeded in each well of a 96 well plate and cultured in an
incubator supplied with 5% CO2 maintained at 37¡C. Cells were maintained in DMEM
medium, supplemented with 10% Foetal Bovine Serum and 100 Units of
Penicillin-Streptomycin antibiotics. After 24 hours, the cells were treated with different concentrations
of MB-Snin triplicates for 24 hours. Cells were then treated with 0.5 µg/mL of MTT reagent.
S13
each well. Optical density was measured at 570 nm using Multiskan Go (Thermo Scientific)
to find the concentration of the cell inhibition. IC50 value was found to be > 200 µM.
The formula used for the calculation of the MTT assay for evaluation of the cell viability was
as follows:
Cell viability (%) = (means of Absorbance values of treated group/ means of Absorbance
values of untreated control) ×100.
[image:14.595.158.443.227.374.2]Wide-field fluorescence imaging
Fig. S 10: Wide-field fluorescence microscopy images of RAW 264.7 macrophages incubated with
MB-Sn (10 µM) and various concentration of Na2S2. Bottom row indicates the corresponding 3D
intensity profile plots.
Co-localization experiment with ER-Tracker
Fig. S 11: Widefield images of RAW 264.7 macrophages incubated with MB-Sn (10 µM) and
[image:14.595.161.443.509.580.2]S14
Co-staining experiment with Hoechst-33342
[image:15.595.116.481.93.184.2]A B C D
Fig. S 12: Widefield images of RAW 264.7 macrophages incubated with MB-Sn (10 µM) and
co-stained with nucleus staining dye Hoeschst.
Time dependent emission in cells
Fig. S 13: Widefield images of RAW 264.7 macrophages with MB-Sn (10 µM) recorded after the
[image:15.595.159.437.269.530.2]S15
1
H NMR spectrum 2-(benzoylthio)benzoic acid:
9 8 7 6 5 4 3 2 1 0
Chemical Shift (ppm)
5.04 1.02 1.02 2.00 7 .5 9 7 .6 0 7 .6 2 7 .6 3 7 .7 2 7 .9 1 7 .9 2 7 .9 5 7 .9 6
8.0 7.9 7.8 7.7 7.6 7.
Chemical Shift (ppm)
[image:16.595.118.476.76.371.2]5.04 1.02 1.02 2.00 7 .5 7 7 .5 9 7 .6 0 7 .6 2 7 .6 3 7 .7 0 7 .7 2 7 .7 3 7 .9 1 7 .9 2 7 .9 5 7 .9 6
!
Fig. S 14: 1H NMR spectrum of 2-(benzoylthio)benzoic acid in DMSO-d6. (* H2O).
13
C NMR spectrum of 2-(benzoylthio)benzoic acid:
190 180 170 160 150 140 130 120 110 100 90 80 70 60 50 40
1 2 6 .8 6 1 2 7 .5 4 1 2 9 .7 5 1 3 0 .4 2 1 3 0 .8 8 1 3 2 .2 8 1 3 4 .7 4 1 3 6 .3 8 1 3 7 .4 8 1 6 7 .9 4 1 8 9 .3 3
[image:16.595.114.479.497.727.2]S16
HRMS spectrum of 2-(benzoylthio)benzoic acid:
H2SNPRE #260RT:1.16AV:1NL:2.50E7
T:FTMS + p ESI Full ms [100.0000-1500.0000]
248 250 252 254 256 258 260 262 264 266 268 270 m/z 0 5 10 15 20 25 30 35 40 45 50 55 60 65 70 75 80 85 90 95 100 259.0419 R=70007 C14H11O3S = 259.0423
-1.8194 ppm 260.0452 R=66302 249.0516 R=65007 261.0378 R=64000 254.1147 R=53100 257.0261 R=46900 C14H9O3S = 257.0267
-2.4486 ppm 250.0552
R=49800
[image:17.595.114.480.132.373.2]266.3011 R=51400
Fig. S 16: HRMS spectrum of 2-(benzoylthio)benzoic acid.
1
H NMR spectrum of MB-Sn
8.5 8.0 7.5 7.0 6.5 6.0 5.5 5.0 4.5 4.0 3.5 3.0 2.5 2.0 1.5 1.0 0.5 0 1 2 3 4 5 6 7 8 6.3 2.8 0.9 1.2 1.7 2.7 1.0 5.9 4.8 2.8 1 .4 1 1 .4 5 2 .6 2 6 .6 3 7 .2 4 7 .3 2 7 .3 4 7 .5 0 7 .5 2 7 .5 4 7 .5 6 7 .6 6 7 .6 8 7 .6 9 8 .2 2 8 .2 4
!
[image:17.595.115.478.494.731.2]S17
13
C NMR spectrum of MB-Sn
B3-69 C13 IN CDCL3.ESP
200 180 160 140 120 100 80 60 40 20 0
Chemical Shift (ppm) 0 0.1 0.2 0.3 0.4 0.5 0.6 0.7 0.8 0.9 1.0 1 4 .4 2 1 4 .5 7 2 9 .7 2 1 1 7 .5 1 1 2 2 .0 0 1 2 7 .6 0 1 2 8 .1 4 1 2 8 .4 6 1 2 8 .8 3 1 2 9 .0 1 1 2 9 .1 5 1 2 9 .6 4 1 3 1 .5 8 1 3 3 .8 4 1 3 7 .2 3 1 5 2 .2 3 1 5 5 .8 7 1 6 4 .6 0 1 8 9 .3 6
Fig. S 18:13C NMR spectrum of MB-Snin CDCl3
HRMS spectrum of MB-Sn
BU-SN #370RT:1.66AV:1NL:2.91E6
T:FTMS + p ESI Full ms [100.0000-1500.0000]
680 690 700 710 720 730 740 750 760 770
m/z 0 5 10 15 20 25 30 35 40 45 50 55 60 65 70 75 80 85 90 95 100 691.2003 R=42407 C40H31O3N2B F2Na S = 691.2009
-0.8902 ppm 707.1742 R=41307 686.2448 R=41507 678.4780 R=41907 722.5043 R=39102 700.2602
R=39007 714.2763R=39007 766.5303
[image:18.595.116.480.99.353.2]R=37207 729.2380 R=38404 753.1721 R=33400 742.3065 R=37905
S18
1
[image:19.595.118.479.101.380.2]H NMR spectrum of the reaction product MB-OH
Fig. S 20:1H NMR spectrum of the reaction product MB-OH in CDCl3
HRMS spectrum of the reaction product MB-OH
T:FTMS + p ESI Full m s [66.70-1000.00]
400 405 410 415 420 425 430 435 440 m /z
0 5 10 15 20 25 30 35 40 45 50 55 60 65 70 75 80 85 90 95 100
429.1945 R=53907 C26H24O N2B F2= 429.1944
0.2860 ppm
409.1882 R=55207 C26H23O N2B F = 409.1882
-0.0665 ppm
439.1983 R=52307 434.2560
R=51106 413.2662
R=53502
421.2074 R=50602
424.8969 R=46602
445. 404.8397
R=36500
[image:19.595.116.480.444.729.2]S19
References
1. F. Ali, A. H. A, N. Taye, R. G. Gonnade, S. Chattopadhyay and A. Das, Chem. Commun., 2015, 51, 16932.
2. F. Ali, S. Sreedharan, A. H. Ashoka, H. K. Saeed, C. G. W. Smythe, J. A. Thomas and A. Das, Anal. Chem., 2017, 89, 12087.
3. R. J. Bahde, D. H. Appella and W. C. Trenkle, Tetrahedron Lett., 2011, 52, 4103.
4. F. Auchère, G. Bertho, I. Artaud, J. P. Girault and C. Capeillère-Blandin, Eur. J. Biochem., 2001, 268,
2889-2895.
5. J. C. Morris, J. Phys. Chem., 1966, 70, 3798-3805.
6. K. Setsukinai, Y. Urano, K. Kakinuma, H. J. Majima and T. Nagano, J. Biol. Chem., 2003, 278, 3170-3175.
7. W. Chen, E. W. Rosser, T. Matsunaga, A. Pacheco, T. Akaike and M. Xian, Angew. Chem., Int. Ed., 2015, 54, 13961.