This is a repository copy of Rare Variant, Gene-Based Association Study of Hereditary
Melanoma Using Whole-Exome Sequencing.
White Rose Research Online URL for this paper:
http://eprints.whiterose.ac.uk/131469/
Version: Accepted Version
Article:
Artomov, M, Stratigos, AJ, Kim, I et al. (21 more authors) (2017) Rare Variant, Gene-Based
Association Study of Hereditary Melanoma Using Whole-Exome Sequencing. JNCI:
Journal of the National Cancer Institute, 109 (12). djx083. ISSN 0027-8874
https://doi.org/10.1093/jnci/djx083
(c) The Author 2017. Published by Oxford University Press. This is a pre-copyedited,
author-produced version of an article accepted for publication in JNCI: Journal of the
National Cancer Institute following peer review. The version of record; Artomov, M,
Stratigos, AJ, Kim, I et al. Rare Variant, Gene-Based Association Study of Hereditary
Melanoma Using Whole-Exome Sequencing. JNCI: Journal of the National Cancer
Institute, 109 (12). djx083. is available online at: https://doi.org/10.1093/jnci/djx083.
[email protected]
Reuse
Items deposited in White Rose Research Online are protected by copyright, with all rights reserved unless
indicated otherwise. They may be downloaded and/or printed for private study, or other acts as permitted by
national copyright laws. The publisher or other rights holders may allow further reproduction and re-use of
the full text version. This is indicated by the licence information on the White Rose Research Online record
for the item.
Takedown
If you consider content in White Rose Research Online to be in breach of UK law, please notify us by
RARE VARIANT,GENE-BASED ASSOCIATION STUDY OF HEREDITARY MELANOMA USING WHOLE EXOME
SEQUENCING
Mykyta Artomov*1,2, Alexander J. Stratigos*3, Ivana Kim4, Raj Kumar5, Martin Lauss6, Bobby
Reddy5, Benchun Miao5,Daniela Robles Espinoza7, Aravind Sankar7, Ching-Ni Njauw5, Kristen
Shannon8, Evangelos S. Gragoudas4, Anne Marie Lane4, Julia A. Newton-Bishop9, D. Timothy
Bishop9, Elizabeth A. Holland10, Graham J. Mann10,11, Nicholas K. Hayward12, Nicholas K.
Hayward12 Tarjinder Singh13, Jeffrey Barrett13, David Adams7, Göran Jönsson6, Mark J. Daly1,
Hensin Tsao5,8.
1MGH Analytic and Translational Genetics Unit, MGH and Broad Institute, Boston, MA, USA 2 Department of Chemistry and Chemical Biology, Harvard University, Cambridge, MA, USA 3 1st Department of Dermatology, University of Athens School of Medicine, Andreas Sygros Hospital, Athens, Greece
4 Retina Service, Massachusetts Eye and Ear Infirmary, Boston, MA, USA
5 Department of Dermatology, W ellman Center for Photomedicine, MGH, Boston, MA, USA 6 Department of Oncology, Clinical Sciences, Lund University, Lund, Sweden
7 Experimental Cancer Genetics, Wellcome Trust Sanger Institute, Cambridge, UK 8 Melanoma Genetics Program, MGH Cancer Center, MGH, Boston, MA, USA
9 Section of Epidemiology and Biostatistics, Leeds Institute of Cancer and Pathology, University of Leeds, Leeds, UK
10 Centre for Cancer Research, W estmead Institute for Medical Research, University of Sydney, Westmead, Australia
11 Melanoma Institute Australia, University of Sydney, North Sydney, NSW 2060, Australia 12 QIMR Berghofer Medical Research Institute, Brisbane, QLD, Australia.
13 W ellcome Trust Sanger Institute, W ellcome Trust Genome Campus, Hinxton, Cambridge, UK
* MA and AJS should be considered equal co-first authors
Please send correspondences to MJD ([email protected]) or HT
A
BSTRACTBackground. Extraordinary progress has been made in our understanding of common variants in
many diseases, including melanoma. Since the contribution of rare coding variants is not as well
characterized, we performed an exome-wide, gene-based association study of familial cutaneous
melanoma (CM) and ocular melanoma (OM) using 12,033 jointly processed cases and controls.
Methods. Whole exome sequencing was performed followed by large-scale joint variant calling
using GATK. Plink/SEQ was used for statistical analysis of genetic variation. Four models were
used to estimate association among different types of variants. Functional validation was performed
using somatic, cellular and tumorigenesis assays.
Results. Strong signals were detected for CDKN2A (p=6.16E-08) and BAP1 (p=3.83E-06) in the
CM (n=273) and OM (n=99) cohorts, respectively. Eleven genes which exhibited borderline
association (p<10-4) were independently validated using the TCGA melanoma cohort (379 CM, 47
OM) and a matched set of 3,563 European controls with CDKN2A (p=9.31E-03), BAP1 (p=0.026)
and EBF3 (p=4.75E-04), a novel CM risk locus, all showing evidence of replication. EBF3 was then
evaluated using germline data from a set of 160 familial melanoma cases and 4,769 controls from
the U.K. (joint p=3.29E-05). Somatically, loss of EBF3 expression correlated with progression,
poorer outcome and high MITF tumors. Functionally, induction of EBF3 in melanoma cells reduced
arrested cell growth in vitro, retarded tumor formation in vivo and reduced MITF levels.
Conclusions. The results of this large rare variant germline association study further define the
mutational landscape of hereditary melanoma and implicate EBF3 as a possible CM predisposition
gene.
B
ACKGROUNDIn 2016, an estimated 76,380 Americans will develop cutaneous melanoma (CM) and 10,130 will
succumb to this disease{Siegel, 2016 #4144}. Of all cancers in the U.S., melanoma ranks fifth in
incidence among men and seventh among women{Siegel, 2016 #4144}. The incidence of ocular
melanoma (OM) is significantly lower with an estimated 2,500 cases annually in the United
States{Jovanovic, 2013 #4151}. It has been reported that 10% of melanoma patients report a
family history of melanoma{Greene, 1985 #1870;Kraemer, 1983 #940}. The risk for melanoma is
increased 2-fold for 1st degree relatives{Ford, 1995 #1591} and approximately 5-fold if two or more
1st-degree relatives are affected. Twin studies have estimated the heritability of melanoma to be
58%, which is significantly higher than the 33% for cancers overall{Mucci, 2016 #4145}. Thus,
there is evidence for a strong genetic influence on melanoma risk.
As with many cancers, the history of melanoma genetics can be divided into the pre- and
post-genomic era. Prior to the advent of high-density human post-genomic maps, linkage efforts implicated
familial melanoma loci on 1p36{Bale, 1989 #14} and 9p21{Cannon-Albright, 1992 #18}.
Subsequent interval gene screening led to the identification of deleterious germline alterations of
CDKN2A in a subset of 9p21-linked families. In the ensuing years, linkage efforts across multiple
families have produced additional candidate loci on chromosomes 1p36{Bale, 1989 #14},
9q21{Jonsson, 2005 #3587}, 5q31{Falchi, 2006 #3854} and 1p22{Gillanders, 2003 #2213} without
isolation of specific disease causing mutations. Rare germline mutations in CDK4, BAP1, MITF,
TERT (promoter), POT1, ACD and TERF2IP have also been reported in both ocular and cutaneous
melanoma families though, collectively, they account for less than 5 percent of all hereditary
melanoma cases{Soura, 2016 #4176;Soura, 2016 #4175}.
Common variant association studies (i.e. genome wide association studies (GWAS)) recently
culminated in an analysis of 15,990 CM cases and 26,409 controls, which substantiated 20
candidate association studies is that loci associated with pigmentation (MC1R, TYR, ASIP, OCA2
and SLC45A2), nevus count (CDKN2A-MTAP, PLA2G6 and TERT) and DNA repair (PARP1 and
ATM) represent core drivers of a risk phenotype that has been delineated by epidemiologic
studies{Elwood, 1984 #1760;Holman, 1984 #1772;MacKie, 1989 #1738;Gallagher, 1990
#1766;Bliss, 1995 #2191;Holly, 1995 #2866;Naldi, 2005 #2865}.
While GWAS have now been successfully deployed in a large spectrum of disorders, the
systematic pursuit of rare disease-causing variants is just emerging. Given the high cost of
sequencing in the past, linkage analysis provided a robust method to leverage recombination for
positional information. For relatively common endpoints, linkage has been largely unsuccessful as,
beyond rare examples of single pedigrees that are sufficiently large and carry a near-fully penetrant
mutation to generate significant linkage, the polygenic nature of common disease precludes gene
localization. To overcome the fact that rare variants are distributed across many genes, we and
others have proposed methodologies for gene discovery through rare variant association studies
(RVAS{Zuk, 2014 #4138;Samocha, 2014 #3959}). One common approach is to group the individual
variants into sets (e.g. gene-based association) and compare the aggregate frequency distribution
in cases vs. controls. Using this framework, we set out to comprehensively map the mutational
landscape of cutaneous and ocular melanoma by performing whole exome sequencing followed by
a rare variant association analysis in over 8,000 individuals (cases and PCA-matched European
non-cancer controls). Our results indicate that CDKN2A and BAP1 remain the leading
predisposition loci in CM and OM respectively, though a number of additional promising candidates
emerged. One of these, EBF3, was subsequently replicated in two additional cohorts of germline
M
ETHODSPatient cohorts. Details could be found in Supplementary Methods.
Exome sequencing, variant processing and calling. W hole exome libraries were prepared using
a modified version of Agilent's Exome Capture kit and protocol, automated on the Agilent Bravo and
Hamilton Starlet. Libraries were then prepared for sequencing using a modified version of the
manufacturer's suggested protocol, automated on the Agilent Bravo and Hamilton Starlet, followed
by sequencing on the Illumina HiSeq 2000. We used an aggregated set of samples consented for
joint variant calling resulting in 37,607 samples (germline from 292 CM patients, 101 OM patients,
379 TCGA CM patients, 47 TCGA OM patients, 24,612 controls and 12,158 other individuals not
used for association studies). All samples were sequenced using the same capture reagents at the
Broad Institute and aligned on the reference genome with BWA{Li, 2009 #4178} and the
best-practices GATK/Picard Pipeline, followed by joint variant calling with all samples processed as a
single batch using GATK v 3.1-144 Haplotype Caller{Van der Auwera, 2013 #4181;DePristo, 2011
#4180;McKenna, 2010 #4179}. The resulting dataset had 7,094,027 distinct variants. Haplotype
Caller, which was used for the ExAC database (http://exac.broadinstitute.org/gene), was also used
to detect indels. Selected mutations in CDKN2A and BAP1 were confirmed with Sanger
sequencing.
We performed principal component analysis (PCA) on common (MAF>5%) autosomal
independent SNPs to filter out all non-European samples with Eigenstrat{Price, 2006 #4183}.
Relatedness analysis among Europeans was conducted with PLINK{Purcell, 2007 #4184} as
suggested in the PLINK best practices{, #4185}. We used VEP{McLaren, 2010 #4186} for
functional annotation of the DNA variants. Common and rare variants analyses were conducted
using PLINK/SEQ, which allows indexing of the large datasets. A burden test was used for rare
burden test and variance-component test, respectively, to complement each other and to boost the
power of rare missense and protein truncating variation association detection{Lee, 2014 #4187}.
See details in supplementary methods.
Statistical Methods. Gene-based association was performed using 3 distinct, but related,
analytical frameworks. In the first analysis, a burden test was applied to all rare (MAF<1%) protein
truncating (PT) variants since the functional impact is presumed to be severe and most directly
inferred. Then, to expand on all rare variants (missense and PTV), a second analysis using both
the C-alpha and variable threshold (VT) tests was employed. A third analysis applied the burden
test to examine “ultra-rare” (MAF<.0001; ExAC database http://exac.broadinstitute.org/gene/)
variants as these may represent the most highly penetrant alleles. In the case of a single-model
association test – the null statistic was represented by the uniform distribution of p-values. Since
four different test statistics (i.e. VT, C-alpha, burden of PTVs and burden of ExAC filtered variants)
were applied and the lowest p-value was chosen, the null distribution was constructed by choosing
the smallest p-value from 4 null single-statistic models (4 sets of uniform p-values). This process
simulates the procedure of selecting the best p-value out of 4 different test statistics that was used
for gene-association testing thus making it a more conservative approach. Genome-wide
significance was determined by Bonferroni correction (0.05 /17,337 genes tested, i.e. p<2.88E-06).
EBF3 validation. EBF3 validation and expression analysis can be found in Supplementary
R
ESULTSCohort and overview
For this study, germline DNA from “genetically-enriched” cases (individuals with familial melanoma
or multiple primary melanomas) of CM and OM were identified and subjected to whole exome
sequencing. For the discovery set (Fig 1a), a total of 273 CM (M/F 128/145), 99 OM (M/F 46/53)
and 7,629 (M/F 5451/2178) European non-cancer control passed quality control and were included
in the subsequent analysis.
In order to ensure ancestral matching, we performed principal component analysis (PCA; Fig.
1b) between the cases and control cohorts in the primary and TCGA replication cohorts. Our
analysis was then restricted to European cluster of samples only. Examination of common
synonymous variants (MAF>5%) revealed a null-distribution of the test statistic between cases and
controls. There was an average of 25,633 SNPs per sample, which is within the expected range for
a typical European germline exome{DePristo, 2011 #4180}.
The first replication cohort included 379 CM and 47 OM cases from TCGA and 3,563 European
non-cancer controls. These additional 3,989 samples were jointly processed through the same
alignment and variant calling pipeline as the initial discovery set and subjected to the same quality
control standards. For EBF3, a second replication was performed using allele counts derived from
160 familial melanoma cases (i.e. 77 cases (66 families) from Leeds, U.K., 56 cases (9 families)
from Sydney, Australia and 27 cases (6 families) from Queensland, Australia) and 4,769
non-cancer controls from the UK10K population project; whole genotypes were not available for the U.K.
replication cohort and thus were not matched by PCA.
Mutational landscape of cutaneous and ocular melanoma
We first interrogated our melanoma cases for rare PT mutations among known melanoma
BAP1; Supplementary Table 1 and Supplementary Table 2). As expected, the most significant
associations were for CDKN2A (p=6.16E-08 with CM) and BAP1 (p=0.005 for CM and p=3.83E-06
for OM). We detected 5 rare POT1 mutations (p=.002), including novel nonsense (p. Ser522X) and
splice donor (chr7:124475332 C/T) mutations and a previously reported p.D224N variant. For
MC1R, we examined red hair color (RHC) variants and observed 126, 23 and 6 individuals among
CM cohort with single heterozygous, double heterozygous and homozygous genotypes,
respectively; analogous counts for controls were 2,269, 251 and 60 (Supplementary Table 3;
p=1.00E-08; cumulative allele odds ratio=1.79, 95% CI: 1.46 to 2.16).
The top cutaneous melanoma risk candidates which emerged from each of the 3 analytical
frameworks are shown in Supplementary Table 4 (full rankings and details shown in Supplementary
Tables 5, 6 and 7). Figure 2a shows the Pmin Manhattan plot for all 17,337 genes that were
analyzed for association. CDKN2A exhibited the strongest association (Pmin = 6.16E-08,
Supplementary Table 4) and was the only locus to reach genome-wide significance. Other
candidates which were near, but not reaching, genome-wide significance were considered novel
and which were subjected for further study included ACTR8 (Pmin=2.18E-05, C-alpha), ECHD1
(Pmin=3.73E-05, C-alpha), COL11A2 (Pmin=5.42E-05, PTV burden) and EBF3 (Pmin=8.22E-05,
C-alpha). Similar analyses for ocular melanoma are also shown in Supplementary Table 4 (also
Supplementary Tables 8, 9 and 10). BAP1 was the leading risk gene (Pmin=3.83E-06;
Supplementary Table 4 and Fig 2b) though it did not quite reach genome-wide significance. Other
borderline candidates that were subjected to further analysis include IAH1 (Pmin=2.27E-05,
C-alpha), NHLRC3 (Pmin=6.88E-05, C-alpha), RSRC1 (Pmin=1E-04, C-alpha), PAPOLG (Pmin=1E-04,
C-alpha).
All CM and OM loci with a significance level of p<1.00E-4 (6 CM genes, 5 OM genes) were then
subjected to replication with germline exome sequences from the TCGA (CM, n=379; OM, n=47)
and another independent cohort of 3,563 matched European controls jointly processed with the
(p=4.75E-04; C-alpha) both remained significant while, for OM, BAP1 also remained significant (p=2.64E-02;
PTV burden). As EBF3 represents a potentially novel risk gene, we performed a second replication
with this gene by interrogating whole exome and genome sequence data for 160 familial melanoma
cases from 81 melanoma-prone kindreds. W e identified a Leeds family with a p.N455S mutation
which was detected in 1 of 2 affected members and a Sydney family with a p.G21S variant that was
present in 2 of 6 affected members. Similar evaluation of 4,769 individuals from the UK10K cohort
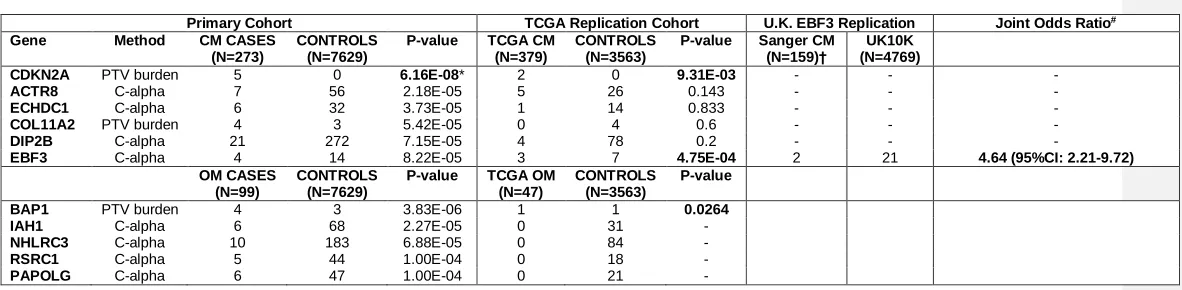
revealed 21 EBF3 mutation carriers in this control set. In aggregate (Table 1), a joint burden test
across all EBF3 cohorts resulted in a significant association between EBF3 and cutaneous
melanoma (9/811 cases and 42/15,961 controls; OR= 4.64 [95% CI 2.21- 9.72], p=3.29E-05,
Mantel-Haenszel chi-square test); to avoid a bias counting of carriers, we censored one of the two
p.G21S carriers in the Sydney family while accounting for all non-carriers (i.e. 3 mutations out of
160 cases were identified in the U.K. replication but 2 carriers out of 159 individuals used for
Mantel-Haenszel test). Taken together, these results confirm the known contribution of CDKN2A
and BAP1 as strong risk loci for CM and OM, respectively, and nominate EBF3 as a novel risk gene
for CM. In addition, the recovery of these known hereditary melanoma loci further verified the
technical and methodological pipeline used in this RVAS.
Although the study was not designed to compare genes which selectively confer risk for either,
or both, CM and OM, we did compare the Pmin’s for each gene relative to their melanoma type (Fig
2c). There was some evidence that LCE1E can confer risk for both CM and OM (Pmin=1.59E-04 for
OM and 2.56E-03 for CM) though neither reached genome-wide significance.
Functional validation of EBF3
Among the secondary candidates, none has been previously linked to cancer predisposition.
Since EBF3 ranked in 3 of 4 framework analyses, was replicated in the TCGA and European
cohorts and has been reported to possess tumor suppressive activity in a number of non-melanoma
Among melanoma cases, there were 4 mutations in our discovery set (Fig S2; one p.Q137R, one
p.A409T and two p.N484S), 3 mutations in the TCGA cohort (one p.P594L and two p.G459C) and 2
variants in the European melanoma panel (p.N455S and p.G21S). Among the EBF3 variants in
our cases, 2 have been previously observed - p.N484S (MAF=3.00E-05; European/Non-Finnish)
and p.G21S (MAF=2.21E-04; European/Non-Finnish) albeit at a much lower rate. The p.Q137R
mutation falls within the DNA binding domain, the p.A409T mutation lies in the third helix of the
HLHLH domain and the p.N484S alteration sits in and the C-terminal Pro/Ser/Thr-rich (PST) region
(Fig S2). As EBF3 shows low sequence homology to other protein families and have no known
biological connection to melanoma, we set out to perform proof-of-concept validation for EBF3 as a
tumor suppressor using available somatic data and empirical cell-based assays.
Cancer susceptibility loci, including those for melanoma (e.g. CDKN2A and BAP1), often
function as tumor suppressor genes and thus exhibit structural damage and/or expression loss
during malignant progression. To this end, we surveyed the TCGA melanoma tumors for evidence
of somatic copy-number loss. As shown in Figure 3a, EBF3 harbored significantly more deletions
than other genes (Wilcoxon test, p=2.00E-151), which may, in some cases, reflect loss of the entire
10q arm. There is evidence of concurrent shallow deletions of EBF3 and PTEN (also on 10q)
though deep deletions of EBF3 are uncommon and independent of PTEN while expression levels of
the two genes appear to be also uncorrelated (Fig S3). On a mutation level, there were there were
28 missense alterations identified in the TCGA melanoma cohort with no loss-of-function variants
(Supplementary Table 11).
With regards to expression, primary melanomas exhibited lower EBF3 RNA levels when
compared to either normal skin or benign nevi (Fig 3b; melanoma vs nevus, p=0.005) suggesting
that loss of EBF3 may contribute to melanoma progression. Diminished EBF3 expression was also
associated with heightened tumor aggressiveness. Using microarray data from a panel of 125
stage III melanoma tumor specimens obtained at Lund University and RNA-seq data from 470
correlation with poorer overall survival in the Lund data set (Fig 3c; p=0.02) and a marginal trend
toward a worsened outcome among the TCGA tumors (p=0.10).
To better understand the molecular context of EBF3 function, we examined EBF3 levels across
known molecular subtypes of melanoma. Strikingly, EBF3 appears to be inversely correlated with
the MITF-anchored classes, i.e. EBF3 expression was lowest in the MITF-hi (“Pigmentation”)
subtype from the Lund cohort and highest in the “MITF-lo” subtype from the TCGA set (Fig 3d).
Given this intriguing relationship, we searched for interactions between levels of EBF3 and
melanocyte lineage genes. There was a statistically significant inverse relationship between EBF3
and MITF expression levels in both the Lund (Spearman r, -0.36, 95% CI: -0.47 to -0.24, p<0.0001)
and TCGA (Spearman r, -0.30, 95% CI:-0.40 to -0.18, p<0.0001, Supplementary Table 12) tumor
sets. Moreover, examination of several known MITF targets (Fig 3e; TYR, MLANA) and upstream
regulators of MITF (TCF4, SOX10, PAX3) all revealed a consistent pattern whereby lineage genes
which positively correlated with MITF (i.e. TYR, MLANA, SOX10 and PAX3) were negatively
correlated with EBF3 while TCF4, a known negative regulator of MITF, was positively correlated
with EBF3. These results reveal a reciprocal relationship between EBF3 and MITF and raise the
possibility that EBF3 may antagonize MITF. To test this hypothesis, we induced EBF3 in two
MITF-expressing melanoma lines (G-mel and UACC-62) using a Tet-responsive system and found a
concomitant reduction of MITF in both cell lines (Fig 3f).
We next sought to phenotypically credential EBF3 in cellular and animal experiments. As shown
in Figure 4a, there was dose-dependent suppression of cellular proliferation with escalating levels
of EBF3 in 3 melanoma cell lines; exposure of cells with the Tet-GFP control vector to doxycycline
had no measurable effect on survival (data not shown). A375 and LOX cells were then subjected
to a 3-D matrigel spheroid formation assay and, for both lines, there was a significant reduction in
colony volume with the introduction of EBF3 (Fig 4b). Finally, overexpression of EBF3 in A375
together, these results suggest that EBF3 is a veritable tumor suppressor in melanoma, a function
C
ONCLUSIONSThe contribution of rare coding mutations to disease risk, such as melanoma, remains a
bourgeoning but largely unexplored domain in human genomics. To the best of our knowledge, this
is the first exome-based, rare variant association study in melanoma. Several technical
advancements, which were introduced to permit the robust assembly of the large exome sequence
dataset include the joint variant calling and an advanced quality-check protocol.
Our results indicate that in the landscape of hereditary melanoma, CDKN2A and BAP1 exhibit
the strongest association with CM and OM, respectively. By design, we did not exclude these
samples from analysis but blindly included the cases in the entire pipeline as “positive” controls; we
were reassured that our methodology did recover these genes. There were additional risk loci
which approached genome-wide significance (Supplementary Table 2 and 4; Pmin<1E-04), one of
which, EBF3, was further replicated in the TCGA and European melanoma cohorts.
We propose that EBF3 has many of the features of melanoma predisposition gene based on
multiple lines of investigation: (i) the enrichment for germline EBF3 variants among individuals with
melanoma across disparate cohorts, (ii) the presence of deletions at the EBF3 locus in tumor
specimens, (iii) the increased clinical aggressiveness associated with EBF3 loss, (iv) the reciprocal
interaction between EBF3 and the known lineage oncogene MITF and (v) the direct inhibitory
effects of EBF3 on cellular growth and tumor formation. In two families where multiple affected
cases were available for analysis, EBF3 mutations were identified only in a fraction of the cases
(1/2 and 2/6 affected members) suggesting that these mutations are moderate risk alleles, which is
similar to the risk conferred by the MITF(E318K) variant and consistent with EBF3’s calculated odds
ratio of ~4-5.
EBF3 belongs to a family of transcription factors (EBF1-4) known to be involved in B cell
differentiation and the pathogenesis of several tumor types{Liao, 2009 #4204;Tao, 2015 #4192}.
specification{Medina, 2004 #4332;Liao, 2009 #4331} could explain, in part, the observed
association between EBF3 and the “high immune” melanoma subclass (Fig 3d). The EBF3 gene is
located on the chromosome 10q26.3 and encodes a 596 amino acid protein with a conserved
N-terminal DNA binding region, an IPT/TIG domain, an unusual helix-loop-helix-loop-helix (HLHLH)
motif and a C-terminal PST domain{Siponen, 2010 #4212}. Functionally, the EBF transcription
factors bind to DNA with a consensus sequence of 5-CCCNNGGG-3 as homo- or heterodimers
and can interact with p300{Liao, 2009 #4331}. Our mutations do not appear to cluster in any single
domain though genotype/functional experiments are currently underway.
For melanoma, there is a single report of EBF1 SNPs being correlated with survival among
stage III and IV patients{Fang, 2015 #4177}. In our study, EBF3 showed strong association in all
analytical dimensions except the LoF burden test. Examination of this gene in the ExAC database
revealed an extreme intolerance for LoF variation (pLI=1.0) thereby suggesting that full loss of
EBF3 function may undergo strong negative selection. The precise mechanism of EBF3 action in
melanoma remains to be elucidated though one recent report suggests that EBF3 might play a role
in cell migration, and possibly proliferation, in a subset of melanoma lines{Chatterjee, 2016 #4334}.
There is precedence for transcription factors in cancer-predisposition. Perhaps the most relevant is
a low prevalence SNP in the MITF transcription factor (i.e. p.E318K) which alters a sumoylation site
and which confers risk for both cutaneous melanoma and renal cell carcinoma{Yokoyama, 2011
#3783;Bertolotto, 2011 #3786}. Germline mutations in other transcription factors such as TP53 and
RUNX1 also produce strong cancer phenotypes in Li-Fraumeni syndrome (OMIM #151623) and
familial AML (OMIM #601399), respectively.
The design of our study incorporates several classic RVAS strategies{Zuk, 2014 #4138} though
there are also several limitations. Full exome sequencing is still more expensive compared to
genotyping but the costs are converging. Although we enriched for genetic causation by focusing
on rarer familial and multiple tumor cases, statistical power is still significantly lower than those
analytical pipeline including the CDKN2A and BAP1 families and were reassured that significant
association signals were readily detected for these loci.
Despite limitations, the analyses in this report represent a major first step towards understanding
the landscape of rare mutations in hereditary melanoma. The statistical methodologies which were
blindly deployed in the case/control design unequivocally recovered several anticipated signals (i.e.
CDKN2A and BAP1). Moreover, several sub-threshold loci have been nominated for future studies
R
EFERENCEL
IST1. Siegel RL, Miller KD, Jemal A. Cancer statistics, 2016. CA Cancer J Clin 2016;66(1):7-30.
2. Jovanovic P, Mihajlovic M, Djordjevic-Jocic J, et al. Ocular melanoma: an overview of the
current status. Int J Clin Exp Pathol 2013;6(7):1230-44.
3. Greene MH, Clark WH, Jr., Tucker MA, et al. High risk of malignant melanoma in
melanoma-prone families with dysplastic nevi. Ann Intern Med 1985;102(4):458-65.
4. Kraemer KH, Greene MH, Tarone R, et al. Dysplastic naevi and cutaneous melanoma risk.
Lancet 1983;2:1076-7.
5. Ford D, Bliss JM, Swerdlow AJ, et al. Risk of cutaneous melanoma associated with a family
history of the disease. The International Melanoma Analysis Group (IMAGE). Int J Cancer
1995;62(4):377-81.
6. Mucci LA, Hjelmborg JB, Harris JR, et al. Familial Risk and Heritability of Cancer Among
Twins in Nordic Countries. JAMA 2016;315(1):68-76.
7. Bale SJ, Dracopoli NC, Tucker MA, et al. Mapping the gene for hereditary cutaneous
malignant melanoma-dysplastic nevus syndrome to chromosome 1p. New England Journal of
Medicine 1989;320:1367-1372.
8. Cannon-Albright LA, Goldgar DE, Meyer LJ, et al. Assignment of a locus for familial
melanoma, MLM, to chromosome 9p13-p22. Science 1992;258:1148-1152.
9. Jonsson G, Bendahl PO, Sandberg T, et al. Mapping of a novel ocular and cutaneous
malignant melanoma susceptibility locus to chromosome 9q21.32. J Natl Cancer Inst
2005;97(18):1377-82.
10. Falchi M, Spector TD, Perks U, et al. Genome-wide search for nevus density shows linkage
to two melanoma loci on chromosome 9 and identifies a new QTL on 5q31 in an adult twin cohort.
11. Gillanders E, Hank Juo SH, Holland EA, et al. Localization of a novel melanoma
susceptibility locus to 1p22. Am J Hum Genet 2003;73(2):301-13.
12. Soura E, Eliades PJ, Shannon K, et al. Hereditary melanoma: Update on syndromes and
management: Genetics of familial atypical multiple mole melanoma syndrome. J Am Acad Dermatol
2016;74(3):395-407.
13. Soura E, Eliades PJ, Shannon K, et al. Hereditary melanoma: Update on syndromes and
management: Emerging melanoma cancer complexes and genetic counseling. J Am Acad
Dermatol 2016;74(3):411-20.
14. Law MH, Bishop DT, Lee JE, et al. Genome-wide meta-analysis identifies five new
susceptibility loci for cutaneous malignant melanoma. Nat Genet 2015;47(9):987-95.
15. Elwood JM, Gallagher RP, Hill GB, et al. Pigmentation and skin reaction to sun as risk
factors for cutaneous melanoma: W estern Canada Melanoma Study. Br Med J (Clin Res Ed)
1984;288(6411):99-102.
16. Holman CD, Armstrong BK. Pigmentary traits, ethnic origin, benign nevi, and family history
as risk factors for cutaneous malignant melanoma. J Natl Cancer Inst 1984;72(2):257-66.
17. MacKie RM, Freudenberger T, Aitchison TC. Personal risk-factor chart for cutaneous
melanoma. Lancet 1989;2(8661):487-90.
18. Gallagher RP, McLean DI, Yang CP, et al. Suntan, sunburn, and pigmentation factors and
the frequency of acquired melanocytic nevi in children. Similarities to melanoma: the Vancouver
Mole Study. Arch Dermatol 1990;126(6):770-6.
19. Bliss JM, Ford D, Swerdlow AJ, et al. Risk of cutaneous melanoma associated with
pigmentation characteristics and freckling: systematic overview of 10 case-control studies. The
International Melanoma Analysis Group (IMAGE). Int J Cancer 1995;62(4):367-76.
20. Holly EA, Aston DA, Cress RD, et al. Cutaneous melanoma in women. II. Phenotypic
21. Naldi L, Altieri A, Imberti GL, et al. Sun exposure, phenotypic characteristics, and cutaneous
malignant melanoma. An analysis according to different clinico-pathological variants and anatomic
locations (Italy). Cancer Causes Control 2005;16(8):893-9.
22. Zuk O, Schaffner SF, Samocha K, et al. Searching for missing heritability: designing rare
variant association studies. Proc Natl Acad Sci U S A 2014;111(4):E455-64.
23. Samocha KE, Robinson EB, Sanders SJ, et al. A framework for the interpretation of de novo
mutation in human disease. Nat Genet 2014;46(9):944-50.
24. Li H, Durbin R. Fast and accurate short read alignment with Burrows-Wheeler transform.
Bioinformatics 2009;25(14):1754-60.
25. Van der Auwera GA, Carneiro MO, Hartl C, et al. From FastQ data to high confidence
variant calls: the Genome Analysis Toolkit best practices pipeline. Curr Protoc Bioinformatics
2013;11(1110):11 10 1-11 10 33.
26. DePristo MA, Banks E, Poplin R, et al. A framework for variation discovery and genotyping
using next-generation DNA sequencing data. Nat Genet 2011;43(5):491-8.
27. McKenna A, Hanna M, Banks E, et al. The Genome Analysis Toolkit: a MapReduce
framework for analyzing next-generation DNA sequencing data. Genome Res
2010;20(9):1297-303.
28. Price AL, Patterson NJ, Plenge RM, et al. Principal components analysis corrects for
stratification in genome-wide association studies. Nat Genet 2006;38(8):904-9.
29. Purcell S, Neale B, Todd-Brown K, et al. PLINK: a tool set for whole-genome association
and population-based linkage analyses. Am J Hum Genet 2007;81(3):559-75.
30. http://pngu.mgh.harvard.edu/purcell/plink/.
31. McLaren W, Pritchard B, Rios D, et al. Deriving the consequences of genomic variants with
the Ensembl API and SNP Effect Predictor. Bioinformatics 2010;26(16):2069-70.
32. Lee S, Abecasis GR, Boehnke M, et al. Rare-variant association analysis: study designs
33. Liao D. Emerging roles of the EBF family of transcription factors in tumor suppression. Mol
Cancer Res 2009;7(12):1893-901.
34. Tao YF, Xu LX, Lu J, et al. Early B-cell factor 3 (EBF3) is a novel tumor suppressor gene
with promoter hypermethylation in pediatric acute myeloid leukemia. J Exp Clin Cancer Res
2015;34:4.
35. Medina KL, Pongubala JM, Reddy KL, et al. Assembling a gene regulatory network for
specification of the B cell fate. Dev Cell 2004;7(4):607-17.
36. Siponen MI, W isniewska M, Lehtio L, et al. Structural determination of functional domains in
early B-cell factor (EBF) family of transcription factors reveals similarities to Rel DNA-binding
proteins and a novel dimerization motif. J Biol Chem 2010;285(34):25875-9.
37. Fang S, W ang Y, Chun YS, et al. Association of Common Genetic Polymorphisms with
Melanoma Patient IL-12p40 Blood Levels, Risk, and Outcomes. J Invest Dermatol
2015;135(9):2266-72.
38. Yokoyama S, W oods SL, Boyle GM, et al. A novel recurrent mutation in MITF predisposes
to familial and sporadic melanoma. Nature 2011;480(7375):99-103.
39. Bertolotto C, Lesueur F, Giuliano S, et al. A SUMOylation-defective MITF germline mutation
Funding: These studies were supported in part by grants from the National Institutes of Health
(K24-CA149202, P01-CA163222, U54 HG003067). A.S. was funded by the European Union
(European Social Fund – ESF) and Greek national funds through the Operational Program
‘‘Education and Lifelong Learning’’ of the National Strategic Reference Framework (NSRF) -
Research Funding Program: Aristeia I – 1094. G.J. was funded by The Swedish Cancer Society
and the Swedish Research Council. W e also want to thank the patients for their participation in
these studies and the generous donors to the MGH Millennium Fund for Melanoma and the MGH
F
IGUREL
EGENDSFigure 1. Study cohorts. (a) Cutaneous melanoma and ocular melanoma cases used in analysis.
Genetically-enriched probands as defined in the Supplementary Methods. (b). Principal component
analysis using the PCA module in PLINK; cases showing close matching with European controls.
(c) Histogram of common synonymous SNPs between cases and controls and observed:expected
ratios. MPM, multiple primary melanoma; CM, cutaneous melanoma; OM, ocular melanoma; PCA,
principal component analysis; SNPs, single nucleotide polymorphisms; TCGA, The Cancer
Genome Atlas; repl, replication study
Figure 2. Mutational landscape of melanoma. (a). Manhattan plot showing gene-based
associations across all loci. Genome-wide significance is indicated by solid line. Genes which
show near-significant associations fall within the shaded region (p<10E-4). (b). Calculated -log10(P
values) for genes in both CM and OM analyses. BAP1 and CDKN2A clearly show strong
preferential associations with OM and CM, respectively.
Figure 3. EBF3 validation. (a). Copy number profile of EBF3 (shaded red box) and various
melanoma drivers among TCGA tumor specimens. Median EBF3 copy number is significantly
lower than all other genes (p=2.0E-151). (b). EBF3 expression is lower in a panel of benign nevi
compared to primary melanomas (p=0.005). (c). Loss of EBF3 expression is associated with worse
overall survival in 125 metastatic stage III melanoma patients from Lund University Medical Center
(p=0.04) and 349 TCGA metastatic melanoma patients (p=0.10). (d) EBF3 expression is
significantly different between the molecular subtypes of melanoma with the lowest levels in the
MITF-hi (pigmentation; Lund) subclass and highest levels in the MITF-lo subclass (TCGA). (e)
TCGA data sets. (f) Induction of EBF3 in G-mel and UACC-62 cells using a Tet-responsive
promoter shows a reduction of MITF protein levels. Dox, doxycycline.
Figure 4. Functional accreditation of EBF3. (a). Dose dependent arrest of the LOX, UACC-62
and A375 cell lines with EBF3 upregulation by doxcycyline. (b). 3D spheroid formation is
dramatically reduced by the induction of EBF3. (c). Constitutive overexpression of EBF3 in A375
cells led to a profound suppression of tumor growth in nu/nu mice. Vec, vector; Dox, doxycycline;
Table 1- Melanoma Case/Control and TCGA Replication (Variants with MAF<0.01)
Primary Cohort TCGA Replication Cohort U.K. EBF3 Replication Joint Odds Ratio#
Gene Method CM CASES
(N=273)
CONTROLS (N=7629)
P-value TCGA CM
(N=379)
CONTROLS (N=3563)
P-value Sanger CM
(N=159)†
UK10K (N=4769)
CDKN2A PTV burden 5 0 6.16E-08* 2 0 9.31E-03 - - -
ACTR8 C-alpha 7 56 2.18E-05 5 26 0.143 - - -
ECHDC1 C-alpha 6 32 3.73E-05 1 14 0.833 - - -
COL11A2 PTV burden 4 3 5.42E-05 0 4 0.6 - - -
DIP2B C-alpha 21 272 7.15E-05 4 78 0.2 - - -
EBF3 C-alpha 4 14 8.22E-05 3 7 4.75E-04 2 21 4.64 (95%CI: 2.21-9.72)
OM CASES (N=99)
CONTROLS (N=7629)
P-value TCGA OM
(N=47)
CONTROLS (N=3563)
P-value
BAP1 PTV burden 4 3 3.83E-06 1 1 0.0264
IAH1 C-alpha 6 68 2.27E-05 0 31 -
NHLRC3 C-alpha 10 183 6.88E-05 0 84 -
RSRC1 C-alpha 5 44 1.00E-04 0 18 -
PAPOLG C-alpha 6 47 1.00E-04 0 21 -
Abbreviations: CM, cutaneous melanoma; OM, ocular melanoma; TCGA, The Cancer Genome Atlas; *, genome-wide significant;
† Melanoma kindreds of British ancestry were included to approximate the UK10K control collection. The U.K. replication included 77 cases (66 families) from Leeds, U.K., 56 cases (9 families) from Sydney, Australia and 27 cases (6 families) from Queensland, Australia. A p.N455S mutation was found in one Leeds family (1/2 cases positive for mutation) and a p.G21S mutation was identified in one Sydney family (2/6 cases positive for mutation).