Rochester Institute of Technology
RIT Scholar Works
Theses
Thesis/Dissertation Collections
1999
Modeling and simulating chemical weapon
dispersal patterns in DIRSIG
Peter Arnold
Follow this and additional works at:
http://scholarworks.rit.edu/theses
This Thesis is brought to you for free and open access by the Thesis/Dissertation Collections at RIT Scholar Works. It has been accepted for inclusion
in Theses by an authorized administrator of RIT Scholar Works. For more information, please contact
.
Recommended Citation
Coordinator, M.S. Degree Program
Modeling and Simulating Chemical Weapon
Dispersal Patterns in DIRSIG
by
Peter Arnold
B.S. Imaging Science
Rochester Institute of Technology, Rochester NY
1997
A thesis submitted in partial fulfillment of the
Requirements for the degree of Master of Science
In the Chester
F.
Carlson Center for Imaging Science
Of the College of Science
Rochester Institute of Technology, Rochester NY
1999
Signature of Author:'-
_
Accepted
by:
I_t-t-/_/---'-'/-r-/_61_~_
I
{
CHESTERF.CARLSON
CENTER FOR IMAGING SCIENCE
COLLEGE OF SCIENCE
ROCHESTER INSTITUTE OF TECHNOLOGY
ROCHESTER, NEW YORK
CERTIFICATE OF APPROVAL
M.S. Degree Thesis
The M.S. Degree Thesis of Peter S. Arnold
has been examined and approved by the thesis committee
as satisfactory for the thesis requirement for the
Master of Science degree
Dr. John
R.
Schott, Thesis Advisor
Dr. Joseph P. Hornak
Mr.
ScottD. Brown
Mr. Rolando V. Raqueno
THESIS RELEASE PERMISSION
ROCHESTER INSTITUTE JOF TECHNOLOGY
COLLEGE OF SCIENCE
CHESTER F. CARLSON
CENTER FOR IMAGING SCIENCE
Title of Thesis:
Modeling and Simulating Chemical Weapon Dispersal Patterns in DIRSIG
I,
Peter S. Arnold, hereby grant permission to Wallace Memorial Library of
R.IT.
to
reproduce my thesis in whole or in part. Any reproduction will not be for commercial
use of profit.
Signature
---=)J4-I--=-/.;..r.ll....:::()~():....__
_
Modeling
andSimulating
Chemical Weapon Dispersal Patterns in DIRSIG
Abstract
Fieldable
thermal
infrared
hyperspectral
imaging
spectrometershave
madeit
possibleto
design
and construct newinstruments for
better detection
ofbattlefield hazards
such aschemical weapon clouds.
The
availability
of spectroscopic measurements ofthese
cloudscan
be
used notonly for
the
detection
andidentification
of specific chemical agentsbut
also
to
potentially quantify
the
lethality
ofthe
cloud.The
simulation of chemicalweapondispersal
patternsin
a syntheticimaging
environment offers significantbenefits
to
sensordesigners. Such
an environment allowsdesigners
to
easily
develop
trade
spacesto test
detection
and quantification algorithms withoutthe
needfor
expensive anddangerous
field
releases.This
researchfocuses
onthe
implementation
ofa generic gasdispersion
modelthat
has
been integrated into
the
Digital
Imaging
andRemote
Sensing
Generation
(DIRSIG)
model.
The
gas cloudmodelutilizes a3D Gaussian distribution based
ontheory
to
predict
factory
stack gas plumes.The
modelincorporates first
orderdynamics (drift
anddispersion)
to
drive
the
macro-scale clouddevelopment
and movement.The
model also attemptsto
accountfor
turbulence
by
using fractal fractional Brownian
motiontechniques to
reproducethe
micro-scale varianceswithinthe
cloud.The
cloudpath-length
concentrationsarethen
processedby
the
DIRSIG radiometry
sub-modelto
compute
the
emissionandtransmission
ofthe
cloudbody
on a per-pixelbasis.
Example hyperspectral image
cubescontaining
common agents and release amounts arepresented.
Time lapse
sequences are also providedto
demonstrate
the
evolution ofthe
cloud over
time.
Finally,
recommendationsandlimitations
ofthe
model arelisted
for
Acknowledgments
I
wouldlike
to thank
allthose
whohelped,
supported,
putup
withme,
gavemeideas,
andbrain
stormedin
the
evolutionandfinalization
ofthis
research.Dr. John R.
Schott,
whose suggestions and guidance made
it
possiblefor
meto
further my
education.Mr.
Scott D.
Brown,
who spentmany hours modifying
DIRSIG,
explaining
DIRSIG,
andbrain
storming ideas
and concepts crucialto the
development
ofthe
gas cloud model.Believe
me,
if
there
everis
a nexttime
I
willuseLATEX. Mr.
Rolando V. Raquefio for
his
help
withC-shell scripting
andspectrally
correlated noise.Dr. Joseph P. Hornak for
our
insightful discussions
overthe
chemistry
and physicsbehind
gasdispersion
andabsorption.
Ms. Julia A. Barsi for
being
afriend,
study
partner,
andapersonI
canbounce
ideas
off of.Thanks
for
letting
mefinish before
you!Mr. John
P.
Knapp
for
allthe
late
nightstudy
sessionsexplaining Roger's homework
problems.Stephanie
C.
VanGorden
for making
the
DIRS
lab
afun
placeto
work.My
girlfriend,
Shelby,
for her
love
and support.Without
youI
wouldhave
nevermadeit!
Finally,
to the
DIRS
group,
agreat
bunch
ofpeople.I
am proudto
have
workedwith such aninsightful
andhelpful
crew.
In
such a smallcommunity I
am sure ourpathswill crossagain.Take
care.Dedication
No
manis
anisland,
entire ofitself;
every
manis
a piece ofthe continent,
a part ofthe main;
if
a clodbe
washedaway
by
the sea,
Europe is
the
less,
aswellasif
apromentory
were,
as well as
if
a manor ofthy
friends
or ofthine own;
any
man'sdeath diminishes
me,
because I
aminvolved
in
mankind;
and
therefore
never sendto
know
for
whomthebell
tolls;
it
tolls
for
thee.
-John
Donne
This
work
is dedicated
to
my
mother and
father.
Thank
you
for
your
love
Table
of
Contents
1
Introduction
5
2
Radiation Propagation
9
2.1
Interaction Between Light
andMatter
9
2.1.1
Gas Absorption
9
2.1.2
Thermal Self-Emission
18
2.1.3
Atmospheric Considerations
andSimulation
20
2.1.4
Self-emission in
theMWIR
(night)
andLWIR
23
2.1.5
Self-emission in
theMWIR
(day)
25
3
Stochastic
Modeling
28
3.1
Probability
Theory: Random Variables
29
3.2
Probability
Theory: Random
Fields
30
3.3
Probability
Theory: Correlation Measures
31
3.4
Random Fractal
Theory
32
3.4.1
Fractional Brownian Motion
32
3.4.2
Spectral
Density
33
3.5
Fractional Brownian Motion Algorithm
35
3.5.1
Spectral Synthesis
35
4
Turbulent Diffusion
38
4.1
Conservation
ofMatter
38
4.2
Probability Density
Functions:
P(x), P(y),
P(z)
41
4.3
The Gaussian Model
43
4.4
Dispersion
Coefficients
44
4.4.1
Lagrangian
Statistics
ofParticle
Motion
44
4.4.2
Pasquill
Stability
Classes
andExperimental Dispersion Coefficients
48
4.4.3
Briggs Plume
orCloud Rise
53
4.4.4
Briggs
Buoyancy
Flux
54
4.4.5
Briggs
Stability
Parameter
56
4.4.6
Briggs Plume Rise Ah
andAhmax
for
Hot,
Buoyant Bent-over Plumes
57
4.4.7
Briggs Plume Rise Ah
andAhmax
for
Cold,
Jet Bent-over Plumes
61
4.4.8
Briggs Plume Rise Ah
andAhmax
for Vertical Plumes
63
4.5
Determining
Cloud Dispersion
andRise Parameters
64
6
Rendering
67
6.1
Raytracing
67
6.2
3D-DDA
68
6.2.1
Ray
Tracing
Gas Clouds in DIRSIG
71
6.3
Noise Artifacts
78
7
Validation
81
7.1
Voxel file
validation81
7.2
DIRSIG
sampling
82
7.3
DIRSIG
debug
images
84
8
DIRSIG
synthetic scenes87
8.1
Examples
87
9
Conclusion
andImprovements
99
10
Appendix A: Voxel Creation Code
102
10.1
Make_blob.cc
andblob.dat
102
10.2
FBm.pro
105
11
Appendix B: DIRSIG Configuration File Changes
108
11.1
Original Configuration File Example
108
11.2
Gas
Model Configuration File Example
112
12
Appendix C:
Creating
Animations
118
13
Appendix D:
Adding
Spectral Noise inENVI
120
13.1
Adding
Spectral Noise
Using
Eigen
Vector-Based Transforms
120
13.2
Adding
Spectrally
Correlated
Noise
Using
aDark
Current
Image
124
13.3
Adding
Spectrally
Correlated
Noise
Without
aDark
Current Image
129
14
Appendix E: Design Experimentfor
Truth Data Via
aBenign Gas
131
14.1
Design Outline
131
Table
of
Figures
Figure 2-1
Characteristics
of
absorption spectra[Schott, 1997]
10
Figure 2-2
Computation
of
theabsorption coefficient[Schott, 1997]
12
Figure 2-3
Toxicity
of
nerve agents[ICA, 1997]
16
Figure 2-4
Toxicity
offire
gases[Babrauskas, 1997]
17
Figure 2-5
Atmospheric
transmission,
solarirradiance,
and earth self-emission spectra[Schott, 1997]
21
Figure 2-6 Sources of
thermalradiation23
Figure 2-7
Relationship
between
termsin
the"Big
Equation1'and
energy
paths associated withtheradiancereaching
thesensor[Schott, 1997]
26
Figure 3-1
Probability
of
observationsfor
a normaldistribution
30
Figure 3-2
Gaussian
2D & 3D
distributions,
withouttexturemap
36
Figure 3-3 Fractional Brownian
motion2D & 3D
texturemaps37
Figure 3-4
Gaussian*Fbm
2D & 3D
distributions
37
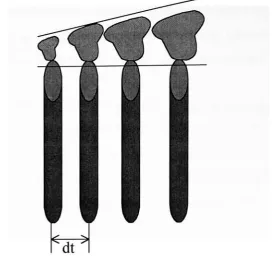
Figure 4-1 Instantaneous
point sources spaced attimeinterval,
dt,
usedtocreate a continuous source40
Figure 4-2 ID Gaussian distribution function
43
Figure 4-3 Particle
motionfrom insantaneous
source45
Figure 4-4 Taylor weighting function ofenergy
spectrumthatcausesdiffusion
asafunction of
timeT
[Blackadar,
1997]
47
Figure 4-5 Pasquill
Stability
Types
[Beychok, 1994]
49
Figure 4-6 McMullen Equation Constants for Rural Diffusion
[Beychok, 1994]
51
Figure 4-7 Gifford Equation Constants for Urban Diffusion
[Beychok, 1994]
52
Figure 4-8 Ambient Temperature Gradient
57
Figure 6-1 Simple
Raytracing
Process
[Fusner, 1999]
67
Figure 6-2 3D-DDA
70
Figure
6-3
Ray
tracing
agas cloud71
Figure 6-4 Transmission: base 10
vsbase
e75
Figure
6-5
CLTvs
Step
Wise
calculationsfor
cloudradiance,part1 of3
76
Figure 6-6 CLTvs
Step
Wise
calculationsfor
cloudradiance,part2 of3
77
Figure 6-9 Noise
andinformation
degrading
effectsin
a remotesensing
system[Kerekes,
1987].
83
Figure 7-1 Geometric
constructionfor sampling
transformationoo
Figure
8-1 X,Y
scalein
meters88
Figure 8-2 Desert
animation sequence89
Figure 8-3 Point
A,
cloud emission withbackground interaction
89
Figure
8-4 Point
B,
Gas
cloudabsorbing
againstatmosphereFigure 8-5 Point
B2,
Gas
cloud emission againstbackground
ywFigure
8-6
Point
C,
high
cloud emission 90Figure 8-7 Point
D,
background
spectra 91Figure 8-8 Point
E,
atmospheric spectra 91Figure 8-9 X,Y image
scalein
meters"2
Figure 8-10 Desert
release,1500
seconds92
Figure 8-11 X,Y
scalein
meters"*
Figure 8-12 Urban
animation sequence94
Figure 8-13 Spectral
"fingerprint"radianceforcenterofGD gascloud
95
Figure 8-14 Spectral
"fingerprint"radiance
for
edgeofGDgas cloud95
Figure 8-15 Absorption
coefficientsof Soman
(GD)
800
-1050
[cm1]
96
Figure
8-16 Soman
(GD)
gascloudtransmissionfor Figure 8-13
andFigure 8-14
96
Figure 8-17 Soman 20
kg
releasebackground:
original,zoom, and spectral profilefor
location indicated
by
crosshairs
97
Figure
8-18 Soman 20
kg
releasehorizon:
original, zoom,and spectral profilefor
location
indicated
by
crosshairs(taken just
abovehorizon)
97
Figure 8-19 Soman 2.5
kg
releasebackground:
original, zoom,spectral profilefor location indicated
by
crosshairs98
Figure
8-20 Soman 2.5
kg
releasehorizon:
original, zoom,spectral profilefor
location
indicated
by
crosshairs(taken just
abovehorizon)
98
Figure 13-1 Increased seperability
and variancedue
to theprojection onto a rotated principle component axis1
Introduction
The
capability
to
digitally
model and simulatechemicalweapon(CW)
cloudsis
crucialin
the
development
ofdetection
methodsdesigned
to
keep
military
andcivilian personnel wellaway
from
chemical weapon release.Both
the
release andmodeling
ofCW
clouds covers abroad
range of complex phenomena.
The
mannerin
whichthe
CW is
released,
the terrain
over whichit
travels, surrounding
buildings,
initial
momentum,
seasonalvariations,
possiblecanopy
structure,
atmosphericpressure,
environmental parameterssuchas solarinsolation,
rain,
andwind speed all effect
the
evolutionofthe
gas cloud.This
research concentratedonly
on a smallportion of
the
muchlarger
picture.The
maingoalwasto
providea simplemodelthat
predictsthe
dispersion,
advection,
dissipation,
concentration,
andtemperature
with respectto time
ofthese
deadly
clouds.Potential
improvements
to
the
model willbe discussed in
the
sectiontitled:
Conclusion
andImprovements.
The CWs
ofinterest
in
this
researchareknown
as nerveagents.All
nerveagentsin
their
purestate are colorless
liquids
atSTP. Nerve
agentsinhibit
the
releaseofthe
enzymeacetylcholinesterase.
This
affects nerveimpulses causing
severemusclecramping
anddeath
by
suffocation.
All
nerveagentsbelong
to the
chemicalgroup
oforgano-phosphorus compounds.They
are stable andeasily
dispersed,
highly
toxic
andhave
rapideffects(2-30 minutes)
whenabsorbed
though
the
skin and viarespiration.[ICA,
1997]
Nerve
agents aretypically
disseminated
in
three
manners.The
first is
to
use aburster
orbinary
When
the
projectileis
fired
the
disc bursts
andthe
two
componentscombine.Rifling
in
the
barrel
givesthe
projectile aspinning velocity
that
mixesthe
nerveagent.The
secondmethodis
to
mixthe
componentsbefore launch
andstorethem
in
aballistic
missilewarhead(200-1000
kg).
The
third
is
to
let
the
agentleak
out andbe dispersed
by
the
airstream.This
researchconcentrates
ondiscrete
sourcesandis
applicablemainly
to
binary
andwarheaddissemination.
However,
continuous sources canbe
treated
asdiscrete
sourcesthat
areclosely
placedtogether.
Therefore any
numberofcontinuoussource plume models couldbe
usedto
modelthe third
casescenario.
Spectral data
was suppliedthrough the
Army's Aberdeen
Proving
Grounds for
the
following
nerve agents:
VX
,Distilled Mustard
(HD),
Soman
(GD),
Sarin
(GB),
andTabun (GA). The
spectral
features
for
these
nerve agents arein
the
mid-wave(MWIR)
to
long
waveinfrared
(LWIR),
4-24(xm. In
this
regionthe
primary
sources ofradiancereaching
the
sensor arethermal
self-emission,
upwelledthermal emission,
background
thermal emission,
and earththermal
emission.
The
self-emission ofthe
gasis dependent
onthe temperature
andemissivity
ofthe
gas.
The
transmission
ofthe
gas willbe dependent
onthe spectral absorbence ofthe
nerve agent.Scattering
is ignored
sinceit is
considered negligible above2.5um.
[Kuo,
1997]
In
this research,
syntheticimage
generation(SIG)
was usedto
simulatethe
CW
cloudsandinvestigate
remotesensing
capabilitiesin detection. The
simulations were runusing Soman
(GD)
althoughany
ofthe
nerveagents couldhave been
used.SIG
usesfirst
principlesfrom
physics
to
produceradiometrically
accurateimages
as seenby
a sensor.SIG
allowsthe
userto
vary
scene andsensorgeometries, wavelengths,
meteorological
conditions,
background
interactions,
and atmospheric profiles withoutthe
needfor
dangerous
and expensivefield
The
rendering
ofthese
synthetic scenes willbe done
withthe
Digital
Imaging
andRemote
Sensing
Image Generation
(DIRSIG)
code.DIRSIG is
aray
tracing
codedeveloped
by
the
Digital
Imaging
andRemote
Sensing
lab
(DIRS)
atthe
Center for
Imaging
Science
atthe
Rochester Institute
ofTechnology
in
Rochester,
NY. It
createsradiometrically
accuratesynthetic
images
for
various sensor platforms[Brown,
1999]1. DIRSIG incorporates
the
Moderate Resolution Transmittance
(MODTRAN)
code[Berk, 1989]
to
modelthe
atmosphere.To
supportthe
higher
spectral resolution needed onthis effort,
the
Fast Atmospheric
Signature
Code
(FASCODE)
[Smith,
1978]
was added as a source of atmosphericparameters.The
pointsof
contact,
generaldescriptions,
documentation
references,
and softwaredownloads for both
MODTRAN
andFASCODE
are available athttp://www-vsbn.plh.af.mil. The THERM [DCS
Corporation, 1990]
thermal
sub-modelis incorporated in DIRSIG
to
predicttime
dependent
temperatures
ofobjects withinthe
scene asinfluenced
by
their
environment.The
simulationof atime
sequencedepicting
the
evolutionof aCW
cloudis
quite complex andrequires
modeling
capabilitiesthat
are stillevolving.This
type
ofsimulationis known
asphysical
dynamic
modeling.The
userdoes
notspecify
the
entirephenomenon,
but
ratherprovides external
forces
andmaterialproperties.The
modelthen
predictsthe
evolution ofthe
position and shapeof
the
gas overtime
based
on physics.The
model presentedin
this
researchdraws
from
theory
usedin
the
morphology
ofsmoke plumes[Beychok,
1994
&
Blackadar,
1997]. The
forms
that
smoke plumes exhibit are a result ofdiffusion
andatmosphericturbulence
due
to
heating
currents and winddeviations. Knowledge based
onmeasurements acquired over along
periodhave been
usedto
successfully
predict smoke plume movement.Traditionally
these
smoke plume modelsuse
Fickian
Diffusion
that
predicts a concentration with aGaussian
orNormal probability distribution function (PDF). The Fick
equation statesthat the
rate of changeproperty,
andthat
in
aninhomogeneous
environmentthe
flux
is
proportionalto the
gradientofthe
meanconcentration.
The
Gaussian
shape ofpredictedplumes and cloudsis
consistent withmost experimental
data
if
sufficient allowanceis
givento
sampling
irregularities
[Blackadar,
1997]. This
technique
describes
the
macroscopicproperties or global shape ofthe
gas cloud.A
fractional
Brownian
motion(fBm)
field is
then
introduced to
addturbulent
small-scaledetail.
Fractional
Brownian
motion canbe
usedto
describe
the
irregular
thermal
motion ofthe
gasmolecules
andfits
underthe
concept offractal geometry
[Crownover,
1995].
At
this time
ablast
modelis
not available.A blast
modelwouldhelp
in
developing
the
initial
kinetic
theory
describing
the
evolution ofthe
gas untilsomeequilibriumwas reached at sometime,
t2
>0. The
model presentedin
this
researchdescribes
the
evolution afterreaching
2
Radiation Propagation
This
sectiondiscusses
the
basic
physicsinvolved
withquantifying
the
radiancefrom
target to
sensor.
This
coversthe
interaction between light
and matter andthe
radiometricequationsinvolved
withthe
remotesensing
of gas clouds.2.1
Interaction
Between
Light
andMatter
2.1.1
Gas Absorption
Different
gasses attenuatelight
at various wavelengths.These
absorptionfeatures
canbe
usedas"finger
prints"which can
identify
the
gas.The field
ofidentifying
these
"finger
prints"is known
as spectroscopy.
The
intensity
and shapeofthese
lines
are afunction
oftemperature,
molecularweight of
the
gasconcentration,
and relative pressure.One important
spectralbroadening
process
is
causedby
the
Doppler
effect,
in
which radiationis
shiftedin
frequency
whenthe
source
is moving
towards
oraway from
the
observer.Doppler
theory
statesthat
frequency
increases
withtemperature
anddecreases
with molecular massaccording
to:
Av
oc-
I
MW
Equation 2-1
where
Av
=widthof absorptionfrequency,
T
=Temperature
[Kelvin],
MW
=gramThe
degree
ofbroadening
is
alsoproportionalto
the
relative pressure[Schott,
1997]. In
the
MWIR
these
absorptionlines
aredue
to
transitions
in
the
vibrationalstate ofthe
molecule.Above 20
urn rotationaltransitions
arethe
dominant
process.Figure 2-1 illustrates
anidealized
absorption spectra.
Figure
2-lb demonstrates
the
effectsofbroadening
causedby
temperature,
pressure,
and molecularweight.Figure 2-lc
representsthe
net effectofoverlap between
the
broadened
spectra.Thus,
discrete
absorptionfeatures
canbe lost due
to
overlap
causedby
broadening.
(a)
Idealized
absorption spectra.a
(b)
Effects
ofbroadening
isolated for
each ofthelines
shownin
(a)
(c)
Cumulative
absorption spectraWavelength
[image:17.543.116.446.261.636.2]For
a more rigoroustreatment
of absorption and remotesensing
seeGoody
(1989).
The
following
is from Schott [1997]:
In
simplifiedform,
we canderive
the
following
relationshipsbetween
the
numberand
efficiency
of absorbers andtheir
effect onthe
propagating beam. At
eachwavelength,
wedefine
the
absorption cross sectionCa
to
be
the
effective sizeofamolecule relative
to the
photonflux
atthat
wavelength.Conceptually,
this
canbe
expressed as:
Ca
=C^
=7rr2^[m2]
Equation 2-2
where
Cg
[m2]
is
the
geometric cross sectionfor
a molecule of radius r[m]
and,
is
a unitless wavelength-dependentefficiency factor
that
is
proportionalto the
molecule's
ability
to
absorbflux. Values
ofCa
canbe derived for
particulartemperatures
and pressuresfrom
experimentaldata
orthrough
molecularenergy
theory,
then
adjustedfor
the
effectsofthe
temperature
andpressure.The
molecule
is
then
assumedto
be
a perfectabsorberoverthat
cross-sectional area.To
computethe
fractional
amount ofenergy lost
perunitlength
oftransit
in
apropagating
beam,
weneedto
know
the
numberdensity
ofthe
molecules.Referring
to
Figure
2-2,
welet
be
the
number ofmoleculesin
a unit volume ofside
dimension
/[m].
/
[m]
length
ofeach side ofthe
unit volume ^
-~
Molecule
with%F
absorptioncrosssection
Ca
-Q-(a)
A
unitvolumecontaining
m'
absorption centers.
We
assumethat
the
mediumhas
alarge
meanfree
path suchthat
in
a smallvolume,
if
we projectthe
)
Projection
of absorbers ontothe
face
ofthe
volumeFigure 2-2
Computation
ofthe
absorption coefficient[Schott,
1997]
len, the
areablocked
(Afc)
by
the
moleculesis
Ah=m'CJm2]
Equation 2-3
tie
areaonthe
face
ofthe
volume(A/)
ontowhichthe
molecules were projectedAf=l2[m2]
Equation
2-4
he fraction
ofthe
face
blocked
by
the
absorbing
molecules(F)
is
F_m'Ca
I2
\m2~\
[m2\
Equation
2-5
'herefore,
the
fraction
amount offlux
absorbedfia
per unitlength
oftransit
(l)
is
a
F
m'
_x
m'
r -i-.
Equation
2-6
/here
V
is
the
unitvolume,
m 'as
the
fractional
amount offlux
lost
to
absorption per unitlength
oftransit
in
apropagating beam.
According
to
Grum
(1979),
for
an element of pathlength
dz[m]
in
the medium,
the
element offractional
flux lost
canbe
expressed as:d
=
-pa(z)dz
Equation 2-7
wherewe
have
madethe
dependence
of/3a
onlocation in
the
media explicit.For
propagation
along
afinite
pathstarting
atdistance
zero where wehave initial flux
Oq
to
distance
z where wehave flux
<E>Z,
wehave
<o
o
=
\-pa
(z)dz
=InO
-In
O0
o
0
=
ln
y^oj
o
Equation
2-8
Making
both
sides powers ofeto
simplify
the
left-hand
side yieldsO
-jPa(z)dzOr
z__e
0Equation 2-9
Recognizing
the
left-hand
side as adefinition
oftransmission
(ratio
offlux
outto
flux
in)
andsolving for
the
simplified case of ahomogeneous
medium,
wehave
0O
-Pajdz
T
=^
=e
=e
-Pazwhich
is variously
known
asLambert's law
orBouguer's law.
The
productpaz
is
generally
referredto
asthe
opticaldepth
(8), i.e.,
Sa=Paz
Equation
2-11
To
this
point wehave
implicitly
assumeda mediacontaining
a singleconstituent.For
ahomogeneous
mediacontaining many
types
ofmolecules,
weintroduce
the
subscripti
to
denote
the
particular constituent.If
we assumethat
the
moleculesinteract
independently
withthe
propagating
flux,
wecanexpressthe transmission
as:
T=
Y[
%.=e~^8' =e~^-z = c~^m^z = e-pz =e~5
Equation
2-12
where
II designates
the
product ofthe transmission
valuesfor
each constituentif
computedseparately,
the
summation(X)
is
over allconstituents,
and weredefine/3a
=Zf}cci
to
be
the
composite absorption coefficient andSi
to
be
the
composite opticaldepth due
to
absorption.[Schott,
1997]
Finally
the
relationship between
absorptionandtransmission
is
expressed as:A
=-ln(x)
Equation 2-13
The
spectral absorption"finger
print"
is
afunction
ofthe
absorptioncoefficient,
concentration ofthe gas,
andthe
path-length over whichthe
absorption was measured.The
rawdata
wasprovided
through
the
Army's Aberdeen
Proving
Grounds,
MD. For
publisheddata
seeHoffland
(1985). The
rawdata
provided units of absorptioncoefficients
in
liters/(gram*cm),
concentration
in
grams/liter,
and path-lengthin
meters.To
determine
absorptionfrom
Bouguer's
A
=/3aCz
Equation
2-14
Where
/?=
absorption coefficient[L/g*cm],
C
= concentration[g/L],
andz=path-length ofthe
cell
[m]
The
concentration of gasesis
often givenin
parts per million[ppm]
andis known
asthe
volume-mixing
ratio(VMR). The definition
of1
ppm of a gas meansthere
is
one partofgas per1
millionparts of air.
The VMR
canbe
computedthrough the
following
derivation:
concentration
[g/L]
molar
density
[mol/L]
=molecular weight
[g/mol]
Equation
2-15
, , . rmol
, _,
. rmol
,
1000[L]
molar
density
[
=-] = molardensity [
]
* =m
L
l[m
]
Equation
2-16
rmoL
. . ., ,
VMR
[ppm]
= molardensity
[=-]*
0.0224volume
ofideal
gas@
STP[
]
mJmol
*
1000000
Equation
2-17
A
similar conversionis
neededto
convertthe
absorptioncoefficientto
1/ppm-m:
L
^^.i^r i*Um3]
f5a[
]
*molecularwt[-=]
1
g*cni mol1000[L]
*100[cm]ppm-m
00224,
normalgasvolume@STP[i11-]*1000000
[mJ
mol
STP
standsfor
standardtemperature
(273.15
K)
andpressure(1 ATM). The
gasvolumecanbe
adjusted
for
varioustemperatures
andpressuresby
using
the
ideal
gaslaw:
m
Gas Volume
[
]
molR[!SL].TIK]
fm,,
mol*K .,.
tm
J
P
[atm]
1000[L]
Equation
2-19
Where R
=Universal
gasconstant=kNa
=Boltzmanns's
constant*Avogadro's
number=8.2057e-2
[L*atm/mol*K],
T
=temperature
[K],
andP
=pressure[atm].
The
following
table
illustrates lethal dosages
of4
common nerve agents.This
shouldhelp
the
reader understand
the
extremetoxicity
ofthese
substances.For
gases,
the
toxicity
is
expressedby
LC^,
whereL
standsfor
lethal,
C
standsfor
concentration,
t
standsfor time,
and50
means50%
ofthe
exposed population willdie due
to their
injuries.
Thus,
Tabun
vaporat200
[mg/m3]
for 1
minutehas
the
sametoxicity
as a100
[mg/m3]
for
two
minutes.For liquid
exposure,
the
toxicity
is
expressedby
LD50,
whereD
standsfor dosage
andallother symbols arethe
same.Agent
LCjjo
[mg*min/m3]
[ppm*min]
LD50
[mg]
Tabun,
GA
200
27.64
4000
Sarin,
GB
100
15.99
1700
Soman,
GD
100
12.29
300
VX
50
4.19
10
By
contrastthe
following
table
illustrates
the
toxicity
of someprimary
gasesfound in fires. The
reader should
be
awarethat
for fire
toxicity
data
the
exposure periodnormally
usedis 30
minutes.
If
the
biological
effectis
linear (Haber's
Law)
then
these
numbers wouldbe
multipliedby
30
to
giveLC^q
[ppm*min].
I.e.,
The
lethal
concentrationof carbon monoxidefor
anexposure of
1
minute wouldbe 3000
[ppm]
*30
[min]
=90000 [ppm*min]. Almost
all gasesshow
deviations
from
this
simplerelationship,
but for
roughestimating
purposesit
canbe
usedif
better data is
unavailable.[Babrauskas,
1997]
Gas
LC^
[ppm*30
min]
Carbon Monoxide
3000
Ammonia
9000
Hydrogen Chloride
3700
Acetic Acid
11000
2.1.2
Thermal
Self-Emission
The
emissivity
characterizesthe
radiating
efficiency
of a surfaceandis
materialdependent.
It
is
a unitless numberwith range
0
->1,
with1
being
aperfect emitter.According
to
the
secondlaw
of
thermodynamics the
rate ofemissionat agivenwavelengthmust equalthe
rate ofabsorptionat
that
wavelength.Thus,
all ofthe
incident
radiation onthe
ideal
emitterwouldbe
absorbed.Since
noradiationis
reflectedfrom
the
surfaceanideal
emitteris
often calledablackbody.
The
spectralradiant exitancefrom
ablackbody
has
the
following
three
generalfeatures:
1. At
a giventemperature,
the Stefan-Boltzmann
Equation
givesthe total
exitance:w w A
M
Hyl
= <*[-2^1
*T
[K]
nrmzK4
Equation 2-20
where a=
Stefan-Boltzmann
constant=5.67e-8
[W/(nrK4) ]
andT
=[Kelvin]
2. If
the temperature
is
increased,
the
spectralradiant exitanceincreases
for every
wavelength.
3. The
spectral exitancehas
a single peakthat
shiftsto
smaller wavelengths astemperature
increases:
. _
A[\im
K]
max
-T[K]
Equation
2-21
Where
A
=Wien
displacement
constant
=2898
[|im]
andT
=As
afunction
of wavelengththe
Planck Equation
expressesthe
spectral radiant exitancefrom
ablackbody:
M(A)bb
=l7^_
[W/(m2Ami)]
ti(eKXT -1)
Equation 2-22
Where
A,
=wavelength[Jim],
h
=Plank's
constant6.6256e-34 [joules
sec],
c= speedoflight
3e8
[m/s],
T
=temp [K],
K
=Boltzmann
gas constant1.38e-23[joules/K]
The Planck
equation canbe
expressedin
terms
ofspectral radiancefor Lambertian
surfaces as:K m sr fim
Equation 2-23
The emissivity is
then
defined
as:Mbb(A,T)
Equation 2-24
Where
M(A,,T)
=radiant exitanceof an object at a given wavelengthandtemperature
andFor
a gas volumethe
emissivity
canbe
expressedas afunction
ofthe transmission
loss due
to
absorption as:
e(k)=l-x(X)= l-e**1
Equation
2-25
Where
x(X)=transmittance
ande(X)
=emissivity
2. 1
.3Atmospheric Considerations
andSimulation
Atmospheric
absorptionresultsin
the
loss
ofradiantenergy
to
atmosphericcomponents.In
the
LWIR
the
mainabsorptionconstituents areH20, Os,
andC02. Areas
wherethe
atmospherictransmission
is high
areknown
asatmosphericwindows.In
thermal
sensing
the
atmosphericwindows exist at
3-5|im
and8-14
fim.In
the
8-14
^imregion solar photoncontributionis
lost
in
the
noiselimits
and canbe ignored. In
the
3-5
|j,mregion solarphotonandthermal
photoncontribution are of
the
sameorder of magnitude.Therefore,
in
the
3-5
|im region underdayligl
conditions
both
solar andthermal
photons mustbe
considered.Figure 2-5 illustrates
solarvs.thermal
photon contribution with respectto
atmosphericlE
+4^-Exoatmospheric
solarirradiance
[image:28.543.61.493.51.289.2]Wavelength
[p:m]
Figure 2-5 Atmospheric transmission,
solarirradiance,
andearth self-emissionspectra[Schott,
1997]
Figure 2-5
showsthe
selection ofasensormustconsiderthe
atmosphericwindow,
spectralsensitivity
ofthe
sensor,
along
withsource,
magnitude,
andspectral composition ofthe
photonsavailable
[Lillesand,
1994].
For
the
work reportedhere,
solar and self emmisivecalculations areincluded
at allwavelengths,
however,
scattering
effectsin
the
gasplumeare notincluded.
Scattering
is
typically
insignificant
in
the
MWIR
andLWIR
andshould notintroduce any
significanterrors when
the
clouddroplets
aresmall compared withthe
imaging
wavelength.The
atmosphere willbe
modeledusing
the
atmospherictransport
codeMODTRAN for delta
wavenumber
increments
>2 [cm1]. This
programis
acomputationally
rigorous radiationtransfer
algorithmthat
modelsthe
spectralabsorption,
transmission,
emission,
andscattering
characteristicsof
the
atmosphere.MODTRAN
assumesthat the
atmosphereis
a set ofmodel
atmospheres
orit
canbe
characterizedby
radiosondedata
collectedfor
aspecificatmosphere.
In
the
regions ofinterest for
this
research(8-14(im
and3-5(xm
atnight)
where solarphotons are
ignored,
the
radiancereaching
the
sensorcanbe
approximatedby:
N
N
i=l
i=lN
7=2+1
Equation
2-26
Where
xa
=transmission through the
ith
layer along
a pathlength z,
atwavelengthX,
Lm=
blackbody
spectral radiance withtemperature
T,
ofthe
/th
layer.
High
resolutionruns,
for
wave numbers <2
[cm1],
usedFASCODE.
This
modelis
aline-based
method versus
MODTRAN band-based
method.The
nexttwo
sections coverthe
thermal
governing
equationsfor
remotesensing
of gaseous2. 1
.4Self-emission
in
the
MWIR
(night)
andLWIR
Thermal
sources arethe
significant contributorsin
the
MWIR (at
night)
andLWIR. The
radiance
reaching
the
sensoris
afunction
ofPlanck's
Equation,
Equation
2-22,
modifiedby
the
emissivity
as afunction
ofwavelength,
defined
as one minusthe
transmission,
Equation 2-25.
The
primary
sources ofinterest
are: gas cloud self-emission(LSe),
upwelledthermal
radiance(LU)
, reflecteddownwelled
thermal
radiance(LD),
reflectedbackground
(LBe)
and earththermal
radiance
(Lee).
V-<
The
thermal
radiancereaching
the
sensor withoutthe
gascloudcanbe
expressed as:L
_LEe
+
LD
+
LBe
+
LU
eLEE
+
(FEDE+(l-F)EB/-TC.T2
+
l-Ve
Equation
2-27
Where rd
=diffuse
reflectance(constant
at allangles),
x2
=transmission
from
target
to sensor,
F
=shape
factor,
andE
=irradiant
[w/m2]
The
earth self-emissionterm
(Ee)
dominates
this
expression with significantcontribution
from
upwelled radiance(Ue).
The
reflecteddownwelled
radiance(De)
and reflectedbackground
radiance(Be)
terms
aretypically
muchsmaller,
though
still significant contributorsif
measurement accuracy's oftenths
of adegree
aredesired. The
relativeimportance
ofthese
reflectedterms
willdecrease
with
increasing
emissivity
(decreasing
reflectivity),
but
in
generalthey
will notbe
negligible until
emissivity
values approach0.99.
The
relativeimportance
ofthe
downwelled
radiance andthe
background
radianceis
controlledby
the
shapefactor (F). The
shapefactor
representsthe
fraction
ofhemisphere
abovethe target
that
is
sky.For nearly horizontal
unobstructedsurfaces,
the
shapefactor F
approaches
1.0
andthe
background
term
becomes
negligible.[Schott,
1997]
The
temperature
ofthe
gas cloudwilldetermine
the
blackbody
exitance as expressedby
Planck's
Equation,
Equation
2-22. The
blackbody
exitance multipliedby
the
emissivity
as afunction
ofX
determines
the
gas cloud self-emission.In
simpleform
this
canbe
approximated as:LC=(l-Tg)Lrg
Equation 2-28
Where
xg
=effectivetransmittance
ofthe
gas andL,
=radiancedue
to the temperature
ofthe
gasEquation
2-27
withthe
gas cloudthen
becomes:
L
=LE+(FZ<D
+
(1-F)Z<B)^K
Equation 2-29
2.1
.5Self-emission
in
the
MWIR
(day)
The MWIR has
a significant solar andthermal
contribution.Hence both
solar andthermal
radiance must
be included
whensolving for
total
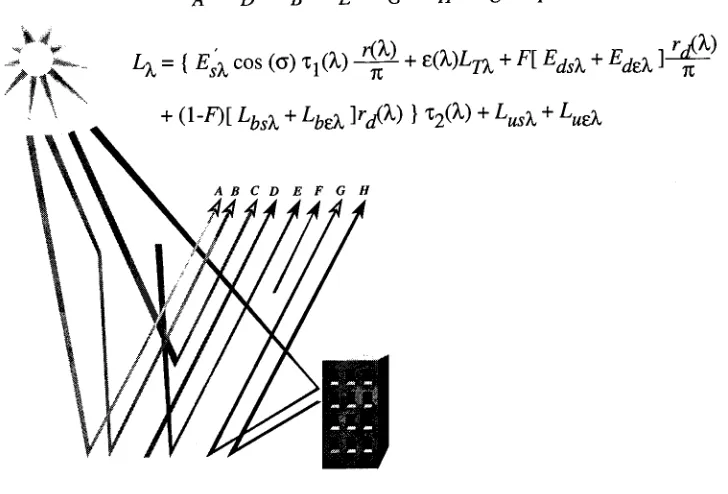
radiance.Figure
2-7 includes
the
"Big
Equation"which calculates
the
solar andthermal
radiancereaching
the
sensor.Figure 2-7 illustrates
the total
radiancereaching
the
sensorfrom
atarget
onthe
groundfor both
solar and
thermal
photons.Path
A is
the
exoatmospheric solarradiance,
Path B
is
skylightordownwelled
radiance,
Path C is
upwelledsolarradiance,
Path G
is background
solarradiance,
Path D is
thermal self-emission,
Path
E is downwelled
thermal emission,
Path
F
is
upwelled%4,
/ftv
LX
=
{
EsX
cos(0)
h(k)
-*&+
e(l)Ln
+F[
EdsX
+EdeX
]-^}+
(1-F)[
LfaA>
+L^
]r^)
}
x2(A)
+LMAr
+LUX
[image:33.543.84.448.47.294.2]A B C D E F G H
Figure 2-7
Relationship
between
terms
in
the
"Big
Equation" andenergy
pathsassociated withthe
radiancereaching
the
sensor[Schott,
1997]
All
pathsin Figure 2-7
areincluded in
the
DIRSIG
simulations.In
additiona gas cloud willattenuate
both
thermal
andsolarphotons and emitthermal
photons asdiscussed in
section6.2.1.
Because
the
focus is
onthe
MWIR
andLWIR
wherescattering is
typically low,
scattering
effectsfrom
the
gas cloud arenotincluded. This
should notintroduce any
significant errorswhenthe
cloud
is very
gaseous,
i.e.
gasdroplets
are small relativeto
imaging
wavelength.However,
if
asignificant number of
droplets
orlarge
particles areassociated withthe
cloudthen
scattering
should
be
consideredfor future
upgrades.The
previous sectionslay
down
the
physics(the
"Big
equation")
involved
withquantifying
the
energy
emitted and absorbedby
a gas cloud.They
alsodiscuss
the
energy
contributionsfrom
background
and atmosphericinteractions.
The
sections propose waysto
calculate andquantify
window constraints.
The
readershouldkeep
in
mindthat
DIRSIG
andMODTRAN
or3
Stochastic
Modeling
Convective
atmospherictransport
anddiffusion
effectsonaerosol concentrationsin
plumes canbe
represented
with aGaussian distribution. This Gaussian
modelvisualizes aerosolplumesassmooth
distributions
resulting from
time-averaged
contributionsofturbulence
to the
meanflow.
Any
observer of aerosol plumesknows
that
the
distribution
is
notperfectly Gaussian but has
some random
behavior. The behavior
of a probabilisticsystemcannotbe
predictedexactly but
the
probability
of certainbehaviors is known. Fractals
andmathematicalchaoslay
the
foundation
for
numericaltechniques
that
canbe
usedto
generatespatially
correlated randomfields.
The fluctuations
that
occurwith chaossets areonly seemingly
random.This
pseudo-randomness spawns
from
a sensitivedependence
oninitial
conditions.The
input
parametersintroduce
someerror orrandomnessbut
the
overall processfollows
somedeterministic
outcome.Fractal
statistics areusedto
generate superpositions of randomfluctuations
overdifferent
time
scales.
This
randomness canbe
usedto
simulateturbulence.
As
pointed outby
Sakas
(1993);
Mandelbrot
(1975)
andLovejoy
(1985)
proposedthat
staticimages
ofturbulent
fields
canbe
regarded as
fractals
withaHurst
exponent of0.7. This
correspondsclosely
to
experimentalvalues of actual
turbulence
measuredby
Sreenivasan (1991).
The
following
sections attemptto
describe
afamily
of randomfractal functions known
asfractional Brownian
motion(fBm). FBm has
been
usedin
many
applicationsranging
from
physical sciences and
engineering
to
artistic applications.For
a morein-depth
discussion
offractals,
chaos,
andfBm
seeTompson
(1989),
Crownover
(1995),
andYaglom (1986). The
3.1
Probability
Theory: Random Variables
The
set of all possible outcomesfor
a given observationis
calledthe
sample space.A
randomvariable
X
orin
generalthe
variateX
is
a variablethat
cantake
onany
valuein
the
sample space.The
overallbehavior
of a random variateX
canbe
described
by
its probability
distribution
function
(PDF). The PDF is
afunction
P[X=x]
meaning "the
probability
of variateX
equalto
x"defined
by:
pdf=
j"f(x)dx
=l,
0<f(x)<l
Equation 3-1
In
practice,
the
statistics ofthe
random variateX
are usedto
provide usefulinformation. These
statistics
include
the
expectationormean,
standarddeviation,
variance,
and correlation.The
mean
is defined
as:jl
=E[x]=
j"xf(x)dx
Equation 3-2
The
varianceis
a measure ofhow
the
valuesX
aredistributed
aroundthe
mean:cr2
=
Var[x]=
J(x-/z)2f(x)dx
=E[(x-fif]
=Equation
3-3
The
standard
deviation
a
is
equalto the
positive square root ofthe
variance.It is
alinear
measure
ofhow
the
valuesX
aredistributed
aroundthe
mean.For
selected values ofNa
the
following
probabilities
for normally
distributed
observationsare obtained:Nc
PGu-N(T<X</z
+
Ncr)
la
0.6826
2a
0.9544
3a
0.9974
Figure 3-1
Probability
of observationsfor
a normaldistribution
Figure 3-1
indicates
that
about68
percent ofnormally
distributed
observations arebetween
\i-a
and
|X
+a;
about95
percent arein
the
interval
givenby
jll2a
and almost all are withinthree
standard
deviations
ofthe
mean(I.3.2
Probability
Theory:
Random
Fields
A
randomfield
is
a random processthat
returns a random variate as afunction
of somediscrete
variable
in 2
or moredimensions.
A
dynamic
(time
driven)
3D
gas cloudis
an example of arandom
4D
field.
A
gas cloud represents a3D-density
map
andfor
eachfixed time,
t
>
0,
aninstance
ofthe
previous3D
randomfield
is
observed.
This
randomfield
canbe denoted
by
R(t)
with spatial
dimensions
x, y,
z as afunction
oftime,
t.
This
introduces
\i
=3.3
Probability
Theory: Correlation Measures
A
randomfield
that
for
each value oftime,
t
>0
, returns anindependent
random variableis
known
as white noise.Independence
meansthat
a value attx
=0 has
no effect on avalue att2
>
0. This
type
of randomfield has
no correlationfrom
valueto
value.The
correlation measureshows
how
the
values ofthe
randomfield
R
attwo
given positionst[
andt2
are related.There
arethree
common statistical measures of correlation:variance, covariance,
and normalizedcovariance.
The
varianceis
the
mean squaredifference
ofthe
randomfield
attime
tj
andt2:
y(t1,t2)
=-E[(R(t1)-R(t2))2]
Equation 3-4
The
covarianceis:
Cov(t,
,t2 )
=E[R(t, )R(t2
)]
n(t,
)n(t2
)
Equation 3-5
Positive
values ofthe
covarianceindicate
values ofthe
randomfield
tend to
be
close.Negative
values
indicate
alarge difference
in
values.The
normalized covarianceorcorrelationfunction is
r\wt t v
Cov(tt2)
Cor(t15t2)=
a(t,)a(t2)
All
these
basic functions
are usedto
describe
the
statisticsofthe
randomfield.
3.4
Random
Fractal
Theory
3
.4.1
Fractional
Brownian Motion
In
onedimension
fBm,
BH(t),
is
a singlevaluedfunction
oftime,
t.
Its
increments
BH(t2)
-BH(ti)
have
aGaussian distribution:
f(x)
=^exp[
]
aV27t
2a
Equation
3-7
And
variance:Iff y(t)a\t2-tA
Equation
3-8
The
parameterH,
known
asthe
Hurst
Exponent,
has
valuesbetween 0
->1
.A
value ofH
=1/2
is known
asclassicalBrownian
motion.The
derivative
of classicalBrownian
motioncorresponds
to
uncorrelatedGaussian
whitenoise andhas
independent
increments. For H
>
1/2
there
is
apositive correlationboth
for
the
increments
andits derivative.
For H
<1/2
thereis
anegative correlation.
H
is
relatedto
the
fractal dimension
D,
by
H
=2
D. This
relation statesthat
the
fractal
dimension, D,
lies
somewherebetween
1,
aline,
and2,
a plane.Since
the
variance
depends only
onthe
difference
between
t,
andtl5
and notthe
actualvalues, the
directions
arestatistically
equivalent.The
randomfield
also possesses a statisticalscaling
behavior known
as self-affinity.That
is,
if
the time
scalet
is
changedby
afactor, S,
then the
increments
ofthe
variance changeby
afactor,
S2H:
Y(St)
=S2H[y(t)]
Equation
3-9
Hence,
unlikestatistically
self-similarcurves,
fBm
requiresdifferent scaling factors in
the two
coordinates.
3.4.2
Spectral
Density
A
randomfunction, R(t)
in
time
is
often characterizedby
the
spectraldensity,
S(v). The
spectraldensity
givesfrequency,
v,
information
aboutthe time
correlationofR(t). When
S(v)
increases
steeply
atlow
v,
R(t)
variesmore slowly.It
canbe
shown(Peitgen,
1988)
that the
powerspectral
density, S(v),
offBm in
onedimension has
the
following
relation:S(v)4-4ir7
,1<D<2Equation 3-10
Where
(3
=2H
+1
andfractal
dimension,
D
=1
+(3
p)
/ 2
=2
H,
v =sqrt(Ix2),
I
=0, 1,
2,
.. .size of
X dimension.
This
result agrees withthe
concepts ofspectraldensity
and Wiener-Khintchine
relationto
is
decreased
(higher
D),
higher
values ofS(v)
athigh
v
valuesoccur andlow
valuesofS(v)
occur at
low
v values.This
resultsin
a curvethat
is
closerto
a plane.As
p
is
increased (lower
D),
lower
values ofS(v)
athigh
v
valuesoccurandhigh
valuesofS(v)
occuratlow
vvalues.This
resultsin
a curvethat
is
closerto
aline.
Extending
fBm into 2
and3 dimensions has
the
following
relations:SW^r^F
,2<D<3Where
v =sqrt(Ix
+L
)>
1
=0,
1,2...
size ofdimension
X
andY
Equation
3-11
S(v)i^r7
,3<D<4Where
v =sqrt(Ix2
+
1
2+Iz2),
1
=0,
1,2...
size ofdimension
X,
Y,
andZ
Equation 3-12
In
generalfor Euclidean
dimension, d,
P
=2d
2D
+3 andD
=d
+1
-H.
I.e.,
d
=l-line,
2-surface,
3-cloud,
4-cloud
time
series,
etc...and0
<H
<1
the
Power Spectral
Density, S(v)
is:
S(V)
CC n-r-ra
; : , ,. ,nj,w.., ,d<
D
<d
+1
v^-1 sqrt(I,2
+
Iy2 +...ld2)2d-2D+3Hd-l)Equation
3-13
Where
v=sqrt(Ix2
+Iy2
+.
.3.5
Fractional Brownian
Motion
Algorithm
There
arethree
common algorithmsfor creating fBm:
midpointdisplacement,
spectralsynthesis,
and
turning
bands. This
section coversonly
spectral synthesis.For
additional methodsofcreating fBm
seeYin (1996). For
adiscussion
of additional modelsto
addsmall-scaleturbulent
detail
seeStam (1991,1995).
3.5.1
Spectral Synthesis
FBm
texture
maps areusedin
this
researchto
simulateturbulent
motion onthe
microscalelevel.
It
is
this turbulent
motionthat
gives a gas cloudits
pseudo-randomshape.The
following
sectiondiscusses
the
computer algorithmusedto
createthese texture
maps.Some
examples areincluded.
Spectral
synthesis orthe
Fourier
filtering
methodis based
onthe
spectraldensity
property
offBm. It
usesthe
Fourier
transform
to
create a processthat
has
aspectraldensity
as statedin
Equation 3-13. The disadvantages
ofthis
process are possiblelarge memory
requirements, the
wholespectrummust
be
createdat onetime, redundancy due
to
Fourier
transform
symmetries,
and as addressed
by
Falconer
(1990)
the
fBm
approximationis
poor whenthe
frequency
is very
small.
With
this
in
mindthe
following
is
adiagram
of pseudocodeto
create3D fBm
texture
maps
using
the
spectralsynthesistechnique:
1.
Create
a3D Hermetian
volumeofrandomphases with values:0
->2n (white
noise).Hermetian
means acomplex-valuedfunction
withthe
real part even andthe
imaginary
part odd.R(x)
=R(-x),
I(x)
=2.
Create
a3D
volume(same
sizeasthe
volume of randomphases)
ofamplitudesproportional
to
Where
I
=the
integer index
(0,
1
,
2
,...N-1)2 2
11-2D
WI*
+Iy
+I*
)
of
dimension
x, y, z,
N
is
the
dimension
size,
andD
is
the
fractal dimension
withrange,
3
<D
<
4.
1 1-2D
representsthe
fractional Brownian
exponent.3.
For
efficiency
usethe
inverse Fourier
transform
(IFT)
withdimension N
equalto
a power oftwo
and calculatethe
IFT(amplitudes*phases)
=fBm,
real valuedandrandom
due
to
the
Hermetian symmetry
properties.The
following
figures illustrate
the
application ofafBm
texture
map
to
the
Gaussian distribution.
The 2D
representationis
a slicethrough
the
3D distribution along
the
Z-axis. The 3D fBm has
afractal dimension
ofD
=4,
variance=40. The distributions have been
scaledfor viewing
purposes.
Figure 3-3 Fractional Brownian
motion2D & 3D
texture
mapsFigure 3-4 Gaussian*Fbm 2D & 3D distributions
Section 3 discussed
the
probability
andimplementation
behind
the
creationof3D
fractional
Brownian
motion maps.These
mapsare usedto
create micro-scalevariances,
whichsimulate4
Turbulent
Diffusion
The
following
is
adiscussion
ofthe
principlesbehind
turbulent
diffusion
ordispersion
asit
relates
to
smoke plumes.The
principles usedto
modelturbulent
diffusion from discrete
sourcesare assumed
to
be
similarto
processesaffecting
the
evolution of a gascloud.Therefore,
these
principles are
the
basis
ofthe
diffusion
andadvection modelgoverning
the
gas cloud attime,
t
>
0. The
following
sections aretaken
from Blackadar
(1997),
Beychok
(1994),
andBriggs
(1969)
except where noted.
4.1
Conservation
ofMatter
A
particleleaves
a source at sometime, t,
and movesin
responseto turbulent airflow,
withwinddirection
x,
horizontal direction
y,
and verticaldirection
z.The probability
ofthe
particlelying
between
x andx+dx,
y
andy+dy
and z and z+dzgivenindependent
probabilities andthe
particledoes
not changeform is:
J J
JP(x)P(y)P(z)dxdydz
=1
Equation
4-1
An
instantaneous
point source of strengthQ
(mass in grams)
has
aconcentrationX (mass
perunit volume).
The
expected amount of effluentin
a volume ofdimensions
dx, dy,
dz located
atx, y,
zis Xdxdydz.
The
above statements givethe
following
Equations:
X(x,y,z)
=QP(x)P(y)P(z)
[mass /
volume]
Equation
4-2
Q=
jj
|X(x,y,z)dxdydz
[mass]
Equation 4-3
The
previous equations assumeindependence
ofprobability distributions
and conservation ofmatter.
Wind
changes withheight,
dry
deposition,
wetdeposition,
and chemicaltransformations
undermine
these
assumptions.If
the
gas cloudis
confinedbetween
two
![Figure 2-1 Characteristics of absorption spectra [Schott, 1997]](https://thumb-us.123doks.com/thumbv2/123dok_us/62007.5782/17.543.116.446.261.636/figure-characteristics-of-absorption-spectra-schott.webp)
![Figure 2-2 [Schott, Computation of the absorption coefficient 1997]](https://thumb-us.123doks.com/thumbv2/123dok_us/62007.5782/19.543.154.336.41.142/figure-schott-computation-absorption-coefficient.webp)

![Figure 4-4 Taylor weighting function of energy spectrum that causes diffusion as afunction of time T [Blackadar, 1997]](https://thumb-us.123doks.com/thumbv2/123dok_us/62007.5782/54.543.60.471.294.535/figure-taylor-weighting-function-spectrum-diffusion-afunction-blackadar.webp)
![Figure 4-5 Pasquill Stability Types [Beychok, 1994]](https://thumb-us.123doks.com/thumbv2/123dok_us/62007.5782/56.543.39.458.53.309/figure-pasquill-stability-types-beychok.webp)
![Figure 4-6 McMullen Equation Constants for Rural Diffusion [Beychok, 1994]](https://thumb-us.123doks.com/thumbv2/123dok_us/62007.5782/58.543.29.491.71.314/figure-mcmullen-equation-constants-rural-diffusion-beychok.webp)
![Figure 4-7 Gifford Equation Constants for Urban Diffusion [Beychok, 1994]](https://thumb-us.123doks.com/thumbv2/123dok_us/62007.5782/59.543.39.487.57.305/figure-gifford-equation-constants-urban-diffusion-beychok.webp)
