On-chip high-speed sorting of micron-sized particles
for high-throughput analysis
D. Holmes, M.E. Sandison, N.G. Green and H. Morgan
Abstract: A new design of particle sorting chip is presented. The device employs a dielectrophoretic gate that deflects particles into one of two microfluidic channels at high speed. The device operates by focussing particles into the central streamline of the main flow channel using dielectrophoretic focussing. At the sorting junction (T- or Y-junction) two sets of electrodes produce a small dielectrophoretic force that pushes the particle into one or other of the outlet channels, where they are carried under the pressure-driven fluid flow to the outlet. For a 40mm wide and high channel, it is shown that 6mm diameter particles can be deflected at a rate of 300/s. The principle of a fully automated sorting device is demonstrated by separating fluorescent from non-fluorescent latex beads.
1 Introduction
The ability to rapidly detect, identify and subsequently sort particles in fluid suspension has great importance in a wide variety of fields. Applications include combinatorial chem-istry, clinical diagnostics, water and food quality monitoring and biohazard detection. Combinatorial chemistry is often performed using polymer beads as substrates, onto which a wide variety of chemical reactions and syntheses are performed (e.g. gene expression analysis [1]). The ability to analyse and sort large numbers of beads rapidly and accurately, is therefore of great importance. Typically, beads in the 5–10mm diameter size range are used, as they represent a good surface area to volume ratio on which to perform the chemistry. Beads can be processed using commercial flow-cytometers, but these are expensive and a chip-based platform provides much greater flexibility.
Flow cytometry is also of importance in clinical diagnostics where the analysis of biological samples is routinely carried out for the diagnosis of various medical conditions (e.g. differential blood counts, detection of pathogenic organisms, etc). Again, commercial flow-cyt-ometers are used but the cost of running these machines is high and they require skilled operators.
In recent years a number of groups have developed prototype microchip-based flowcytometers for both the detection and sorting of particles [2–7]. These devices have the potential to substantially reduce the cost of diagnosis, as the chips could be disposable. They also require much lower volumes of reagent. Generally, particles are focussed hydrodynamically so that they all pass through a small detection region. Sorting is implemented downstream of this detection region. Hydrodynamic focussing in micro-devices generally acts only in one dimension, although a number of complex fabrication schemes have been proposed to achieve
true two-dimensional focussing [8–9]. Particles move through the device under an externally applied hydrostatic pressure gradient, or under electro-osmotic flow (EOF). Both techniques manipulate the suspended particles indir-ectly by controlling the movement of the fluid. However, fluid-based sorting requires complex valving arrangements whilst EOF devices require high voltages to be switched between the different channels. In most of these devices, the sorting rates have been relatively low when compared with commercially available flow-cytometer systems (tens of particles per second compared with 10 000 particles per second) [10]. A recent paper by Wolff and co-workers demonstrated how rare particles could be selected using off-chip switching of fluid flows [9]; however, the purity of the sorted sample was low.
An alternative method of particle manipulation is dielectrophoresis (DEP). This is a non-contact technique which uses AC voltages to move particles towards or away from microelectrodes [11, 12] fabricated within the device. Sorting chips based on DEP particle manipulation techni-ques do not need complex valve arrangements to control the fluid and have the potential to produce high-speed sorting devices, which could be dynamically configured from a network of fluidic channels by choosing appropriate electrode combinations. Compared with EOF, the applied voltages are low (in the region of 10–20 V at frequencies of 1 MHz), so that there is no need for high-voltage switching and the problems of bubble generation at the electrodes surface due to electrolysis are eliminated.
Previous DEP-based particle sorting schemes have been implemented by a number of groups [e.g. 3, 5, 11–14]. These sorters typically use long strip electrodes on the upper and lower channel surfaces to form negative DEP barriers. These DEP barriers, inclined at an angle to the fluid flow, are used to push particles tangentially across the flow channel and direct them into the desired channel outlet. This method of particle separation is relatively slow as the sort region in such configurations may be an appreciable fraction of the channel width. These DEP-based particle sorters have been implemented in relatively large micro-fluidic channels (4200mm wide) and have been limited in speed by the fact that the particles must be moved several 10 s to 100 s of microns across the channel to allow sorting.
IP NBT : 0008 48725 Prod:Type:
Sudhir
=
Dhamodharan
=
Agnes
pp:127The authors are with the School of Electronics and Computing Sciences, University of Southampton, Highfield, Southampton, SO17 8AB, UK
E-mail: [email protected]
rIEE, 2005
IEE Proceedingsonline no. 20050008 doi:10.1049/ip-nbt:20050008 Paper received 16th May 2005
A consequence of this is that to sort individual particles accurately (i.e. to achieve high purity in the sorted sample) the particle concentration in the channel must be low. Gawad et al. [5] suggested a method of temporarily collecting and holding particles in a negative DEP trap at the sorting junction, then releasing the particle in a controlled manner into the desired outlet. This enabled faster sorting, but at the cost of exposing the cells to the DEP electric fields for extended periods, with the resulting potential for cell damage.
In this paper we present a novel device configuration for high-speed DEP sorting based on the use of microfaricated electrodes positioned at a Y- or T-junction of a small microfluidic channel. A particle analysis region is situated near the sorting junction. Rapid switching of sort pulses allows precise sorting of individual cell-sized particles. We describe the principle of this device and demonstrate its application by automatically sorting latex beads according to their fluorescent properties.
2 Principle of operation
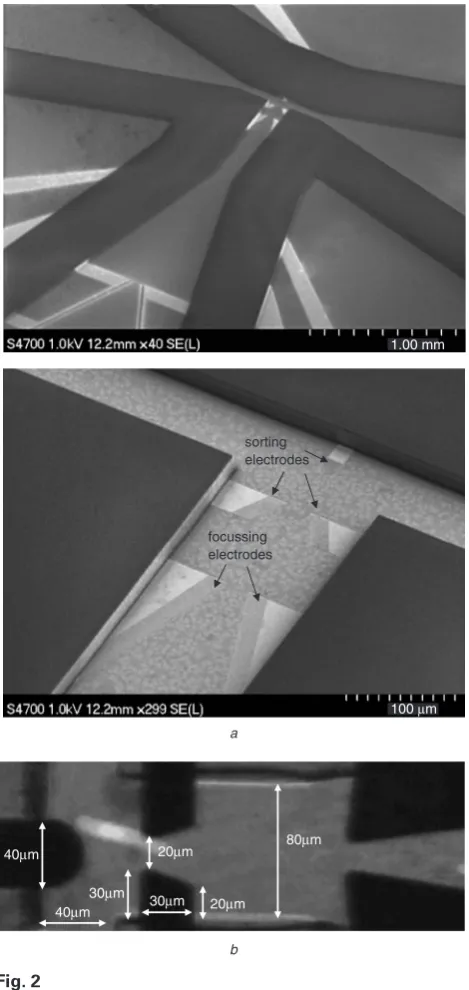
A schematic diagram of the device is shown in Fig. 1. The device has three principle components, focussing electrodes, an analysis region and a sorting region or gate. SEM images of the device prior to bonding the lid are shown in Fig. 2a
and an optical image with dimensions is shown in Fig. 2b.
The device operates as follows. With reference to Fig. 1, particles enter the chip suspended in an electrolyte. The fluid suspension is driven by an external pump. Because the distribution of particles is random, a set of electrodes is used to focus particles (by negative DEP) into a beam one particle wide, thus ensuring that all the particles follow the same trajectory and travel along the central axis of the main channel at the same velocity. Precise focussing is important and ensures that all the particles pass through the detection region in a reproducible way. It is also critical to the successful operation of the sorter, as explained below.
Figure 1 shows that immediately after the detection zone, the flow divides symmetrically into two outlets. Prior to the outlet, particles move along the central streamline, and therefore each particle has an equal probability of being carried by the fluid into either of the two outlets. Deflection of particles at the junction is achieved using negative DEP which is generated by three pairs of micro-electrodes (a set of three on the top and bottom of the channel) fabricated at the junction as shown in the Figure. As a particle flows into the junction, a negative DEP force deflects it off the central streamline. Depending on which electrodes are energised, particles can be deflected in one of two directions. Unlike
direct hydrodynamic control, the signal applied to the sorting electrodes can be switched at high speed and deflects the particle rather than the fluid. Due to the unstable equilibrium position of the particle at the centre of the channel, the force required to achieve deflection is small; the only requirement is that the particle is deflected sufficiently off the central stream line so that the fluid carries the particle into the appropriate outlet.
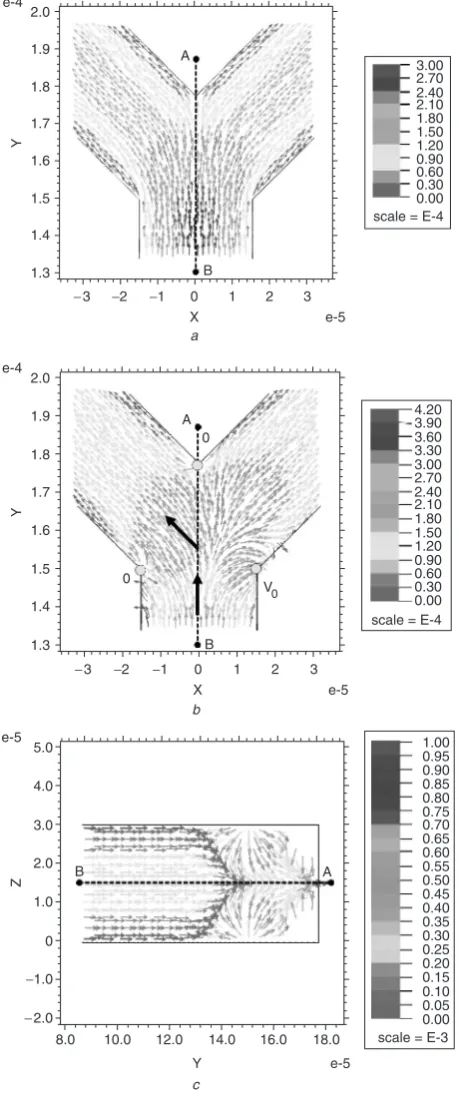
The principle of operation of the gate can be seen by reference to Fig. 3. This shows a numerical simulation of the force vectors acting on a particle for an ideal arrangement of three electrodes as shown in the Figure. The arrows indicate the net force acting on a particle, i.e. the sum of the hydrodynamic and dielectrophoretic forces. The simulation is for the Y-channel geometry shown in Fig. 1 with three electrodes placed at the corners of the interrogation
point sorting region
focussing electrodes particles in
O/P A
O/P B
Vo or 0 Volts
Vo or 0 Volts
Fig. 1 Diagram of the cell sorting chip comprising focussing electrodes, detection zone and sorting electrodes. Note that this diagram shows one half of the device (top or bottom). The full chip is made from two halves bonded together
sorting electrodes
focussing electrodes
80µm
40µm 40µm
30µm 30µm
20µm
20µm a
b
1.00 mm
100 µm
Fig. 2
a SEM images of the DEP particle sorter prior to bonding of the channel lid. The inlet channel is 150mm wide by 40mm high in the main channel, splitting into two outlet channels 75mm wide by 40mm high
[image:2.595.312.547.28.524.2] [image:2.595.49.282.341.462.2]channel as shown in the diagram. Figure 3a shows the situation with no applied voltage, the simulation showing how the fluid velocity is reduced by 50% when it divides into the two arms of the Y. Figure 3b shows the situation when a 20 V peak-to-peak signal at 10 MHz is applied to the right-hand electrode, with the other two electrodes connected to 0 V. The plot shows how the force on a particle in the region of the junction pushes it into the
opposite channel. Figure 3cshows the forces acting on the particle in a cross-section of the device, marked A–B in Fig. 3b. The electrodes not only push a particle down one or other arm of the device but also centre the particle (from top to bottom) within the channel.
A fully automated particle sorter was constructed to sort particles on the basis of a fluorescence signal. The chip was mounted in a fluorescence microscope and light was focussed into a small spot downstream from the focussing electrodes as shown in Fig. 1. The fluorescence signal from single particles was measured at high speed using a photomultiplier, as the particles flowed through the device. The information was digitised, processed in real time and used to control the switching of the appropriate voltages to the sorting electrodes. Further details of the control system are given below.
3 Experimental
3.1
Particles
10mm diameter FITC-labelled, polystyrene beads (F-8836) were purchased from Polysciences Inc. and 6mm diameter LinearFlowt Cy5-labelled, intensity calibration beads (L-14819) were purchased from Molecular Probes Inc. These beads come as a matched set loaded with various well defined amounts of Cy5 fluorescent probe. Three intensities of beads were used in this work: 4%, 20% and 100%. The beads were suspended in phosphate buffered saline (PBS) diluted with water to a conductivity of 0.3 Sm 1.
3.2
Channel design and fabrication
Two sizes of device were constructed and tested in this work; one with an inlet channel 80mm wide and 40mm high, dividing into two outlet channels of equal dimensions 40mm wide and 40mm high. A second devices was also fabricated with an inlet channel 150mm wide by 40mm high, splitting into two channels 75mm wide by 40mm high. An SEM image of the larger of the devices is shown in Fig. 2a. Figure 2bis a photo of the smaller device showing details of the channel and electrode dimensions. The smaller channels were used for the majority of the experimental work; the larger devices was used for automated sorting.
Devices were constructed from 500mm thick borosilicate glass slides. Electrodes were fabricated using standard photolithographic methods and consisted of a Ti/Au/Ti trilayer (10 nm/100 nm/10 nm). After electrode fabrication a 200 nm thick layer of silicon nitride (SiN) was deposited over the entire substrate using plasma enhanced chemical vapour deposition (PECVD). The SiN covering the electrode edges and bonding pads was removed by reactive ion etching (RIE) in an Oxford Plasmatech BP80 machine (5 min at 100 W, 15 mT and 20 ml min 1C2F6), using S1818
photoresist (Shipley) as an etch mask.
The microfluidic channel was constructed as follows: one of the substrates (with electrodes) was coated with a 40mm thick film of Durimide 7020 polyimide (Arch Chemicals Ltd, UK) and patterned according to the manufacturer’s guidelines [15] to produce the flow-channel. The two substrates (one with a polyimide channel and one without) were aligned and brought into contact using a Canon HTG mask aligner. A drop of UV-curable glue was placed at the edge of the aligned substrates, temporarily holding the aligned chip prior to thermal bonding. The two halves were thermally bonded by clamping the aligned chip and baking in a nitrogen-filled oven. The temperature was ramped at a constant rate from 901C to 3501C over 120 min, then held at 3501C for 60 min, before cooling down to room temperature. Bonded chips were mounted onto a PCB 2.0 e-4 e-5 e-5 1.9 1.8 1.7 1.6 1.5 A B 1.4 1.3
−3 −2 −1 0 1 X a b c Y 2 3 2.0 e-4 1.9 1.8 1.7 1.6 1.5 1.4 A 0 0 B A B V0 1.3
−3 −2 −1 0 1 X Y 2 3 5.0 e-5 4.0 3.0 2.0 1.0 0 −1.0 −2.0 8.0 e-5 Y Z 18.0 16.0 14.0 12.0
10.0 scale = E-3
0.00 0.05 0.10 0.15 0.20 0.25 0.30 0.35 0.40 0.45 0.50 0.55 0.60 0.65 0.70 0.75 0.80 0.85 0.90 0.95 1.00 scale = E-4
0.00 0.30 0.60 0.90 1.20 1.50 1.80 2.10 2.40 2.70 3.00 3.30 3.60 3.90 4.20 scale = E-4 0.00 0.30 0.60 0.90 1.20 1.50 1.80 2.10 2.40 2.70 3.00
Fig. 3 FEM showing the force vectors experienced by particles in a Y-shaped sorting channel
aWith electric field switched off (electrodes at 0 V) only fluid acts on the particles
bEffect of fluid flow and a 20 V peak-to-peak 10 MHz signal applied to the right-hand electrode, other electrodes are held at 0 V
[image:3.595.50.280.33.585.2]which provided the electrical connections. Inlet and outlet holes for the fluidics were drilled through one of the substrates prior to bonding, using diamond tipped drill bits (Diama Ltd., UK). The particle suspension was passed through the device using a syringe pump (Cole Palmer, 74900) and flow velocities were in the region of 1–10 mm s 1. Figure 2a shows SEM images of a device prior to bonding, showing the polyimide channel and DEP electrodes. The sorting region electrodes and focussing electrodes can be seen. The SiN layer was opened up over the edges of the electrodes, ensuring that only that portion of the electrodes was in contact with the fluid, reducing the potential for joule heating of the fluid between the electrodes.
3.3
Optical detection system
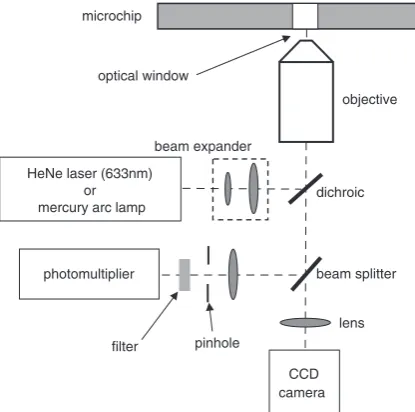
A diagram of the optical setup is shown in Fig. 4. Two illumination options were used, a 100 W mercury arc lamp (Zeiss) and a 10 mW HeNe laser (632.8 nm). Both light sources were coupled into the back port of a Zeiss Axiovert 200 fluorescence microscope via an optical switch (flipper mirror and mechanical housing), which allowed selection of one of the two light sources. An optical scrambler (Technical Video Inc., USA) was used to expand the laser beam. The optical scrambler consists of a lens for coupling the laser into a high-numerical aperture-optical fibre, the output light from the fibre then being passed through a two-lens beam expander. The excitation light was imaged onto the chip using a 20 objective lens (0.75 NA, Zeiss Fluar) giving an illumination area of approximately 50mm in diameter. Fluorescence emission from the beads was collected using the same objective lens. Emitted light was filtered using either a Cy5 (when using the laser or mercury lamp) or FITC (when using the mercury lamp) filter set (Glen Spectra Ltd., UK). The emitted light was spatially filtered to reduce the noise using a 50mm diameter pinhole positioned at the primary focal plane of the microscope camera port, giving a final detection region of approxi-mately 3mm diameter. Fluorescence was collected and quantified using a photomultiplier (H7710-03, Hamamat-su), with power supply (C7169, Hamamatsu) and amplifier (C7319, Hamamatsu) fed into a DAQ (NI6040E, National Instruments). Particles moving through the channel were simultaneously imaged using a high-sensitivity digital camera (Orca ER, Hamamatsu) attached to a second port
on the microscope. The frame rate of the camera was set to 42 frames per second.
3.4
Real-time control
The amplified analogue signal from the PMT was digitised using a National Instruments Real Time card (RT series plug-in board NI 7030/6040E). The data from the PMT was processed and used to activate the appropriate sorting electrodes via a control algorithm written in LabVIEWt. Sorting was triggered when a fluorescence signal was measured above a user-defined threshold. The control program generated a digital output from the RT card which switched a solid-state analogue switch (DG419, Maxim) that was used to control the signals applied to the sorting electrodes. The maximum sample rate of the PCI-7030/ 6040E and LabVIEWtprogram was approximately 1 kHz. Control of the sort pulse timing (i.e. delay and duration) was implemented in the software.
3.5
Numerical simulation
Finite element simulation of the forces on a particle was carried out using FlexPDEs[16], a commercial simulation package. The problem space was defined in three dimen-sions to be the section of the channel close to the junction and including sufficient channel length for end effects generated by the artificial termination of the channels to have minimal influence on the solution of the different parameters around the junction.
The electrical potential was obtained as a solution of Poisson’s equation over the whole problem space. The channel walls were assumed to be insulating boundaries and the electrodes were represented as sections of the base and top of the channel at fixed potentials or ground. The solutions were obtained using adaptive mesh refinement and the electric field and dielectrophoretic force were calculated from the resulting electrical potential [11, 12]. The fluid flow was determined by solving the Navier Stokes equation for the same problem space with a given pressure drop between the entry channel and the two arms of the junction. The boundary conditions on the walls, base and top of the channel were zero flow and Neumann for the pressure. The entry of the channel was an in-flow condition at fixed positive pressure and the two exits were outflow and fixed zero pressure. The fluid problem was again solved using adaptive mesh refinement.
4 Results and discussion
4.1
DEP focussing and optical detection
The focussing electrodes (on the top and bottom internal surfaces of the channel) ensured that all the particles were focussed by negative DEP force as they flowed through the channel. Two sets of focussing electrodes were fabricated into the device. The first set of focussing electrodes was positioned in the tapered section of the inlet channel to focus the particles prior to entry into the main section of the microfluidic channel. The second set of focussing electrodes was positioned just upstream from the detection region and the sorting electrodes. These precisely focussed all the incoming particles onto the central streamline ensuring they all passed through the optical detection region immediately prior to the sorting electrodes.The focussing system has been described in detail elsewhere, [17–19] and will only briefly be discussed here. A suspension of latex beads suspended in dilute PBS (300 mSm 1) was passed through the device and effective focussing with particle velocities of up to 10 mm s 1 was achieved with voltages of 20 V peak-to-peak at 10 MHz lens
objective
beam splitter photomultiplier
optical window
HeNe laser (633nm) or mercury arc lamp
CCD camera pinhole
microchip
dichroic
filter
beam expander
[image:4.595.62.270.548.754.2]applied to two diagonally opposite electrodes with the other electrodes held at 0 V. The DEP force pushed particles into the centre of the channel, ensuring that all the particles passed along the central axis of the flow channel and through the optical detection zone. For these electrodes and channel dimensions, the maximum particle velocity for efficient focussing was 10 mm s 1.
The detection region was illuminated using the 633 nm laser spot focussed at the centre of the main channel, 50mm downstream from the focussing electrode array as shown in Fig. 1. Data from the optical detection system is shown in Fig. 5. With the DEP focussing switched, on the system is capable of accurately discriminating between beads of differing fluorescence intensities. With the focussing switched off, the signal drops away as particles no longer transit the detection region. With the focussing electrodes energised, three intensities of fluorescent beads are clearly distinguishable in the data.
[image:5.595.52.285.34.177.2]4.2
Manual sorting
Figure 6 is a series of consecutive frames from a video showing Cy5-labelled, 6mm diameter beads passing through the DEP gate. The images were obtained at 24 ms intervals (42 frames per second). Having passed the detection zone,
the particles are focussed by the second set of focussing electrodes and then deflected into one of the two channels, depending on the applied voltage. The top row shows a particle being gated to the left and the bottom row a particle gated to the right. (The bright image in all the frames is due to beads which have adhered to the channel wall during previous experiments.) For applied voltages of 20 V peak-to-paek at 10 MHz (applied to the active electrodes, all other electrodes held at 0 V) gating into either channel could be achieved with 100% success at particle velocities up to 1.5 mm s 1.
Figure 7 shows a superposition of the video frames showing the tracks of 200 individual particles within the device; 100 sorted to the right followed by 100 sorted into the left channel. The tracks are elongated as the particles move several tens of microns during each video frame. The trajectory of the particles is reproducible. They all follow the same path from the focussing electrodes into the outlet channels. The asymmetry in the particle trajectories seen in 10
fluorescence intensity, V
8
6
4
2
0
10
8
6
4
2
0
0 50
20% 100%
4%
100 150 200
time, ms
focussing off focussing on
0 50 100 150 200
Fig. 5 Plot showing the photomultiplier signal from the detection of a mixture of 6mm Cy5 labelled fluorescent beads of three fluorescent intensities. The effect of the DEP focussing is evident by comparing the two graphs. With no focussing the confocal detection system does not register the particles, they flow through the channel at random positions making detection and discrimination of intensity impossible
Fig. 6 Sequence of video frames showing particle deflection. Top row shows a single particle being gated to the left. Bottom row shows a particle being gated to the right. The particles appear elongated as they move a considerable distance in the 24 ms timeframe of a single video frame
focussing electrodes
sorting electrodes
20µm
[image:5.595.319.540.252.473.2] [image:5.595.79.517.552.735.2]the Figure is due to imperfections in the channel after fabrication, giving an uneven flow in the two outlet channels. These imperfections were not present in the larger channels.
It was possible to achieve continuous high-speed stream-ing of particles into one outlet and then the other, at particle velocities of 1.5 mms 1. Faster sorting would be possible with better control of channel dimensions and accurate control of flow rates.
4.3
Automated sorting
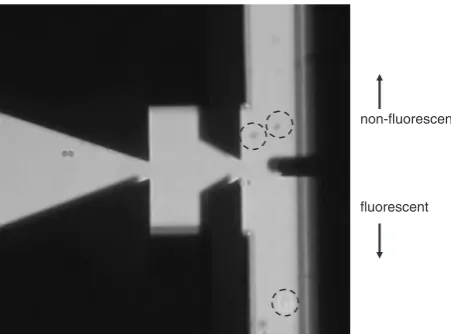
The real-time control card was used to control the voltage sequence applied to the gating electrodes. Mixtures of 6mm Cy5 and 10mm FITC fluorescently labelled latex beads (ratio of 4:1) were used. The larger device dimensions were used and particles were illuminated using the mercury lamp. The system was programmed to sort on the basis of FITC fluorescence. Any particle with fluorescence emission above a threshold intensity level triggered a ‘sort’ pulse which was applied to one set of electrodes. In the ‘no-sort’ state (no fluorescence) the electrodes on the opposite side of the channel were permanently energised. The central electrode in the gate was always connected to ground or zero volts. The real-time card introduces a small but finite time delay between the detection of the fluorescence signal (from the photomultiplier) and triggering of the voltage pulse. The sorting voltage was 20 V peak-to-peak at 10 MHz, with a sort pulse duration of 500 ms. All parameters were set in the control software. To ensure no false gating, a delay of 100 ms was introduced between the detection of the fluorescence signal and the application of the sorting voltage pulse. With these parameters, particles could be sorted at velocities of 300mms 1with 100% certainty (no false positives).
Figure 8 shows an image of FITC-labelled beads moving in one channel of the device with 6mm beads moving into the other. The device was operated at a throughput of two particles per second, and for a representative sample of 100 beads the number of missed events (i.e. lost fluorescent beads) was zero. Four non-fluorescent beads were incor-rectly gated. The optimal results using automated control were obtained with a low density of fluorescent particles, allowing the non-fluorescent particles to be sorted at 10 per second. The automated sorting rate is very slow, but demonstrates the potential of the device. The speed is limited by a number of parameters, such as the processing speed of the real-time card and software (sample rate
o1 kHz). Optimisation of the particle concentration, sorting signal pulse (i.e. delay and duration of the pulse) and the applied flow rates and voltages is required to enable faster sorting. The inclusion of electrodes that would spatially separate particles along the channel axis, as described by Fiedler et al. [3], would also improve the sorting speed and efficiency.
5 Conclusions
We have demonstrated a device that can sort particles in a fluid stream. The device operates by combining a dielectrophoretic force with a hydrodynamic force. Particles such as latex beads and cells can be manipulated using relatively low voltages at high transit speeds. Owing to the small size of the sorting junction, the probability of two particles being gated at the same time is reduced, which means that the particle concentrations can be relatively high, giving increased throughput.
We are currently investigating higher-speed electronics and improved device designs to optimise the sorting rate of the device. Implementation of faster electronic control systems and fine-tuning of the control signal delays and durations should result in a significant increase in the particle-sorting throughput. Channel shape and size and electrode placements are all adjustable parameters. We estimate that sort rates up to 1000 particles per second should be achievable with further refinement.
6 Acknowledgments
This research was supported by the Emerging and Under-pinning Technologies Domain of the UK MoD Corporate Research Programme and EPSRC Grant GR/R28942/01.
7 References
1 Brenner, S., Johnson, M., Bridgham, J., Golda, G., Lloyd, D.H., Johnson, D., Luo, S., McCurdy, S., Foy, M., Ewan, M., Roth, R., George, D., Eletr, S., Albrecht, G., Vermaas, E., Williams, S.R., Moon, K., Burcham, T., Pallas, M., DuBridge, R.B., Kirchner, J., Fearon, K., Mao, J., and Corcoran, K.: ‘Gene expression analysis by massively parallel signature sequencing (MPSS) on microbead arrays’,
Nat. Biotech., 2000,18, pp. 630–634
2 Lee, G.-W., Hung, C.-I., Ke, B.-J., Huang, G.-R., Hwei, G.-R., Hwei, B.-H., and Lai, H.-F.: ‘Hydrodynamic focussing for a micromachined flow cytometer’,Trans. ASME, 2001,123, pp. 62–679
3 Fiedler, S., Shirley, S.G., Schnelle, T., and Fuhr, G.: ‘Dielectrophoretic sorting of particles and cells in a microsystem’,Anal. Chem., 1998,70, pp. 1909–1915
4 Fu, A.Y., Spence, C., Scherer, A., Arnold, F.H., and Quake, S.R.: ‘A microfabricated fluorescence-activated cell sorter’,Nat. Biotech., 1999, 17, p. 1109
5 Gawad, S., Schild, L., and Renaud, P.: ‘Micromachined impedance spectroscopy flow cytometer for cell analysis and particle sizing’,Lab Chip, 2001,1, p. 76
6 Kruger, J., Singh, K., O’Neill, A., Jackson, C., Morrison, A., and. O’Brien, P.: ‘Development of a microfluidic device for fluorescence activated cell sorting’, Journal of Micromech. Microeng., 2002, 12, p. 486
7 Schrum, D.P., Culbertson, C.T., Jacobson, S.C., and Ramsey, J.M.: ‘Microchip flow cytometry using electrokinetic focusing’,Anal. Chem., 1999,71, p. 4173
8 Sundararajan, N., Pio, M.S., Lee, L.P., and Berlin, A.: ‘Three-dimensional hydrodynamic focusing in poly(dimethylsiloxane) (PDMS) microchannels for molecular detection’. Presented at 6th Annual European Conf. on Micro & Nanoscale Technologies for the Biosciences, Montreux, Switzerland, 2002
9 Wolff, A., Perch-Nielsen, I.R., Larsen, U.D., Friis, P., Goranovic, G., Poulsen, C.R., Kutter, J.P., and Telleman, P.: ‘Integrating advanced functionality in a microfabricated high-throughput fluorescent-acti-vated cell sorter’,Lab Chip, 2003,3, (1), pp. 22–27
10 Shapiro, H.W.: ‘Practical flowcytometry’ (John Wiley and Sons, New Jersey, 2003, 4th edn.)
11 Morgan, H., and Green, N.G.: ‘AC electrokinetics: colloids and nano-particles’, in Pethig, R. (Ed.) (Research Studies Press, Baldock, UK, 2003)
non-fluorescent
fluorescent
[image:6.595.51.277.568.735.2]12 Jones, T.B.: ‘Electromechanics of particles’ (Cambridge University Press, Cambridge, 1995)
13 Voldman, J., Gray, M.L., Toner, M., and Schmidt, M.A.: ‘A microfabrication-based dynamic array cytometer’,Anal. Chem., 2002, 74, pp. 3984–3990
14 Seger, U., Gawad, S., Johann, R., Bertsch, A., and Renau, P.: ‘Cell immersion and cell dipping in microfluidic devices’,Lab Chip, 2004,4, pp. 148–151
15 http://www.archmicro.com/products, accessed April 2005 16 http://pdesolutions.com, accessed April 2005
17 Morgan, H., Holmes, D., and Green, N.G.: ‘3D focusing of nanoparticles in microfluidic channels’,IEE Proc. Nanobiotechnol., 2003,150, (2), pp. 76–81
18 Morgan, H., Holmes, D., and Green, N.G.: ‘AC electrokinetic focussing in microchannels: micro- and nano-particles’, in Morgan, H. (Ed.): ‘Electrostatics 2003’ (IoP Publications, 2003)