Statistics
in focus
SCIENCE AND
TECHNOLOGY
18/2008
Author
Tomas MERI
C o n t e n t s
United Kingdom’s high-tech KIS account for a quarter of EU-27 total sector value added... 1
Women under-represented in high-tech KIS ... 4
[image:1.595.216.555.250.686.2]High shares of employment in High-tech KIS in capital regions
... 5
H ight e c h k now le dge
-int e nsive se rvic e s
Mostly concentrated in capital regions
An essential source of innovation, knowledge-intensive services (KIS) and even more so high-tech KIS are often seen as major engines of growth in modern economies.
This Statistics in Focus details the high-tech KIS sector in the EU by analysing both economic and employment indicators at national and regional levels.
United Kingdom’s high-tech KIS account for a quarter of
EU-27 total sector value added
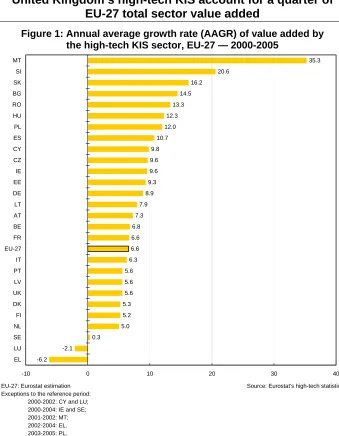
Figure 1: Annual average growth rate (AAGR) of value added by the high-tech KIS sector, EU-27 — 2000-2005
EU-27: Eurostat estimation Source: Eurostat's high-tech statistics
Exceptions to the reference period: 2000-2002: CY and LU; 2000-2004: IE and SE; 2001-2002: MT; 2002-2004: EL. 2003-2005: PL.
35.3
20.6
16.2
14.5
13.3
12.3
12.0
10.7
9.8
9.6
9.6
9.3
8.9
7.9
7.3
6.8
6.6
6.6
6.3
5.6
5.6
5.6
5.3
5.2
5.0
0.3
-2.1
-6.2
-10 0 10 20 30 40
MT
SI
SK
BG
RO
HU
PL
ES
CY
CZ
IE
EE
DE
LT
AT
BE
FR
EU-27
IT
PT
LV
UK
DK
FI
NL
SE
LU
EL
Value added is an important indicator for measuring economic output and shows the value added to a service (or product) by companies before it is offered on the market (see methodological notes on page 7). Although the value added by the EU’s high-tech KIS sector increased at an average annual growth rate of 6.6% between 2000 and 2005, there were large disparities between countries (Figure 1).
Most of the new Member States (2004 and 2007 enlargements) experienced large growth while Luxembourg and Greece were the only Member States to see a decline in value added by the high-tech KIS sector.
(
#
Manuscript completed on: 26.02.2008 Data extracted on: 28.11.2007 ISSN 1977-0316
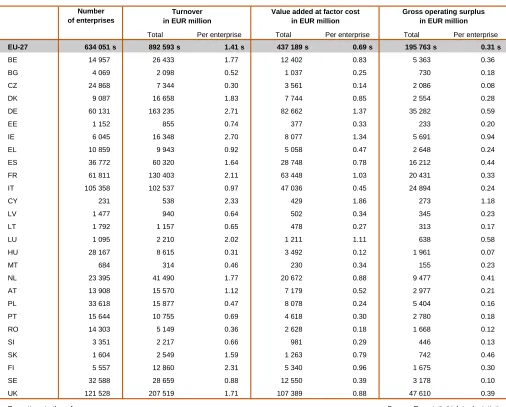
In 2005, the EU’s high-tech KIS sector counted 634 thousand enterprises and generated a value added of EUR 437 billion (Table 2).
With almost one quarter of total EU value added, the United Kingdom was well ahead, followed by Germany, France, Italy and Spain. These five Member States together accounted for 75% of the value added by the EU’s high-tech KIS sector.
The United Kingdom and Germany were the top two Member States also on the basis of turnover and gross operating surplus in absolute terms (EUR million). However, in terms of number of enterprises, the United Kingdom also ranked first (122 thousand) but was followed by Italy (105 thousand). At the other end of the scale, Malta and Cyprus had less than one thousand enterprises per country.
In the EU in 2005, the turnover, value added and gross operating surplus per enterprise in high-tech KIS reached respectively EUR 1.41 million, EUR 0.69 million and EUR 0.31 million.
Although Germany and Ireland clearly led in terms of turnover per enterprise in the high-tech KIS sector, value added was the highest in Cyprus, with EUR 1.86 million per enterprise. It was also above EUR 1 million in Germany, Ireland, France and Luxembourg.
Taking the indicator ‘gross operating surplus per enterprise’, Cyprus also ranked first. Even more strikingly, this was the only country exceeding EUR 1 million.
With the exceptions of Cyprus and Slovakia, all the Member States that joined the EU in 2004 and 2007 were at the end of the scale in terms of both turnover and value added per enterprise, together with Portugal.
[image:2.595.45.551.328.735.2]Taking gross operating surplus per enterprise into account, eight of these new Member States were still among the countries at the end of the scale, along with Sweden and Portugal.
Table 2: Description of the high-tech KIS sector, EU-27 — 2005
EU-27 634 051 s 892 593 s 1.41 s 437 189 s 0.69 s 195 763 s 0.31 s
BE 14 957 26 433 1.77 12 402 0.83 5 363 0.36
BG 4 069 2 098 0.52 1 037 0.25 730 0.18
CZ 24 868 7 344 0.30 3 561 0.14 2 086 0.08
DK 9 087 16 658 1.83 7 744 0.85 2 554 0.28
DE 60 131 163 235 2.71 82 662 1.37 35 282 0.59
EE 1 152 855 0.74 377 0.33 233 0.20
IE 6 045 16 348 2.70 8 077 1.34 5 691 0.94
EL 10 859 9 943 0.92 5 058 0.47 2 648 0.24
ES 36 772 60 320 1.64 28 748 0.78 16 212 0.44 FR 61 811 130 403 2.11 63 448 1.03 20 431 0.33 IT 105 358 102 537 0.97 47 036 0.45 24 894 0.24
CY 231 538 2.33 429 1.86 273 1.18
LV 1 477 940 0.64 502 0.34 345 0.23
LT 1 792 1 157 0.65 478 0.27 313 0.17
LU 1 095 2 210 2.02 1 211 1.11 638 0.58
HU 28 167 8 615 0.31 3 492 0.12 1 961 0.07
MT 684 314 0.46 230 0.34 155 0.23
NL 23 395 41 490 1.77 20 672 0.88 9 477 0.41
AT 13 908 15 570 1.12 7 179 0.52 2 977 0.21
PL 33 618 15 877 0.47 8 078 0.24 5 404 0.16
PT 15 644 10 755 0.69 4 618 0.30 2 780 0.18
RO 14 303 5 149 0.36 2 628 0.18 1 668 0.12
SI 3 351 2 217 0.66 981 0.29 446 0.13
SK 1 604 2 549 1.59 1 263 0.79 742 0.46
FI 5 557 12 860 2.31 5 340 0.96 1 675 0.30
SE 32 588 28 659 0.88 12 550 0.39 3 178 0.10
UK 121 528 207 519 1.71 107 389 0.88 47 610 0.39 Exceptions to the reference year: Source: Eurostat's high-tech statistics
2004: CZ, IE, EL, AT and SE; 2002: CY, LU and MT
Total
Gross operating surplus in EUR million Number
of enterprises
Per enterprise Total Per enterprise
Turnover in EUR million
Value added at factor cost in EUR million
________________________________________________ 18/2008 — Science and technology — St a t ist ic s in foc us 3
#
An average EU enterprise in the high-tech KIS sector generated a production value of EUR 1.30 million in 2005 (Figure 3).
Germany ranked first with an average production value per enterprise of EUR 2.42 million, followed by Finland with EUR 2.31 million.
Nine other Member States are listed with production values per enterprise above the EU-27 average. Among them, Cyprus and to a lesser extent Slovakia were the only new Member States (2004 and 2007 enlargements). As for turnover and value added per enterprise (Table 2), all the other new Member States were together with Portugal lodged at the end of the scale with a production value per enterprise below EUR 0.8 million.
Comparing the investments in tangible goods (Figure 4) and the production value (Figure 3) of high-tech KIS enterprises, it can be highlighted that most of the countries where investments in tangible goods were significant also had a large production value. This was especially true for Cyprus, which ranked first in terms of investments in tangible goods.
[image:3.595.47.551.270.487.2]With the main exception of Romania, investments were generally low in most of the Member States that were also at the end of the scale in terms of production value.
Figure 3: Production value in EUR million per enterprise, high-tech KIS sector, EU-27 — 2005
EU-27: Eurostat estimation Source: Eurostat's high-tech statistics
Exceptions to the reference year: 2004: CZ, IE, EL and SE; 2002: CY, LU and MT. 2.42
2.31 2.27
2.02 1.85
1.79 1.75 1.73
1.67 1.61
1.45
1.30 1.26 1.16
0.94
0.86 0.83
0.71 0.66
0.59 0.57 0.57
0.49 0.46 0.42
0.34 0.27
0.21
0.0 0.5 1.0 1.5 2.0 2.5 3.0
[image:3.595.45.553.484.735.2]DE FI CY FR IE LU BE NL DK UK SK EU-27 ES EL IT AT SE EE PT LV SI LT BG MT PL RO CZ HU
Figure 4: Gross investments in tangible goods in EUR million per enterprise, high-tech KIS sector, EU-27 — 2005
EU-27: estimated excluding LU. Source: Eurostat's high-tech statistics
Exceptions to the reference year: 2004: CZ, IE, EL and SE; 2002: CY and MT. 0.42
0.30
0.20
0.16 0.16
0.13 0.13
0.12 0.12 0.11
0.11 0.11 0.10
0.10 0.10 0.10 0.09
0.08 0.08
0.07 0.07 0.07 0.06 0.05
0.04
0.03 0.03
0.0 0.1 0.2 0.3 0.4 0.5
Women under-represented in high-tech KIS
With almost one third (32.5%) of EU employment in 2006, the knowledge-intensive services (KIS) sector was responsible for more than 67 million jobs (Table 5).
Germany ranked first, with 12.7 million people employed in KIS, closely followed by the United Kingdom (12.1 million).
However, only one tenth of the jobs in KIS were in fact in high-tech KIS (6.8 million). Germany and the United Kingdom were the only Member States where employment in high-tech KIS added up to more than one million people.
As a percentage of total employment, Sweden had the greatest shares of employment in KIS and in high-tech KIS, with 47.7% and 5.1% respectively. In high-tech KIS, Sweden was followed by Iceland (5.0%), Finland (4.6%) and Denmark (4.4%). In other words, the high-tech KIS sector was most developed in countries in northern Europe.
In contrast, less than 2% of employed people were active in high-tech KIS in Portugal and in Romania. Employment in KIS increased between 2001 and 2006 not only at EU level (2.9%) but also in all individual Member States.
Employment in high-tech KIS also increased in the EU (1.0%), but at a lower rate than in KIS (2.9%). Poland (8.9%) and Spain (6.5%) experienced the highest growth. However, twelve EU Member States together with Iceland, Norway, Switzerland and Croatia had a drop in employment in high-tech KIS. While at EU level female employment clearly exceeded parity in KIS (60.4%), this was not true in high-tech KIS (32.9%).
[image:4.595.46.552.353.748.2]With the exception of Malta, all countries exceeded parity in KIS, but the only country reaching over 50% of women in high-tech KIS was Lithuania.
Table 5: Employment in KIS and high-tech KIS in thousands, as a percentage of total employment and percentage of women in 2006 and AAGR 2001-2006 (1), EU-27 and selected countries
in 1000s
as a % of total employment
A A GR 2001-2006
% of
w omen in 1000s
as a % of total employment
A A GR 2001-2006
% of w omen
EU-27 67 358 s 32.5 s 2.9 s 60.4 s 6 793 s 3.3 s 1.0 s 32.9 s
BE 1 621 38.4 1.4 58.9 158 3.7 -0.8 28.6
BG 683 22.0 1.4 64.9 80 2.6 1.5 47.4
CZ 1 209 25.1 1.4 63.6 142 2.9 -1.2 43.1
DK 1 220 43.5 1.0 62.6 123 4.4 -1.7 33.9
DE 12 715 34.1 2.4 60.6 1 294 3.5 2.0 32.4
EE 185 28.6 2.8 69.1 16 2.5 -3.6 :
IE 654 34.0 4.5 61.3 69 3.6 -0.6 30.5
EL 1 109 25.0 3.8 52.8 88 2.0 5.2 31.0
ES 5 514 27.9 6.7 56.9 589 3.0 6.5 31.6
FR 8 928 36.1 1.5 61.7 929 3.8 -0.8 36.8
IT 6 975 30.4 4.0 55.8 702 3.1 1.5 34.4
CY 101 28.3 4.3 60.1 7 2.0 4.5 31.1
LV 277 25.5 3.1 68.8 27 2.5 5.5 48.9
LT 383 25.6 0.8 70.2 31 2.1 1.7 54.0 u
LU 85 43.5 5.1 54.7 6 3.3 2.5 27.0
HU 1 117 28.4 1.9 64.6 134 3.4 1.6 40.5
MT 47 31.0 2.9 47.9 5 3.1 2.5 :
NL 3 432 42.0 1.3 59.5 312 3.8 -1.4 26.1
A T 1 194 30.4 2.0 59.6 108 2.8 -0.8 28.5
PL 3 589 24.7 4.0 65.9 346 2.4 8.9 39.5
PT 1 171 23.1 3.5 63.2 94 1.9 5.3 32.7
RO 1 356 14.6 2.7 63.0 150 1.6 -0.7 46.3
SI 250 26.2 3.5 63.0 26 2.7 1.1 28.6
SK 573 24.9 1.3 65.4 59 2.6 -1.6 43.7
FI 1 011 41.1 1.5 65.8 113 4.6 1.3 36.2
SE 2 111 47.7 1.1 62.5 224 5.1 -0.1 31.7
UK 12 126 43.0 1.9 59.8 1 186 4.2 -1.6 24.2
IS 70 43.1 2.0 64.6 8 5.0 -1.8 37.0
NO 1 042 45.7 1.2 62.8 91 4.0 -2.2 32.8
CH 1 665 41.3 1.7 55.4 153 3.8 -2.0 33.0
HR 363 23.0 2.5 62.2 33 2.1 -3.7 41.3 u
(1) A A GR is calculated on employment expressed in 1000s Source: Eurostat's high-tech statistics Exceptions to the ref erence year: Exceptions to the ref erence period:
2005: BE, IE, IS and NO. 2001-2005: BE, IE, IS and NO; 2002-2006: HR;
________________________________________________ 18/2008 — Science and technology — St a t ist ic s in foc us 5
#
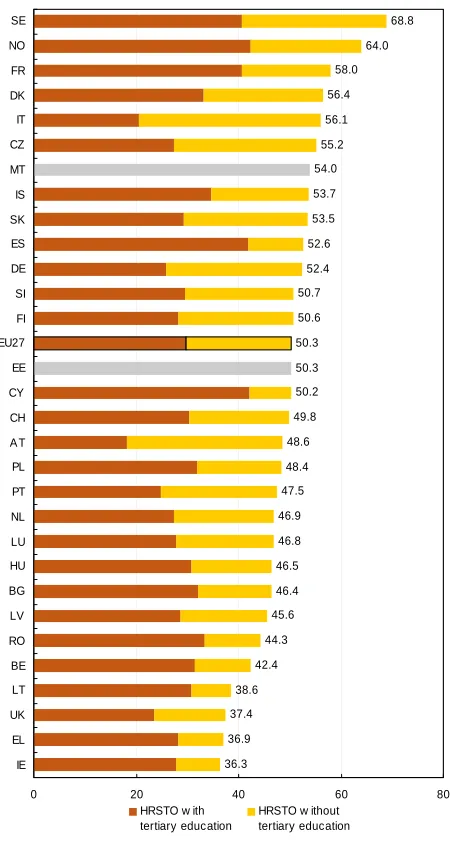
Human resources in science and technology in terms of occupation (HRSTO) are people working as professionals or technicians (see methodological notes on page 7). Figure 6 shows the share of HRSTO in the high-tech KIS sector and those with a tertiary education among the HRSTO.
In 2006, half (50.3%) of the employees in the EU high-tech KIS sector were HRSTO.
Sweden ranked first, with a share of HRSTO in employment of 68.8%. Norway also displayed a share above 60%. At the other end of the scale, Lithuania, the United Kingdom, Greece and Ireland did not reach 40%.
[image:5.595.50.275.314.741.2]If only the shares of professionals and technicians with a tertiary education are taken into account, the ranking is different. Norway came first, followed by Cyprus, Spain, France and Sweden.
Figure 6: Share of employment working as professionals or technicians (HRSTO) in high-tech KIS, EU-27 and selected countries — 2006
High shares of employment in High-tech
KIS in capital regions
Knowledge-intensive services
and regional innovation: Is there a ‘direct’ link?
In spite of the fact that we are immersed in a global economy, in many aspects innovation is mainly a regional phenomenon, in which services, and in particular those called knowledge-intensive services (KIS)(1), have acquired a central role.
Some studies, like the one by Makun and McPerson (1997), show that innovation rates are greater in those regions where a high concentration of KIS exists. They argue that, despite technological changes, like the rise of Internet, in the majority of cases the inter-regional trade in KIS is not possible, because of the need to establish “face to face” contacts in order to transmit tacit knowledge. If we add to this need the local character of supplier-provider relationships in services (Wood, 1991), the result is that the regional level becomes the most adequate scope in which to study the role of KIS in innovation.
Using as starting point the theory of the “learning regions”, Strambach (1998) describes two types of effects of KIS: direct and indirect. The direct effects refer to the development of KIS’s own innovations, whereas the indirect effects are classified into four groups: knowledge transfer in the form of specialised technological knowledge or know-how management, integration of the different stocks of knowledge and competences, adaptation of existing knowledge to the specific needs of clients and production of new knowledge. […]
Source: Joint Congress of the European Regional Science Association and ASRDLF (Association de Science Régionale de Langue Française), 2007.
(1)
The industries included within the group of KIS are those referred to by Eurostat as ‘high-tech knowledge-intensive services’.
Map 7 provides an overview of the employment shares taken by high-tech KIS in 2006 across the regions of the EU and EFTA (NUTS 2 level).
With almost one tenth of employment in high-tech KIS (9.2%), the region Berkshire, Buckinghamshire and Oxfordshire (UK) led by a wide margin.
Several regions showing high shares of employment in the high-tech KIS sector were in fact capital regions. This was for example the case of Stockholm (SE), Oslo og Akershus (NO), Île de France (FR) and Comunidad de Madrid (ES).
In addition to the capital regions, regions with a significant proportion of employment in high-tech KIS were mainly located in Germany, in the United Kingdom and also in northern Europe. In contrast, the high-tech KIS sector generally employed fewer people in eastern and southern Europe.
Source: Eurostat's high-tech statistics MT and EE: No detail concerning the level of education is available.
EU-27: Eurostat estimation. Exceptions to the ref erence year:
2005: BE, IE, IS and NO.
68.8 64.0 58.0 56.4 56.1 55.2 54.0 53.7 53.5 52.6 52.4 50.7 50.6 50.3 50.3 50.2 49.8 48.6 48.4 47.5 46.9 46.8 46.5 46.4 45.6 44.3 42.4 38.6 37.4 36.9 36.3
0 20 40 60 80
SE NO FR DK IT CZ MT IS SK ES DE SI FI EU27 EE CY CH A T PL PT NL LU HU BG LV RO BE LT UK EL IE
HRSTO w ith tertiary education
Map 7: Regional employment in high-tech KIS as a percentage of total employment — 2006
0 600 km
Regional employment in high-tech KIS as a percentage of total employment,
by NUTS 2 regions, 2006
Cartography: Eurostat — GISCO, 12/2007
© EuroGeographics Association, for the administrative boundaries Statistical data: Eurostat database: REGIO
<= 1.5 1.5 - <= 3.0 3.0 - <= 4.5 > 4.5
Data not available
Exceptions to the reference year: 2005: BE, IE, IS and NO.
Unreliable data: see methodological notes on page 7.
Guadeloupe (FR)
0 25
Martinique (FR)
0 20
Guyane (FR)
0 100
Réunion (FR)
0 20
Açores (PT)
0 100
Madeira (PT)
0 20
Canarias (ES)
0 100
Malta
0 10
0 100
________________________________________________ 18/2008 — Science and technology — St a t ist ic s in foc us 7
#
E S S E N T I A L I N F O R M A T I O N – M E T H O D O L O G I C A L N O T E S
Classification of high-tech knowledge-intensive services
Eurostat defines the following NACE Rev. 1.1 codes as knowledge-intensive services (KIS) and as high-tech KIS:
Knowledge-intensive services (KIS)
61 Water transport; 62 Air transport;
64 Post and telecommunications; 65 to 67 Financial intermediation;
70 to 74 Real estate, renting and business activities;
80 Education;
85 Health and social work;
92 Recreational, cultural and sporting activities
High-tech KIS
64 Post and telecommunications; 72 Computer and related activities; 73 Research and development.
For further details on the NACE classification, please refer to the website http://ec.europa.eu/eurostat/ramon.
Sources
Economic indicators are derived from the Structural
Business Statistics — SBS. Employment data are derived
from the Community Labour Force Survey — CLFS.
Definitions
Number of enterprises is the count of the number of
enterprises active during at least part of the reference period.
Turnover comprises the totals invoiced by the observation
unit during the reference period, and this corresponds to market sales of goods or services supplied to third parties; it includes all duties and taxes on the goods or services invoiced by the unit, with the exception of the VAT invoiced by the unit to its customer and other similar deductible taxes directly linked to turnover; it also includes all other charges (transport, packaging, etc.) passed on to the customer. Price reductions, rebates and discounts as well as the value of returned packing must be deducted.
Value added at factor costs is the gross income from
operating activities after adjusting for operating subsidies and indirect taxes. It can be calculated from turnover, plus capitalised production, plus other operating income, plus or minus changes in stocks, minus purchases of goods and services, minus other taxes on products which are linked to turnover but not deductible, minus duties and taxes linked to production. Alternatively it can be calculated from gross operating surplus by adding personnel costs.
Production value measures the amount actually produced
by the unit, based on sales, including changes in stocks and the resale of goods and services. The production value is defined as turnover, plus or minus changes in stocks of finished products, work in progress and goods and services purchased for resale, minus purchases of goods and services for resale, plus capitalised production, plus other operating income (excluding subsidies). Income and expenditure classified as financial or extraordinary in company accounts is excluded from production value.
Gross investment in tangible goods is defined as
investment during the reference period in all tangible goods. Included are new and existing tangible capital
goods, whether bought from third parties or produced for own use (i.e. capitalised production of tangible capital goods), having a useful life of more than one year, including non-produced tangible goods such as land. Investments in intangible and financial assets are excluded.
Gross operating surplus is the surplus generated by
operating activities after the labour factor input has been recompensed. It can be calculated from value added at factor cost less personnel costs. It is the balance available to the unit which allows it to recompense the providers of own funds and debt, to pay taxes and eventually to finance all or part of its investment.
Employment includes persons aged 15-74 who during the
reference week performed work, even for just one hour a week, for pay, profit or family gain or were not at work but had a job or business from which they were temporarily absent.
Human resources in science and technology in terms of occupation (HRSTO) are persons who are employed in
an S&T occupation (ISCO ‘88 COM codes 2 or 3). Code 2 comprises professionals and code 3 technicians and
associate professionals. HRSTO with tertiary education
have successfully completed education at the third level (ISCED ‘97 version levels 5a, 5b or 6).
NUTS
In this publication regional data are presented in accordance with the Nomenclature of Territorial Units for Statistics (NUTS), at NUTS level 2. More information on the NUTS classification can be found on the website:
http://europa.eu.int/comm/eurostat/ramon/nuts/home_regions_en .html
Quality of the data on employment
The guidelines on the quality of data established by the CLFS are applied to the database on high-tech industries and knowledge-intensive services. Regions for which no publishable quality has been achieved are therefore shown as not available.
Regions for which the data are classified as unreliable but publishable in Map 7 are:
AT21, AT32, AT33, BE34, BG12, BG13, CH07, ES13, ES22, FR21, FR25, GR23, GR25, GR43, ITD1, ITD2, ITF5, NL12, NL13, NL23, PL31, PL32, PL33, PL34, PL42, PL43, PL52, PL61, PL62, PL63 and RO41.
Statistical abbreviations and symbols
AAGR Annual average growth rate
HRSTO Human resources in science and technology in terms of occupation
KIS Knowledge-intensive services s Eurostat estimate
u Lack reliability due to reduced sample size : Not available
Further information:
Data:
Science and technology
High-tech industry and knowledge-intensive services
High-tech industries and knowledge-intensive services: economic statistics at national level
High-tech industries and knowledge-intensive services: employment statistics at national and regional level
High-tech industries and knowledge-intensive services: science and technology statistics at national and regional level
Journalists can contact the media support service:
Bech Building Office A4/125 L - 2920 Luxembourg Tel. (352) 4301 33408 Fax (352) 4301 35349
E-mail: [email protected]
European Statistical Data Support:
Eurostat set up with the members of the ‘European statistical system’ a network of support centres, which will exist in nearly all Member States as well as in some EFTA countries.
Their mission is to provide help and guidance to Internet users of European statistical data.
Contact details for this support network can be found on our Internet site: http://ec.europa.eu/eurostat/
A list of worldwide sales outlets is available at the:
Office for Official Publications of the European Communities.
2, rue Mercier L - 2985 Luxembourg
URL: http://publications.europa.eu
E-mail: [email protected]