Understanding the UVA environment at a sub-tropical site and
its consequent impact on human UVA exposure
Kimlin, M.Ga,b, Parisi, A.Va∗ Sabburg, J.Sa
Downs, N.Ja
∗Towhom correspondence should be addressed
a
Centre for Astronomy and Atmospheric Research, Faculty of Sciences, University of Southern Queensland, Toowoomba, AUSTRALIA. 4350. Email: [email protected]
b
National Ultraviolet Monitoring Centre, Department of Physics and Astronomy, University of Georgia, Athens, GA. 30606. USA.
Abstract
Daily UVA and erythemal irradiance data on a horizontal plane at a sub-tropical site was measured during a period from March 2000 to February 2001. On a relative basis, UVA radiation was shown to be a greater concern to human exposure during the winter months than summer months. In summer (December to February), the peak daily UVA exposure was 205 J.cm-2 and in winter (June to August), the minimum daily value was 19 J.cm-2. The peak daily UVery exposure was 37 MED in summer and the winter minimum was 4 MED. The occupational work day UVA exposure to the vertex of the head was estimated using the collected UV data. The outdoor workers received 89% of the available UVA radiation whilst the home workers received 18% of the available ambient UVA radiation. This result parallels the exposure patterns of these two population groups, with the outdoor workers spending most of the working week outdoors, whilst the home workers spend small, intermittent time periods outdoors in the sun.
Author postprint of:
Kimlin, M.G. and Parisi, A.V. and Sabburg, J. and Downs, N.J. (2002) Understanding the UVA environment at a sub-tropical site and its consequent impact on human UVA
exposure. Photochemical and Photobiological Sciences, 1 (7). pp. 478-482.
1.0 Introduction
Studies have shown that excessive exposure to UVA (320 to 400 nm) will produce changes in human skin similar to those caused by long term exposure to solar UVB (280 to 320 nm)(1). Until recently, most UV research has concentrated on the understanding and measurement of these shorter UVB wavelengths. These UVB exposures manifest biological responses both in the long term and in the short term, namely erythema. On the other hand, it has been shown that UVA biological damage is slow and insidious over periods of years. Additionally, UVA is transmitted through most window glass in automobiles(2), homes and offices, whereas, the UVB is not transmitted. Sabburg et al.(3) was the first published paper to present some evidence of human exposure due to cloud-enhanced UVA. Specifically, this was greater UVA exposure than otherwise expected if the cloud was not present. They found that for a fulltime outdoor worker, the additional cloud-enhanced UVA exposure, over autumn and winter, could approach approximately that of one third of a full winter’s day.
The cumulative UVA exposure effect has a much greater effect on tissue (skin and eye) damage than previously thought. UVA exposure has a possible involvement in the development of human malignant melanoma(4). Recently, the review by Wang et al.(5) reported that although still inconclusive, the data suggests that there is a potential for UVA involvement in the development of melanoma. The review recommends that until a conclusion is reached, it is necessary for the public to minimise exposure to UVA in addition to UVB. In order to do that, carefully collected scientific data on the solar UVA environment is required.
This paper investigates the UVA physical environment and the subsequent exposure of humans. The results presented in this paper will allow for a better understanding of factors that may influence personal UVA exposure.
2.0 Methods
2.1 Ambient UV Exposures
The outdoor erythemal meter was calibrated each season in clear sky conditions against a calibrated spectroradiometer, with the erythemal UV exposure, UVery, calculated using the following equation:
∫
= 400 280 ) ( ) (λ A λ dλ ST
UVery MED (1)
where A(λ) is the erythemal action spectrum(6), S(λ) is the solar spectral irradiance and T is the exposure period (15 minutes). A MED (Minimal Erythemal Dose) is defined as the minimal amount of biologically effective UV required to produce barely perceptible erythema (skin reddening) in people with skin type 1, 8 to 24 hours post UV exposure(7).
The outdoor UVA meter was calibrated in winter, in clear sky conditions against a calibrated spectroradiometer, with the UVA exposure, calculated using the following equation:
∫
= 400 320 ) (λ dλ S TUVA J.cm-2 (2)
where S(λ) is the solar spectral irradiance in 1 nm increments and T is the exposure period (15 minutes). For this calibration, the UVA spectral irradiances were measured at ten times for solar zenith angles between 51o and 66o. The calibration factor was subsequently applied to the entire measured UVA dataset presented in this paper. The resulting overall error in measuring absolute irradiances with either meter is estimated to be at best ± 10%.
The UV spectroradiometer used for calibrations in this research is a dual holographic grating (1200 lines/mm) double monochromator (model DH10, Jobin Yvon Co., France) and a UV sensitive photomultiplier tube detector (model R212, Hamamatsu Co., Japan), temperature stabilised to 15.0 ± 0.5 oC, to measure the spectral irradiances in one nanometre steps. The input optics of the spectroradiometer is based on a 15 cm diameter integrating sphere (model OL IS 640, Optronics Laboratories, Orlando, USA).
2.2 UVA Model
The development of UV irradiance models that are able to predict the ground level UV irradiance with ever increasing accuracy is an evolving process. By utilizing and combining desired features of a number of semi-empirical UV models,(8-11) a UV irradiance model (named Pro3uv) was developed. The model predicts the integrated hourly clear sky UV exposures by first calculating the 15 minute exposure with changing solar zenith angle (SZA) throughout the course of any given day.
The Pro3uv software is used as the main interface for the input of user defined scenarios
and includes provision for parameters such as time, date, location, ozone concentration, wavelength range, albedo and altitude above sea level(12). The software package provides the predicted horizontal plane UV exposure, in this case UVA exposure, as its main output.
2.3 TOMS Ozone Data
The inferred Level 1 ozone data was obtained from the NASA Total Ozone Mapping System (TOMS) instrument. The TOMS ozone data is indicative at the time of over-pass (approximately 11:15 AM local time) and the footprint for the TOMS instrument is approximately 40 km x 40 km.
2.4 Method for Determining Clear Sky Days
In this paper, clear sky days were determined by comparing the 60 minute integrated UVA and UVery data from the respective outdoor meters with the respective clear sky UV model values previously described in section 2.2. A clear sky day was registered when all data points from both meters, (UVery and UVA) summed over 60 minutes, were within ± 10% of the 60 minute integrated UV model outputs (UVery and UVA), throughout all sunlight hours of a single day.
2.5 Human UVA Exposure
Estimates of human UVA exposure due to changes in the ambient levels of UVA radiation were conducted. The daily human exposure on the vertex of the head (maximum exposure) was estimated for the Monday to Friday work-week. No weekend exposures were considered in this first case. To estimate the work weekday UVA exposure, the following equation was used:
UVAexp = AE*FO J.cm-2 (3)
(lawn-mowing contractors) and 40 home workers, through a self-reported questionnaire. Individuals were asked to mark on a simple graph the time spent outdoors and the time spent indoors in hourly intervals during the daylight hours. For this analysis, the activity indexes for each occupational group were averaged over the course of a day. The daily activity index was then averaged to give a seasonal activity index. The averaging of this index allowed for reductions in outliers and gives a more generalized representation of the exposure patterns, on a longer time scale than hourly estimates.
To gain a complete UVA exposure pattern of these population groups, two scenarios, incorporating UVA exposures during the weekend (Saturday and Sunday) period, are considered. The scenarios presented are the estimated UVA exposure during March 2000 to February 2001, including weekends. The activity index of population groups varies on the weekend due to the increased amount of leisure time available. Scenario 1 utilizes the following: Outdoor workers spending more time indoors on the weekends, FO=0.5 and home workers spending greater time outdoors on the weekends, perhaps engaging in recreation, with a FO=0.75. Scenario 2 used outdoor workers FO=0.1 and home workers FO=0.9.
3.0 Results
3.1 Ambient UVA and Erythemal UV Exposures
Figure 1 shows the daily UVA and erythemal exposures on a horizontal plane during a period from March 2000 to February 2001 (5° < noon time SZA < 50°). Day to day variations were observed in the collected data due to clouds and other atmospheric processes. In summer (December to February), the peak daily UVA exposure was 205 J.cm-2 and in winter (June to August), the minimum daily value was 19 J.cm-2. The peak daily UVery was 37 MED in summer and the winter minimum was 4 MED.
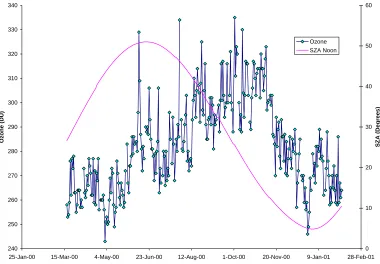
The association between the collected TOMS ozone values and the noontime SZA is shown in Figure 3. As expected, the highest ozone concentration does not, for Toowoomba, coincide with the largest SZA. The relationship between the ratio of UVA to UVery and the total ozone column is shown in Figure 4 (some TOMS data is missing). As the ozone levels increase, so does the ratio of UVA to UVery. This indicates that the UVA wavebands are essentially independent of the amount of ozone, which greatly affects the UVery component of the spectrum. This has implications for human UV exposure, as the general public associates more ozone with less UV. In fact, the UVA irradiances do not vary significantly when there are significant day-to-day ozone variations.
In order to undertake an order of magnitude check on the collected UVA data, the measured daily UVA irradiances were compared to the modelled values from the ambient UVA broadband meter as shown in Figure 5. For the model, the ozone level and aerosol optical depth (AOD) was kept at a constant 300 DU and 0.2 respectively throughout the year. Variations between the modelled and measured UV wavebands are due to mismatches between the model and actual measurements as well as changing atmospheric conditions, such as ozone and aerosols, which this model does not consider. This difference will be addressed in the next version of the UV modelling software. Interestingly, the greatest difference between the measured and modelled UV data occurred during summer when the solar zenith angles are the smallest. This may be due to the model handling the diffuse component of the radiation calculations better than the direct component. Variations also exist in this data due to the effect of the atmospheric composition, in particular clouds, on the measured UV data. These variations can also include cloud enhancements, namely above the value of 1, for the measured/modelled UVA ratio(3).
3.2 Clear versus Cloudy Days
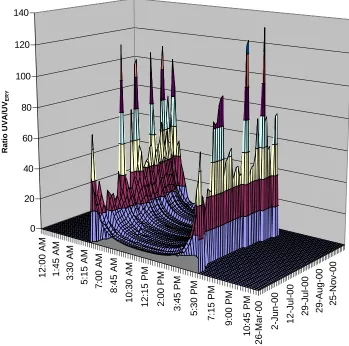
Figure 7 shows the ratio of UVA to UVery for each 15 minute interval from March 2000 to November 2000. The ratio of UVA to UVery is lowest at solar noon, with an approximate ratio of 5:1, whilst in early morning and late evening, ratios as high as 120:1 for a 15 minute interval were found.
3.3 Human UVA Exposure Estimates
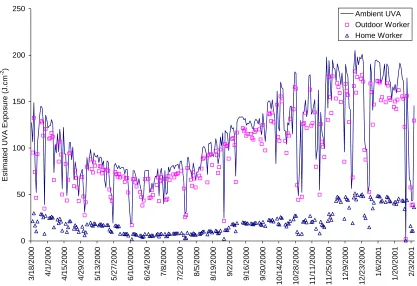
Figure 8 shows the estimated daily UVA exposure to the vertex of the head for the period from March 2000 to February 2001 for outdoor workers and home workers during a work-week. As the measurements were conducted for the vertex of the head only, the data presented is the highest UVA exposure an individual in that occupation may receive. The UVA exposure during the winter months is reduced both for the outdoor workers and the home workers. This is due to the colder ambient temperatures causing the workers to spend a greater proportion of their day indoors and the ambient UVA levels are lower.
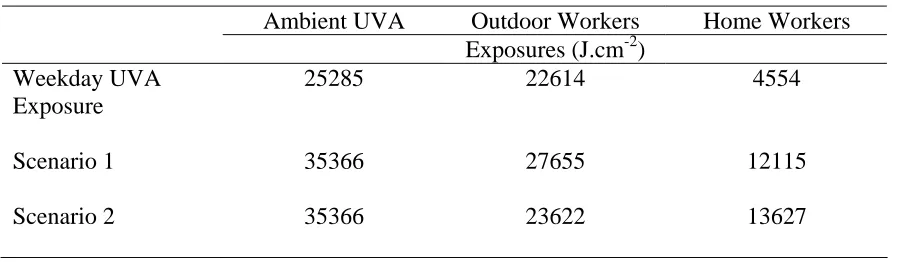
Table 1 summarises the data presented in Figure 8 allowing for the estimation of the occupational UVA exposure to this group of the population during a work-week. The weekday (occupational) UVA exposure to the vertex of the head for the outdoor workers was 89% of the available UVA radiation whilst the home workers received 18% of the available ambient UVA radiation. These results parallel the exposure patterns of these two population groups, with the outdoor workers spending most of the working week outdoors, whilst the home workers spend small, intermittent time periods outdoors in the sun.
This situation changes when scenarios 1 and 2 are implemented to the UVA exposure estimation. Here, the outdoor workers spend time indoors on the weekends whilst the home workers spend more time outdoors on the weekends, with both groups maintaining the same work-week UVA exposure patterns. The outdoor workers reduced their UVA exposure to 78% and 66% of the available UVA radiation; however, the home workers increased their UVA exposure to 34% and 39% of the ambient UVA for scenarios 1 and 2 respectively.
4.0 Discussion
This is the most extensive UVA climatology of a sub-tropical site published to date. Although this data is representative of the southern hemisphere, which has lower ozone levels than corresponding northern hemisphere sites, the effects of ozone are much diminished in the UVA compared to UVB wave bands. Thus these results are also representative of northern hemisphere sub-tropical sites, however the ratios will differ in magnitude.
SZA and the results also suggest that this applies regardless of cloud conditions, however, the overall irradiance was found to be lower under most cloudy skies.
These findings are supported in part by Blumthaler et al.(13), who found that the position of the sun in the sky is more important when considering UVA compared to UVB. However, further investigation on the position of the cloud, with respect to the position of the sun (called the scattering angle), is also required as Weihs et al.(14) found that at the single UVA wavelength of 380 nm, clouds located at greater than 60° scattering angle caused maximum enhancement in ground UVA due to reflection from the clouds.
Further studies on human UVA exposures are required in order to assess the risk associated with environmental exposure to UVA. The results provide an upper limit on the UVA exposures before the orientation of the different body sites and UV protective devices are taken into account. The results from this research suggest that humans can receive high UVA exposure on a day-to-day basis. This fact combined with results from previous research measuring UVA irradiances inside motor vehicles(2) show that skin cancer public health campaigns should also include messages, for example clothing and broad spectrum sunscreen, relating to reducing human UVA exposure as well as UVB exposure.
Acknowledgments: This work was supported by University of Southern Queensland for the
purchase of the UVA meter. TOMS ozone data was obtained from the NASA URL:
References
1. L.H. Kligman and M. Gebre, Biochemical changes in hairless mouse skin collagen after chronic exposure to UVA radiation, Photochem. Photobiol., 1991, 54, 233-237.
2. M.G. Kimlin and A.V. Parisi, Ultraviolet radiation penetrating vehicle glass: A field based comparative study, Phys. Med. Biol., 1998, 44(4), 917-926.
3. J. Sabburg, A.V. Parisi and J. Wong, Effect of cloud on UVA and exposure to humans,
Photochem. Photobiol., 2001, 74(3), 412-416.
4. A.R. Young, Does UVA exposure cause human malignant melanoma? in Protections of
the Skin against Ultraviolet Radiations, ed. A. Rougier and H. Schaefer, John Libbey
Eurotext, Paris, 1998, 25-28.
5. S.Q. Wang, R. Setlow, M. Berwick, D. Polsky, A.A. Marghoob, A.W. Kopf and R.S. Bart, Ultraviolet A and melanoma: a review, J. Am. Acd. Dermatol. 44, 837-846.
6. CIE (International Commission on Illumination), A reference action spectrum for ultraviolet induced erythema in human skin, CIE J., 1987, 6, 17-22.
7. B.L. Diffey, Stratospheric ozone depletion and the risk of non-melanoma skin cancer in a British population, Phys. Med. Biol., 1992, 37, 2267-2279.
8. A.E.S. Green, T. Sawada and E.P. Shettle, The middle ultraviolet reaching the ground,
Photochem.Photobiol., 1974, 19, 251-259.
9. A.E.S. Green, K.R. Cross and L.A. Smith, Improved analytic characterization of ultraviolet skylight, Photochem.Photobiol., 1980, 31, 59-65.
10.P.F. Schippnick and A.E.S. Green, Analytical characterization of spectral actinic flux and spectral irradiance in the middle ultraviolet, Photochem. Photobiol., 1982, 35, 89-101.
11.R.D. Rundel, Computation of spectral distribution and intensity of solar UVB radiation,
in Stratospheric Ozone Reduction, Solar Ultraviolet Radiation and Plant Life, ed. R.C.
Worrest and M.M. Caldwell, Springer-Verlag, Berlin, 1986.
12.N.J. Downs, M.G. Kimlin, A.V. Parisi and J.J. McGrath, Modelling human facial UV exposure, Rad. Prot. Australas., 2001, 17(3), 103-109.
13.M. Blumthaler, J. Grobner, M. Huber and W. Ambach, Measuring spectral and spatial variation of UVA and UVB sky radiance, Geophys. Res. Lett., 1996, 23(5), 547-550. 14.P. Weihs, A.R. Webb, S.J. Hutchinson and G.W. Middleton, Measurements of the
Table 1: Human UVA Exposure Scenarios
Ambient UVA Outdoor Workers Home Workers
Exposures (J.cm-2)
Weekday UVA Exposure
25285 22614 4554
Scenario 1 35366 27655 12115
Figure Captions
Figure 1 – UVA and UVery daily exposures for Toowoomba, Queensland, Australia
Figure 2 – Ratio of UVA to UVery versus noontime SZA
Figure 3 – SZA and Ozone Data for Toowoomba
Figure 4 – Ratio of UVA to UVery versus Ozone (DU)
Figure 5 - Comparison of measured UVA to modelled UVA
Figure 6 – Variations in the ratio UVA/UVery versus SZA
Figure 7 - 15 minute Ratio UVA /UVery
Figure 8 – Human UVA Exposure Estimation
0 50 100 150 200 250
14-Feb-00 15-Mar-00 14-Apr-00 14-May-00 13-Jun-00 13-Jul-00 12-Aug-00 11-Sep-00 11-Oct-00 10-Nov-00 10-Dec-00 9-Jan-01 8-Feb-01 10-Mar-01
UVA Irradiance (J cm
[image:12.612.102.340.178.348.2]-2 )
y = 0.0616x + 4.9937 R2 = 0.7044
4 5 6 7 8 9 10
5 10 15 20 25 30 35 40 45 5
SZA
Ratio UVA to UV
er
y
[image:13.612.122.491.85.322.2]0
240 250 260 270 280 290 300 310 320 330 340
25-Jan-00 15-Mar-00 4-May-00 23-Jun-00 12-Aug-00 1-Oct-00 20-Nov-00 9-Jan-01 28-Feb-01
O
z
o
n
e (
DU)
0 10 20 30 40 50 60
SZ
A (
D
eg
rees)
[image:14.612.115.495.78.342.2]Ozone SZA Noon
y = 0.0407x - 5.0372 R2 = 0.8845
0.1 2.1 4.1 6.1 8.1 10.1 12.1
240 260 280 300 320 340 360
Ozone (DU)
Ratio U
VA
to Er
y
them
a
l U
[image:15.612.105.495.78.351.2]V
0 0.2 0.4 0.6 0.8 1 1.2 1.4
25-Jan-00 15-Mar-00 4-May-00 23-Jun-00 12-Aug-00 1-Oct-00 20-Nov-00 9-Jan-01 28-Feb-01
R
a
tio m
e
a
s
ur
ed UV
A to
mode
lle
[image:16.612.98.509.83.373.2]d UVA
0 10 20 30 40 50 60
0 10 20 30 40 50 60 70 8
SZA
Ra
ti
o
UVA/
UV
er
y
0 Clear
[image:17.612.157.450.101.318.2]Cloud
12:00 AM 1:45 AM 3:30 AM 5:15 AM 7:00 AM
8:45 AM
10:30 AM 12:15 PM 2:00 PM 3:45 PM 5:30 PM
7:15 PM 9:00 PM
10:45 PM
26-Mar-00
2-Jun-00 12-Jul-00 29-Jul-00 29-Aug-00
25-Nov-00
0 20 40 60 80 100 120 140
Ratio UVA/UV
[image:18.612.175.524.83.429.2]ERY
0 50 100 150 200 250 3/ 18/ 20 00 4/ 1/ 20 00 4/ 15/ 20 00 4/ 29/ 20 00 5/ 13/ 20 00 5/ 27/ 20 00 6/ 10/ 20 00 6/ 24/ 20 00 7/ 8/ 20 00 7/ 22/ 20 00 8/ 5/ 20 00 8/ 19/ 20 00 9/ 2/ 20 00 9/ 16/ 20 00 9/ 30/ 20 00 1 0/ 14/ 20 00 1 0/ 28/ 20 00 1 1/ 11/ 20 00 1 1/ 25/ 20 00 12/ 9/ 20 00 1 2/ 23/ 20 00 1/ 6/ 20 01 1/ 20/ 20 01 2/ 3/ 20 01 Est ima te d U V A Exp o sure ( J .cm -2 ) Ambient UVA Outdoor Worker Home Worker