Effects of livestock species diversity on the economic
performance of commercial farms compared to specialized
ruminant farms
Deliverable 2.2. of the Mix-Enable project
Pierre Mischler
Institut de l’élevage
1-Introduction
Organic multi-species livestock farming is poorly documented in the scientific and grey literature. One of the objectives of the Mix-Enable project was to improve the available knowledge on the functioning of these farms and their sustainability as compared to specialized livestock farms. To conduct this comparison, we used the single source of data available after consultation of the project partners, i.e. data from the French farm network Inosys. This network collects data every year on up to 2,000 livestock farms including specialized and multi-species organic livestock farms. The survey data was available in a database called Diapason. The database includes multi-species livestock farms with or without monogastrics (pigs, poultry) as well as farms specialized in ruminants. however it did not include farms specialized in monogastrics. Data was extracted from Diapason and analyzed by comparing multi-species organic livestock farms with farms specialized in ruminants in order to characterize their respective strengths and weaknesses regarding mainly two dimensions of farm sustainability and robustness, i.e. productivity and economics.
2-Presentation of the farm sample
In the database, farms specialized in ruminants counted for 74% of the sample and multi-species livestock farms (mix of ruminants, mix of ruminants and monogastrics) were the remaining 26% with a large diversity of systems. Alongside main livestock enterprises in dairy and suckler cattle or sheep, there was a large diversity of smaller enterprises with ruminants and/or monogastrics. Thus, if we had sticked to species combinations, farm samples were sometimes very limited (1-2 farms farms). To overcome this problem, farms are grouped into 3 types according to the distinction ruminants vs monogastrics:
- Specialized farms, with only one ruminant livestock enterprise (Spe) - Multi-species livestock farms with at least two ruminant enterprises (MixR)
- Multi-species livestock farms with at least one ruminant and at least one monogastric enterprises (MixRM)
Some of these farms grow cash crops, and this may affect farm economics to an extent that requires to include this component in the analysis. We distinguished between:
- 100% pasture-based of fodder-crop-based farms without cash crops (Past)
- Farms with less than 15% of the farm area for cash crops, the rest of the area being dedicated to the production of livestock feed (Crop-)
- Farms with more than 15% of the farm area for cash crops, the rest of the area being dedicated to the production of livestock feed (Crop+)
The value of 15% was the median of the area dedicated to cash crops within the farm sample.
We ended up with 9 potential farm types according to the above two categorizations.
The farm sample was heterogeneous over time as farms join and leave the network over time (Fig. 1). Farms were present from 1 to more than 15 years in the database and most of them were surveyed from 4 to 6 years over the period 2000-2016. It was decided to consider for this analysis the farms present for 3 successive years at least to limit the effects of specific years due to economic and climatic hazards (e.g. 2003 with a severe drought throughout Europe). The series of successive 3 years that displayed the largest sample sizes were selected: 2003-05 (91 farms), 2009-11 (93 farms) and 2014-16 (109 farms).
We further reduced the farm sample in the following cases : - Presence of a non-organic enterprise within the farm
- The presence of a processing unit (e.g. cheese making), touristic or contractor activity, which could bias economic results - Goat farms as they were never combined with monogastrics, unlike other farms with ruminants, they were very small in size (44% with less than 20 ha against only 6% of farms with other ruminants) and 60% of these farms had a processing activity (against 2% for farms with other ruminants)
- One farm being alone in a category (MixRM Past)
We ended up with the farm sample described in Table 1.
Table 1: Overview of the farm sample according to the category of livestock raised and to land use.
MixR MixRM Spe
Past 12 38
Crop- 12 5 104
Crop+ 20 11 77
Total 44 17 219
3-Indicators considered in the analysis
The indicators were derived from the reflection conducted in WP3 on the assessment of the structure, management and sustainability of multi-species livestock farms. The list defined in WP3 first aimed at defining the data to be collected on farms during the project farm surveys. Here we had to adjust this list according to the data available in the Inosys database. We ended up with the following list :
-Farm structure: - farm size (ha),
- ruminant livestock number (LUs),
- workforce present (work-equivalent units, WUE) on a 100 ha and 100 Lus basis. - presence/absence of monogastrics and species raised
- Farm management :
- stocking rate on the area dedicated to produce livestock feed (LU/ha ; pasture/livestock integration)
- % of pastures rotated with crops (crop/pasture integration). Since the crop rotations are not described, we hypothesized that all the temporary pastures are in rotation with crops
- % of crop area dedicated to animal feed production in the form of concentrates (crop/livestock integration) - self-sufficiency for feed concentrates (% ; crop/livestock integration)
- % of farm area dedicated to animal feed production (pasture/crop/livestock integration) - amount of organic nitrogen applied per ha (kg N/ha ; pasture/crop/livestock integration)
- Farm sustainability
- milk, meat and crop productivity (kg of meat, litres of milk and crop yield converted to kg of digestible protein/ha, to allow for a comparison with a single functional unit for all farms)
- self-sufficiency for feed concentrates (% of purchased feed concentrates/operational costs of feeding) - dependency on inputs (% of operational costs / gross product)
- dependency on public subsidies (€/ha)
- the weight of fixed costs (for equipment, buildings) (€/ha)
- economic efficiency (% of gross operating surplus (EBITDA or GDP) / gross product) - income (€/ha) with its coefficient of variation providing a proxy for farm robustness - N balance (kg N/ha)
- energy consumption (MJ/ha)
4-Results
Figure 2: Farm size and ruminant livestock number according to farm type
The mean workforce per 100 ha varies among farms, i.e. 2 UMO/100 ha in MixR, 2.3 UMO/100 ha in MixRM and 2.4 UMO/100 ha in Spe (Table 2). This difference remains when considering the mean workforce per 100 LUs: 2.1 LUs/100 LUs in MixR against 2.5 in Spe. Multi-species livestock farms with ruminants are more labour intensive than farms specialized in ruminant livestock. Multi-species livestock farms with monogastrics have a slightly higher mean workforce per 100 LUs than farms specialized in ruminant livestock (+0.2 WUE/100 LUs). The explanation most certainly lies in the presence of the monogastric livestock enterprise which mobilizes a dedicated workforce. But information was lacking in the database to confirm this hypothesis.
Table 2: Workforce present on the farms per 100 ha and per 100 Lus according to farm type
Workforce (WEU per 100 ha) MixR MixRM Spe Mean
Past 1.8 2.3 2.1
Crop- 2.0 2.6 2.4 2.3
Crop+ 2.2 2.2 2.3 2.2
Mean 2.0 2.3 2.4
Workforce (WEU per 100 LUs) MixR MixRM Spe Mean
Past 1.8 2.1 2.0
Crop- 1.9 2.2 2.5 2.5
Crop+ 2.5 3.0 2.6 2.7
Mean 2.1 2.7 2.5
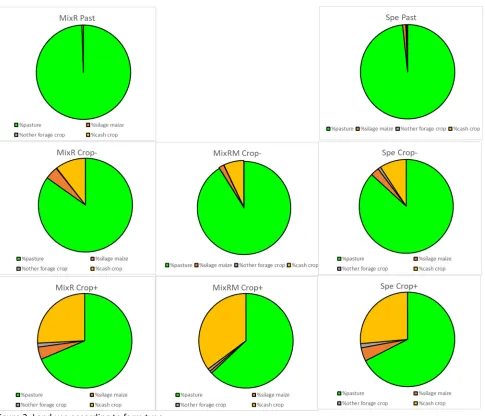
[image:4.595.52.448.352.524.2]Figure 3: Land use according to farm type
[image:5.595.56.541.45.461.2]Past and Crop- farms consumed internally almost all the biomass (fodder and grain) produced on their land: the former consumed 100% against 98% for the latter on average (Table 3). Only Crop+ farms sold a significant amount of their crop production (45% on average leading to 55% being consumed internally). There was no clear difference related to the type of livestock raised.
Table 3: Internal consumption of biomass (fodder and grain) produced on the farm according to farm type
% cropland for internal consumption MixR MixRM Spe Mean
Past
Crop- 89% 76% 78% 81%
Crop+ 48% 64% 53% 55%
Mean 63% 68% 67%
% land for internal consumption MixR MixRM Spe Mean
Past 100% 100% 100%
Crop- 99% 97% 98% 98%
Crop+ 87% 87% 88% 88%
Mean 95% 91% 95% 95%
from other farm types including ruminant livestock only: they were more dependent on feed purchases and sold the major part of their crop production. Overall, in MixRM farms, concentrates represented on average 69% of operational costs against 46-47% for farm types including ruminant livestock only. These farms also had a higher dependency on inputs (38%), almost twice that of MixR and Spe farms (23%).
Figure 4: Self-sufficiency for feed concentrates and dependency on inputs according to farm type
[image:6.595.51.249.371.532.2]The mean fertilization levels of MixR and Spe farms were very similar: 38 kg N/ha and 42 kg N/ha respectively (Figure 7). MixRM farms had a slightly higher mean N fertilization: 50 kgN/ha mainly related to MixRM Crop- farms. These farms bought more feed concentrates that led to more manure and/or slurry being produced and spread on the fields.
Figure 5: N fertilization according to farm type
The mean amount of digestible protein produced did not differ much among farm types (Table 4) and ranged between 28.4 and 29.5 kg N/ha. However, this calculation did not take into account the production of meat from monogastrics which was not available in the database. Thus the mean value of 29.3 kg N/ha is probably largely underestimated and MixRM farms are the the most productive with respect to proteins.
Table 4: Amount of digestible protein produced according to farm type
MixR MixRM Spe Mean
Digestible protein produced
(kg N/ha) 28.2 29.3 28.5 28.9
[image:6.595.50.451.636.677.2]Figure 6: Nitrogen balance according to farm type
Farms raising monogastric livestock and buying more feed concentrates had higher energy consumption (7223 Mj/ha) compared to farms raising ruminant livestock (4567 Mj/ha and 5522 Mj/ha for MIXR and Spe respectively ; Fig. 7).
Figure 7: Energy consumption according to farm type
Mean fixed costs per hectare displayed limited differences among categories of ruminant livestock raised. Still, Spe farms probably achieved higher economies of scale which led to lower fixed costs per hecatre than mixed farms. Moreover, those costs tended to be lower on Past farms compared to farms with cropping that require more equipment.
Figure 8: Fixed costs per hectare according to farm type
Figure 9: Public subsidies per hectare according to farm type
MixRM were less economically efficient than farm types raising ruminants only due to higher dependency on feed inputs. Following the same logic, Past farms raising ruminants were the most efficient (Fig. 10).
Figure 11: Economic efficiency according to farm type
Figure 12 : Income and income variability according to farm type
5-Conclusions
In terms of management, multi-species livestock farms have similarities with farms specialized in ruminants. Although the UAA and livestock herd are larger in size, the stocking rate is almost identical. These are systems that make extensive use of pastures and forage crops to feed ruminants. Temporary pastures are integrated in cropping systems, particularly on farms with cash crops. N fertilization levels are quite similar among farms with ruminants only, but farms with monogastric livestock spread higher amounts of N due to higher amounts of feed inputs.
In terms of productivity, the amount of nitrogen produced per hectare via grain, milk and meat is in the order of 28-29 kg N/ha. Farms combining ruminants and monogastrics have a slightly higher productivity i.e. 29.3 kg N/ha even when excluding the production of meat from monogastrics, which is 3-4% higher than that of farms with ruminants only. However, if we would have included the meat from monogastrics the difference of productivity would have been much higher, at the cost of a greater dependence on feed inputs.
Multi-species livestock farms including monogastrics sold more cash crops and bought more feed. This exogenous source of nitrogen contributed to a slight nitrogen surplus, in the order of +30 kgN/ha, which remains lower than in conventional farming systems, while farms specialized in ruminant livestock had balances close to nil.
Multi-species and specialized livestock farms received similar amounts of CAP subsidies. Multi-species livestock farms had higher fixed costs especially when including monogastrics (821 €/ha compared to 712 €/ha for MixR and 733 €/ha for Spe). They were also more dependent on inputs (operational costs equal to 1131 €/ha against about 500 €/ha in case of ruminants only) which reduced their economic efficiency.
In the end, it can be concluded that in the multi-species and specialized livestock farms of this database, ruminant enterprises are on average very self-sufficient for feeding, whatever the type of farm. This self-sufficiency increases with the proportion of cash crops. On the other hand, the monogastric enterprise, although bringing diversity, appeared to be relatively disconnected from the rest of the farm by being highly reliant on feed purchases.
These results are based on surveys in organic farms. Similar results were found on conventional farms in the framework of the French Casdar project RED-SPyCE.
To conclude:
- Livestock diversity by mixing ruminants and monogastrics appears to provide slight economic benefits in terms of income and stability of income. This may be an argument in favour of diversified farms.
- However, those farms are more expensive in terms of operational and fixed costs. This can make these farms more dependent on economic conditions, especially in the event of a sharp increase in feed concentrates prices.
- The nitrogen surplus due to feed purchases raises the question of optimizing nitrogen fertilization in these systems.