Theoretical and Applied Climatology
Variability of maximum and mean average temperature across Libya (1945-2009)
--ManuscriptDraft--Manuscript Number: TAAC-D-12-00429R1
Full Title: Variability of maximum and mean average temperature across Libya (1945-2009)
Article Type: Original Paper
Corresponding Author: Ismail Ageena, MSc University of Liverpool
Liverpool, Merseyside UNITED KINGDOM Corresponding Author Secondary
Information:
Corresponding Author's Institution: University of Liverpool Corresponding Author's Secondary
Institution:
First Author: Ismail Ageena, MSc
First Author Secondary Information:
Order of Authors: Ismail Ageena, MSc
Neil Macdonald, PhD Andrew P Morse, PhD Order of Authors Secondary Information:
Abstract: Spatial and temporal variability in daily maximum, mean average daily temperature, monthly maximum and mean average monthly temperature for nine coastal stations during the period 1956-2009 (54 years) and annual maximum and mean average temperature for coastal and inland stations for the period 1945-2009 (65 years) across Libya are analysed. During the period 1945-2009 significant increases in maximum temperature (0.017 °C/year) and mean average temperature (0.021 °C/year) are identified at most stations. Significantly warming in annual maximum temperature (0.038 °C/year) and mean average annual temperatures (0.049 °C/year) are observed at almost all study stations during the last 32 years (1978-2009). The results show that Libya has witnessed a significant warming since the middle of the twentieth century, which will have a considerable impact on societies and the ecology of the North Africa region, if increases continue at current rates.
Variability of maximum and mean average temperature across Libya (1945-2009)
I. Ageena*, N. Macdonald, A.P. Morse
Department of Geography and Planning
School of Environmental Sciences University of Liverpool,
Liverpool L69 72T
t: 01517942567
f: 01517942866
*Manuscript
Click here to download Manuscript: Revised T paper 25-7-2013 final.docx
Click here to view linked References
ABSTRACT
Spatial and temporal variability in daily maximum, mean average daily temperature, monthly
maximum and mean average monthly temperature for nine coastal stations during the period
1956-2009 (54 years) and annual maximum and mean average temperature for coastal and
inland stations for the period 1945-2009 (65 years) across Libya are analysed. During the
period 1945-2009 significant increases in maximum temperature (0.017 °C/year) and mean
average temperature (0.021 °C/year) are identified at most stations. Significantly warming in
annual maximum temperature (0.038 °C/year) and mean average annual temperatures (0.049
°C/year) are observed at almost all study stations during the last 32 years (1978-2009). The
results show that Libya has witnessed a significant warming since the middle of the twentieth
century, which will have a considerable impact on societies and the ecology of the North Africa
region, if increases continue at current rates.
KEYWORDS: maximum,climate; warming; temperature variability; trends; Libya. 1
1. Introduction
During the last four decades, a large body of research has been undertaken on climatic change
at local, regional and international levels (e.g. Domonkos and Tar, 2002; Wibig and Glowicki,
2002) examining a variety of climatic parameters, particularly temperature. The
Intergovernmental Panel on Climate Change (IPCC, 2007) fourth report concluded that global
mean temperature had increased by 0.74 °C ± 0.18 °C over the last 100 years (1906-2005),
with considerable spatial variations. The IPCC’s rate of change are supported, with varying
rates of change, by Jones et al. (1999: ~0.62 °C), Hansen et al. (2006: 0.8 °C), Alexander et al.
(2006: 0.74 °C) and Rebetez and Reinhard (2008: 0.8 °C), the later identifying particularly
rapid rates of increase during the periods 1920-1945 and 1975-2008.
Within the Mediterranean region a number of studies have investigated temperature change
over the last 150 years, with a general pattern of increasing temperatures, but with considerable
spatial and temporal variability. Campra et al. (2008) investigated long-term temperature time
series (1950-2006) in south-eastern Spain and identified slight increases in annual maximum
temperature, with significant warming trends in mean annual surface air temperature during the
period 1983–2006, a finding replicated in the study by Brunet et al., (2007) analysing temporal
and spatial temperature patterns across Spain (1850–2005) found a significant increase in
annual mean surface temperature. Juan and Antonio (1996) examined spatial and temporal
temperature variability across the Spanish peninsular (including Canary Islands), identifying
mean temperature increases at 63% of stations, decreasing at 10%, with insignificant change at
54% of the study stations over the period 1901-1989. Hasanean and Abdel Basset (2006)
investigated variability in summer temperature across Egypt, based on monthly temperatures
for 19 stations (1987-2000) found a general warming trend in summer surface air temperature
at most of stations, while negative trends in Upper Egypt. Similarly Xoplaki et al. (2003)
identified that warmer Mediterranean summers characterize the 1950s, 1980s and 1990s, with a
significant increase of 0.05 C/decade over the period 1980 to 1999. Aesawy and Hasanean,
(1998) studied variations in mean average temperature at six southern Mediterranean stations
(including Tripoli 1944-1991), in which their results identified a significant warming for all
stations, except Tripoli; though the suitability of the climatic station used for Tripoli City may
require reconsideration, as it is located on the second floor of a building, on a concrete surface
with surrounding buildings overshadowing the station. The above studies illustrate the variety
of previously identified trends in temperature change around the Mediterranean region.
In Libya, relatively few studies have been undertaken of either long-term climate change or in
the spatial variations and trends in temperature data (El-Tantawi, 2005; El-Kenawy et al., 2009;
Ageena et al. 2012), with no clear patterns identified. El-Tantawi (2005) identified significant
warming trends in mean annual surface temperature (1946-1999), in contrast to El-Kenawy et
al. (2009) who identified negative trends in annual maximum temperature at all stations across
Libya (1951-1999), with significant decreases at 70% of stations. The later represents
something of an anomaly within the wider research, within both Libya and the Mediterranean
region.
The present paper seeks to examine temperature across Libya with a particular focus on
examining spatial and temporal variability of maximum and mean average temperature during
the period 1945-2009. Specifically, the objectives of this paper are as follows:
i. To identify temporal fluctuations and patterns in maximum and mean average
temperature across Libya over two climatic regions (coastal and inland) based on (a)
annual data, (b) seasonal data, (c) monthly data, and (d) daily data;
ii. To identify and examine any spatial changes within the data;
iii. To understand any associations between temperature and geographic parameters (e.g.
altitude or distance from the sea); and,
iv. To provide the most comprehensive analysis of observed temperature across Libya.
2. Method
2.1 Study area
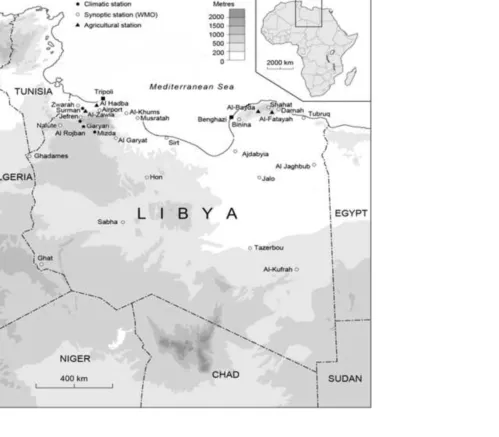
Libya is located in central North Africa; with the Mediterranean as its northern border, with
approximately 2000 km of coastline (Figure 1). The country is located between latitude (20° to
34° N) and longitude (10° to 25° E) within which roughly 90.5% of the area is classified as
hyper-arid (Ben-Mahmoud 1995). The topography is generally free of steep terrain, with the
exception of two regions in the north-west and north-east, where elevation ranges from 500 to
~1000 m above mean sea level (a.m.s.l.; Al-Haram 1995). The climate of Libya is
characterized by wet winters and hot dry summers and shows a transition between the
Mediterranean and temperate climates to the arid climates of the interior. The population of
Libya in 2006 was estimated by the General Directorate of Documentation and Information
(GDDI) at 5,323,991, with the projected population for the year 2025 near 10 million.
2.2 Station selection
Temperature data was collected from the Libyan National Meteorological Centre (LNMC).
Daily and monthly data are available for mean maximum and mean average temperature
(monthly mean values of average temperature are computed from their corresponding daily
values calculated from the maximum and minimum temperatures over the month (maximum
temperature + minimum temperature /2) for the study stations across Libya. The sample of the
present study involves 18 synoptic stations within the study area, selected from a total of 38
meteorological stations distributed across Libya.
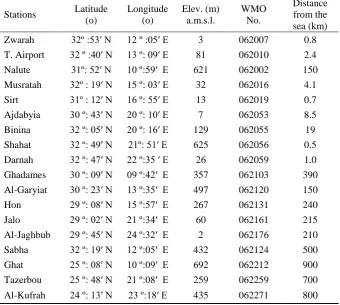
The names and reference numbers (World Meteorological Organization-WMO) of the
proposed stations are provided in (Table 1 and), which includes altitude, distance from the sea,
details of record length and resolution are provided in Table 2. Twenty Libyan meteorological
stations have been omitted, mainly because the meteorological station records are short (less
than 30 years) and/or they include large periods for which no records exist, resulting from
shortages in technical or human capabilities, as such those stations are considered inappropriate
for further evaluation in the present study.
Suggested Location of Table 1 and Table 2
The initial division of Libya into two regions (coastal and internal) permits further analysis of
the potential mechanisms responsible for changes in temperature. Nine stations were selected
along the Mediterranean coast (coastal stations) and nine stations from southern Libya (inland
stations). The coastal region is located north of 30º 45′ N and includes nine stations (Figure 1):
Zwarah, Nalute, Tripoli Airport, Musratah (western-coastal region), Sirt, Ajdabiya
(central-coastal region), Binina, Shahat and Darnah (eastern-(central-coastal region); these stations all have a
typical Mediterranean and semi-arid climate, rain in winter with hot and dry summers. The
inland region is located south of 30º 45′ N and is represented by nine stations: Ghadames,
Al-Garyiat, Hon, Jalo, Al-Jaghbub, Sabha, Ghat, Tazerbou and Al- Kufrah; the climate is typically
dry arid and characterized by high temperatures.
The present study focuses on data recorded for the period 1945-2009, as dataset integrity
improves considerably after 1945 at the majority of stations, with missing data a significant
issue prior to 1945. Monthly datasets for all examined stations during the period 1945-2009 are
used in this paper and were checked for completeness (Table 2). Daily datasets are only
available for the period 1956-2009 (54 years) at nine coastal stations. An analysis of the data
was undertaken to ensure that data quality was of high integrity, with any year consisting of
missing data exceeding three months, and/or, any month with ≥11 missing days being removed;
approaches recognised by WMO and applied at the Data Process Unit (DPU) in the LMNC.
The number of missing days at the nine costal stations (1956-2009) ranges between 0.1%
(Tripoli Airport) and 1.6% (Nalute); with the highest number of missing months 1.7%
(Al-Garyiat; 1945-2009).
2.3 Method and analyses
In this paper observed time series of daily maximum and mean average daily temperature
(1956-2009) from nine coastal stations and monthly maximum and mean average monthly
temperature (1945-2009) from six inland stations across Libya, part of the observational
network of Libya are used. The daily data were unavailable for the inland stations, so
comparison within this paper uses daily and monthly data for the coastal sites and then
undertakes comparison between inland and coastal stations on only annual data.
The significance of trends in maximum and mean average temperature for 1945-2009 are tested
using the Mann-Kendal significance test (Sneyers, 1990; Mitchell et al., 1996; Salmi et al.,
2002). Where trends are identified, the non-parametric Sen’s slope test is applied to determine
change per unit time, to detect the significance of the trends. The significant of difference
trends (0.05%) in daily and monthly maximum and mean average monthly temperature of the
two periods are tested using the Mann-Whitney test (Rose 2007; Soltani et al. 2012).
3. Temperature variability across Libya
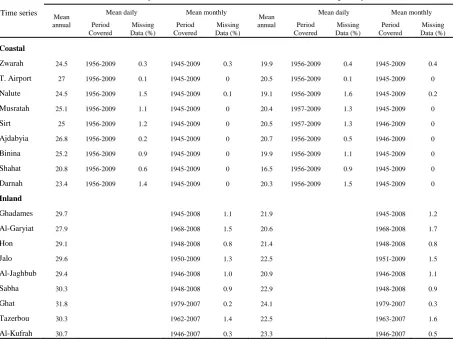
The mean average annual temperature of Libya is 20.8 °C, with temperatures ranging between
16.5 °C and 24.1 °C (Table 2), with mean average daily temperature ranging between 13.0°C
(winter) and 28.4 °C (summer). Across Libya the average annual maximum temperature ranges
between 20.8 °C and 31.8 °C (Table 2), with the hottest months July (34.6 °C) and August
(34.9 °C) and the coldest January (17.8 °C) (1945-2009).
Temperature is characterized by slight variability (spatial and temporal) within regions, but
with greater variability across regions, with a standard deviation (SD) of annual maximum
temperature ranging between 0.5 and 1.12 °C and mean average annual temperature between
0.4 and 1.1 °C. The coefficient of variation (COV) represents the ratio of the standard deviation
to the mean and is valuable in comparing the degree of variation from one data series to
another, even if the means are drastically different from each other. The COV of mean annual
maximum temperature ranges between 2.9% (coastal stations) and 3.7% (inland stations), while
the COV of mean average annual temperature is 2.6% at coastal stations and a comparable
2.7% at inland stations.
4. Results
4.1 Multi-decadal variations in temperature
4.1.1 Daily variations and trends of maximum and mean average temperature
Daily maximum and mean average daily temperature data are available for nine coastal stations
during the period (1956-2009). The study period is divided into two series of equal length (27
years), 1956 to 1982 and 1983 to 2009, referred to as period 1 and period 2, respectively.
Statistical analysis of the 27 year periods and the nearest comparable 30 year period
(1956-1985 and 1980-2009) identifies no apparent difference in the statistical character of the two
groups; the WMO recommends that analysis be undertaken on 30 year periods, as it assumes no
issues with data limitation.
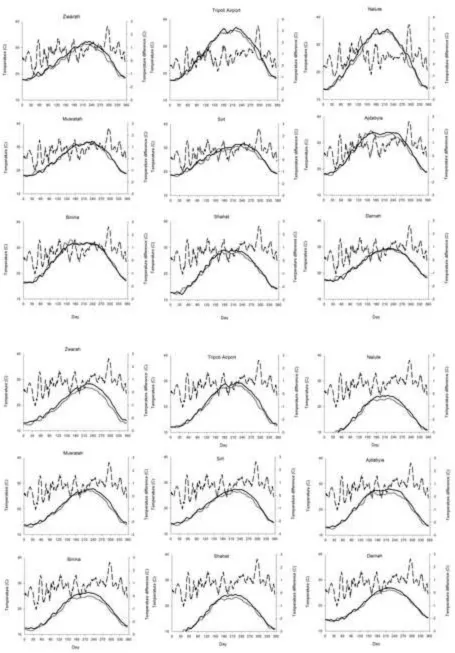
In order to examine temporal changes in temperature, a time series of 11-day moving average
mean daily maximum and mean average daily temperature for the periods 1956-1982 and
1983-2009 were analysed (Figure 2). The daily data are considered at the nine coastal stations
as these provide a much more complete depiction of temperature change. Changes in the
maximum 11-day daily temperature show (Fig. 2a) that period 2 is characterized by generally
higher temperatures compared to period 1 at all stations, particularly during days 30-300 of the
year (using Gregorian day, i.e. the first of January is the first day of the year).
Changes in mean average 11-day daily temperature show that period 2 is characterized by
higher temperatures compared to period 1, in most days of the year at all examined stations
(Fig. 2b). Differences in mean daily maximum and mean average daily temperature are
identified when comparing between the two timeframes, with the second period significantly
higher (95% confidence level) at most stations: Zwarah, Nalute, Sirt, Ajdabyia and Binina for
the maximum temperature and at all coastal stations for mean average daily temperature.
Suggested Location of Figure 2a & 2b
4.1.2 Monthly variations and trends of maximum and mean average temperature
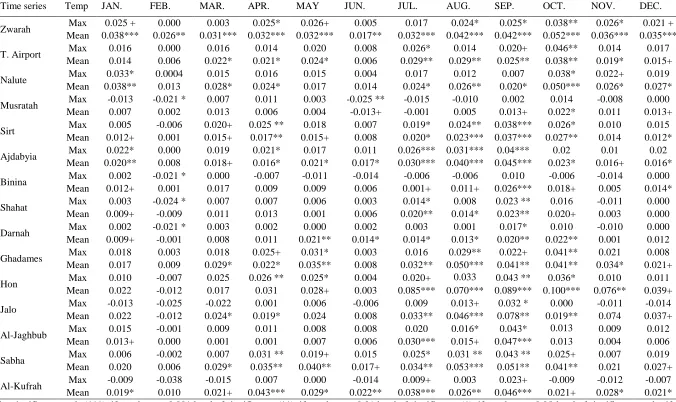
The rates of increase in maximum temperature during the months April-October are greater
than the rates of decrease recorded during the months November-March, as such the high rates
of change are strongly positive (Table 3). Significant trends are identified at 12 of the 15
stations in September (excluding Al-Garyiat, Ghat and Tazerbou), with increases at Sirt,
Ajdabyia (significance level: 0.001), Shahat, Hon, Sabha (0.01), Zwarah, Darnah, Al-Garyiat,
Jalo and Al-Jaghbub (0.05, Tripoli Airport, Ghadames and Al-Kufrah (0.1). In April, a positive
change is identified at all stations except Binina, increases range from 0.001(Jalo) to
0.031°C/year (Al-Jaghbub, Sirt, Hon and Sabha; 0.01), at Zwarah and Ajdabyia (0.05) and at
Ghadames (0.1). Positive trends in maximum temperature are identified during May-October,
particularly at central and inland stations, with significant increases (0.001) identified in July
(Ajdabyia), August (Ajdabyia and Hon), September (Sirt and Ajdabyia) and October
(Al-Jaghbub). In February negative changes (-0.038 and -0.001 °C/year) in maximum temperature
are indicated at ten stations: Musratah, Sirt, Binina, Shahat, Darnah, Hon, Jalo, Al-Jaghbub and
Al-Kufrah, with a significant decreases at Musratah and the eastern-coast stations (0.05).
Positive mean average temperature trends are identified during the May-October at all stations
(0.001 to 0.100 °C/year) particularly during July-October (Table 3). Significant trends are
identified at almost all stations during July-September, except Musratah (July and August
only). In September significant increases are identified at all stations: Zwarah, Sirt, Ajdabyia,
Binina, Hon, Al-Jaghbub, Sabha, Tazerbou, Al-Kufrah (0.001), Tripoli Airport, Shahat,
Darnah, Jalo (0.01), Nalute and Musratah (0.1). In February, negative mean average
temperature trends ranging between -0.012 and -0.001 °C/year are identified at Musratah,
Shahat, Darnah, Hon and Jalo (not significant). A positive trend in mean average monthly
temperature is identified for Zwarah for all months (0.001; Table 3).
Suggested Location of Table 3
In order to examine differences in monthly temperature across Libya, the variability of mean
monthly maximum and mean average monthly temperature at 15 stations (1945-1977 and
1978-2009) across Libya are analysed; the stations at Al-Garyiat, Ghat and Tazerbou are not
included, as these stations have later start dates (see Table 3). Mean monthly maximum
temperature during the last 32 years (1978-2009) show higher maximum temperature for all
months at Zwarah, Tripoli Airport, Nalute, Ghadames and Ajdabyia; and during April-October
at Sirt, Shahat, Hon, Jalo, Al-Jaghbub and Sabha compared to the earlier period (1945-1977).
Mean average monthly temperatures are also higher in the second period (1978-2009)
compared to the first (1945-1977) for all months at Zwarah, Tripoli Airport, Nalute, Ajdabyia,
Ghadames and Al-Jaghbub; with higher temperatures during April-October at Sirt, Binina,
Shahat, Hon, Jalo and Sabha.
4.1.3 Seasonal and sub-seasonal variations of temperature
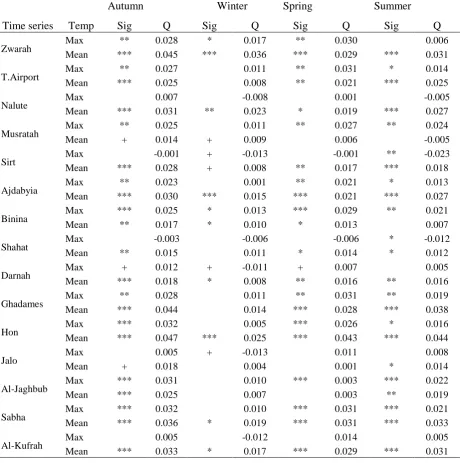
Seasonal maximum temperatures across Libya for the period 1945-2009 were analysed.
Positive changes in seasonal maximum temperature are indicated at most stations in autumn,
winter spring and summer (Table 4). In autumn increases in maximum temperature are
observed at 13 of the 15 stations, with increases ranging between 0.005 and 0.032 °C/year
(Table 4). Increases are identified for the winter season at nine stations, ranging from 0.001
(Ajdabyia) to 0.017 °C/year-Zwarah), with negative changes identified at seven stations, with
an average decrease of -0.011 °C/year, with significant decreases found at Sirt, Darnah and
Jalo (0.1; Table 4). Positive changes in spring maximum temperature are identified at most
stations, ranging from 0.001 (Nalute) to 0.031 °C/year (Tripoli Airport, Ghadames and Sabha).
Increases in maximum temperature are observed at 12 of 15 stations in summer, ranging from
0.005 (Darnah and Al-Kufrah) to 0.024 °C/year (Musratah).
Increases in mean average seasonal temperature are identified at most stations, in each season
but at different rates across Libya during the period 1945-2009. The mean average temperature
shows positive changes at the majority of stations in autumn (0.014-0.028 °C/year), winter
(0.001-0.014 °C/year), spring (0.013- 0.019 °C/year) and summer (0.007- 0.024 °C/year).
Significant increases in mean average temperature are found at all stations in autumn, winter,
spring and summer, with the exception of Musratah (summer; Table 4).
Suggested Location of Table 4
4.1.4 Annual variations and trends of maximum and mean average temperature
To estimate changes and trends in temperature, the annual average maximum and mean
average annual temperature of stations during the period 1945-2009 (65 years) are analysed
based on the Mann-Kendall test.
Maximum temperature increases are identified at 10 of 15 stations during the period
1945-2009, ranging between 0.002 (Shahat) and 0.024 °C/year (Sabha) of which nine are significant
increases: Zwarah, Tripoli Airport, Nalute, Sirt, Ajdabyia, Ghadames and Hon (0.001);
Al-Jaghbub and Sabha (0.01). Negative trends in maximum temperature found at five stations,
ranging between -0.009 (Jalo) and -0.002 °C/year (Darnah); non-significant decreases are
recorded at Musratah, Darnah and Al-Kufrah, with significant decreases at Jalo (0.05) and
Binina (0.1; Table 5).
To estimate changes and trends in maximum temperature for the period 1945-1977, annual
average maximum temperature for 15 stations across Libya have been analysed (excluding
Al-Garyiat, Ghat and Tazerbou). Positive changes are identified at eight stations, at an average rate
of 0.013 °C/year, with a significant increase at only Shahat (0.1). Decreasing annual maximum
temperature, at an average rate of -0.027 °C/year are identified at the western stations; Zwarah,
Tripoli Airport, Nalute, Musratah, and the southern-east stations: Hon, Jalo and Al-Kufrah,
with significant decreases at Jalo (0.001) and Musratah (0.01; Table 5).
An increase in annual maximum temperature at all (18) stations within this study is identified
during the last 32 years (1978-2009), ranging from 0.006 °C/year (Shahat) to 0.053 °C/year
(Tripoli Airport). Significant increases are identified at 15 of the 18 stations (Table 5): Zwarah,
Tripoli Airport, Nalute, Musratah, Sirt, Ajdabyia, Hon, Sabha, Al-Kufrah (0.001), Tazerbou
(0.01), Binina, Darnah, Ghadames, Jalo and Ghat (0.05). The result of the Mann-Kendal test
identified an increase in mean average annual temperature for the last 33 years (1978-2009) at
all stations; with significant increases (Table 5) at 14 of the 18 stations at a 0.001 and at
Al-Garyiat, Ghadames, Ghat (0.01) and Shahat (0.05).
A positive trend in mean average annual temperature at all stations (15) within this study is
identified during the period 1945-2009, ranging between 0.003 °C/year (Al-Jaghbub) and 0.043
°C/year (Hon; Table 5). Significant positive trends are identified at 9 stations, with analysis of
mean average temperature during the period 1945-1977 found weak positive trends at seven
stations: Nalute, Sirt, Ajdabyia, Binina, Shahat, Darnah and Sabha at an average rate of 0.012
ºC/year (Table 5); with negative trends ranging from 0.01 to 0.05 ºC/year identified at Zwarah,
Ghadames, Hon, Al-Jaghbub and Al-Kufrah, with significant decreases at Musratah (0.001)
and Jalo (0.05).
Suggested Location of Table 5
4.2 Decadal variations of maximum and mean average temperature
Daily data
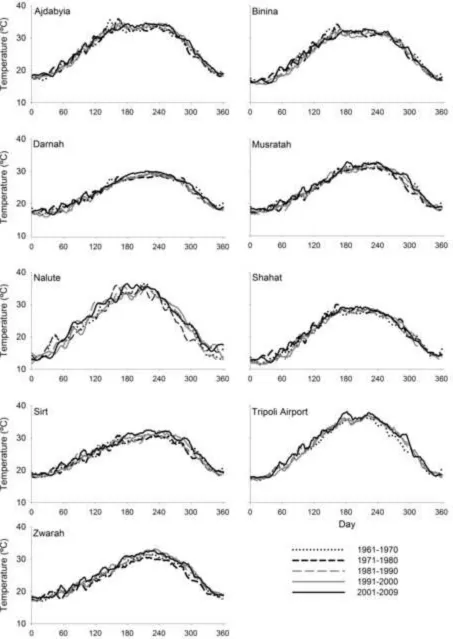
To examine the characteristics and distribution of the daily maximum and mean average daily
temperature at the nine coastal stations during the period 1961-2009, analyses of the daily
11-day maximum and mean average temperature was undertaken with comparison over 10-year
intervals; 1961-1970, 1971-1980, 1981-1990, 1991-2000 and 2001-2009 (only nine years of
daily data are available, as the data for 2010 is currently unavailable).
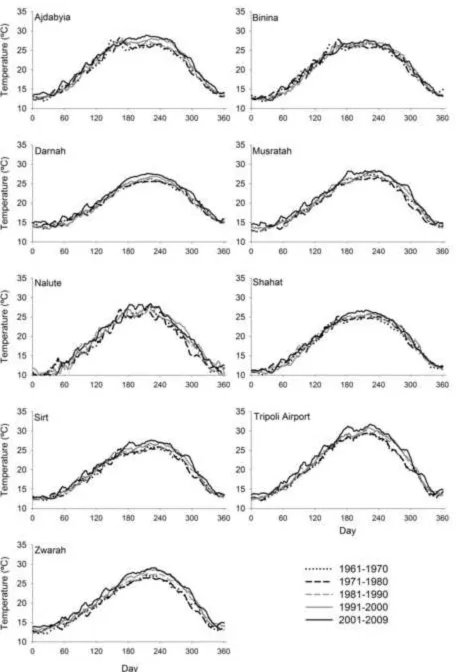
The maximum summer temperature during days 170-270 of the year, for the 10-year intervals
has increased rapidly over the study period, with notable increase during the period 2001-2009
at most stations: Tripoli Airport, Musratah, Sirt, Ajdabyia, Binina, Shahat and Darnah (Figure
3). A similar pattern is also present in the mean average temperature days 170-270, with
gradual increases over the 10-year intervals, and a rapid increase in the period 2001-2009 at all
stations within this study, particularly Tripoli Airport Ajdabyia, Binina and Shahat (Figure 4).
Suggested Location of Figure 3 & 4
Monthly data
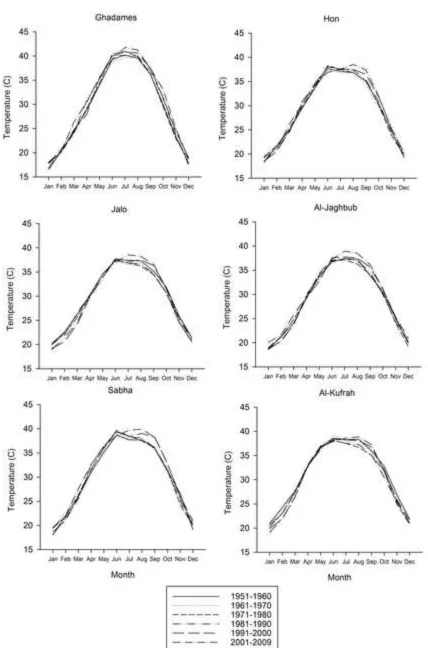
Monthly temperature data are used to examine the characteristics and distribution of decadal
maximum and mean average temperature for the inland stations during the period 1951-2009.
Analyses of the monthly maximum and mean average monthly temperature for six inland
stations was undertaken with comparison over 10-year intervals: 1951-1960, 1961-1970,
1971-1980, 1981-1990, 1991-2000 and 2001-2009 (only nine years of data available). The annual
maximum temperature at inland stations fluctuated during the period 1951-2009 with
maximum spring temperature (March, April and May) much higher for the period 2001-2009.
The south-western stations (Ghadames and Sabha) July-October temperatures were much
higher during the last decade (2001-2009) than for the south-eastern stations (Hon, Jalo and
Al-Jaghbub; Figure 5). The mean average annual temperature of the inland stations has fluctuated
over the period 1951-2009; with temperatures during the months March-October increasing
rapidly, with much higher temperatures over the period 2001-2009 at all stations (Figure 6).
Suggested location of Figure 5 & 6
5. Discussion
In this work, time series of daily, monthly, seasonal and annual maximum and mean average
temperature data, or subsets of, for the period 1945-2009 (65 years) at 15/18 synoptic stations
across Libya are analyzed.
The estimation of differences in mean annual average and maximum temperature for the two
study periods (1945-1977 and 1978-2009) at 15 stations across Libya (excluding Al-Garyiat,
Ghat and Tazerbou) identifies that the later period is characterized by more rapid warming at
all stations for mean average temperature and at nine stations (Zwarah, Tripoli Airport, Nalute,
Sirt, Ajdabyia, Ghadames, Hon, Al-Jaghbub and Sabha) for maximum temperature. Significant
increases in maximum temperatures are identified at 13 of the 15 stations for the period
1945-2009; with significant decreases in maximum temperature at seven of 15 stations during the
period 1945-1977, and significant increases at 15 stations for the period 1978-2009. This study
has identified that maximum temperature has increased at an average rate of 0.012 °C/year
during the period 1945-2009 with a rapid warming (0.034 °C/year) for the last 32 years
(1978-2009). The rates of change identified above are greater than those previously identified by
El-Tantawi (2005), 0.0035 °C/year (1946-2000); are comparable to Jones et al. (1999) of 0.008
°C/year (1950-1993) and contradict the decreases identified by El-Kenawy (2009), -0.0006
°C/year (1951-1999).
Monthly maximum temperature trends identify high rates of increase, ranging between
0.021°C/year (June) and 0.150°C/year (December); with a particularly strong trend identified
in September at all stations, with significant increases at 83.2% of stations. The rates of change
in monthly maximum temperature vary spatially during the period 1945-2009, with the
south-west region experiencing the highest rates of increase in the March-May, and the south-east in
June-August for 1978-2009; the cause for this is at present unclear and will require further
study, with a higher station density in the inland region required. In February negative changes
(-0.038 and -0.001 °C/year) in maximum temperature are identified at 56% of stations, with
significant changes identified at Musratah and most eastern stations (Binina, Shahat, Darnah,
and Al-Kufrah); this represents a new finding, which may suggest a decrease in the strength of
Indian air mass and increasing of Atlantic air mass dominance during the period of study
(1945-2009) over Libya.
Mean average annual temperatures showed significant increases at 13 of the 18 stations for
1945-2009, with significant increases at all (18) stations during the last 32 years (1978-2009).
This is a result of the mechanism by which mean average temperature is calculated (maximum
+ minimum/2), as Ageena et al, (2012) has shown significant increases in minimum
temperature across Libya during the period 1945-2009 at all stations, at rates greater than
identified for maximum temperature within this paper. Decreases in mean average temperature
are found at seven of 15 stations, of which two are significant decreases (Musratah and Jalo) at
an average rate of -0.003 °C/year during the period 1945-1977, with significant rates of rapid
warming (0.048 °C/ year) at all stations during the last 32 years (1978-2009). High rates of
mean average seasonal temperature increase (1978-2009) have been identified, 0.016°C/year
(winter), 0.023°C/year (spring), 0.028°C/year (summer) and 0.037 °C/year (autumn), with the
summer and autumn increases raising concerns for the future. This study has identified that
mean average (surface) temperature has increased at an average rate of 0.024 °C/year during
the period 1945-2009. The rates of change identified above are higher than those identified by
the IPCC (2007), which identified two phases of increasing mean average temperature,
1910-1940 (0.035 °C/decade) and 1970-2005 (0.055 °C/decade). In addition, El-Tantawi (2005),
identified increasing mean average temperature, but with low rates of change of 0.014
°C/decade (0.001°C/year) for the period 1946-2000, whilst Jones et al. (1999) identified a rate
of 0.062 °C/decade (0.0062 °C/year) during the period 1901-1997.
No evidence is found to relate any of the identified changes directly with maximum
temperature and altitude or distance from the sea, these parameters are likely to have a greater
influence on other climatic variables e.g. precipitation.
6. Conclusion
The analyses of maximum and mean average temperature observed at 18 meteorological
stations across Libya during the period 1945-2009 exposes well-pronounced seasonal and
annual patterns, with a warming tendency of both mean average and maximum temperature
during both cool and warm seasons. Significant (0.05) increases are identified for maximum
daily temperature at four of nine coastal stations and at all (nine) coastal stations for mean
average daily temperature during the 1983-2009 period. Significant (0.05) increases are
identified at a number (7 of 15) stations for maximum monthly temperature and at all (15)
stations for mean average monthly temperature during the period 1978-2009.
A significant increase in maximum seasonal temperature at coastal (inland) stations are
identified, with; autumn and spring 67% (67%), summer 45% (67%) and winter 22% (0%),
illustrating the stronger trend at inland stations to higher maximum temperatures (1945-2009).
Significant increases in mean average seasonal temperature at all coastal (inland) stations are
identified, with; autumn 100% (100%), summer 78% (67%), spring 89% (67%) and in winter
78% (50%), illustrating the stronger trend at inland stations to higher mean average
temperatures in autumn and summer season (1945-2009).
The trends analysis (1945-2009) shows significant increases in mean average (0.021 °C/year)
and maximum temperature (0.017 °C/year). The rates identified within this study are higher
than the global average mean average temperature increases identified by the IPCC and support
those previously reported for Mediterranean based studies (e.g. Kutiel & Maheras, 1998;
Hasanean, 2001; Feidas et al., 2004). It also raises an important point of reference for
timeframes considered, with differences in trend between the two periods studied.
The comprehensive analysis of a long-term temperature data from 18 synoptic stations across
Libya has revealed broad increases in maximum and mean average temperature, though the
spatial and temporal rates of change vary. This study has identified significant increases at all
locations, with particularly rapid increases in temperature during the last 32 years (1978-2009)
at the majority of stations. This research represents an important contribution to current work
examining climate variability and change, reflecting an area with limited existing research,
where the implications of increasing temperature will be extensive, particularly on human
health, rates of desertification, ecosystems, agricultural practice and productivity. The results of
this work will help inform decision makers for future environmental management decisions in
Libya.
Acknowledgements
This research was funded by the Libyan government as a part of a PhD thesis undertaken at the
University of Liverpool. The authors are grateful to the Libyan National Meteorological Centre
(LNMC) for providing them with the Libyan meteorological station data.
References
Aesawy AM, Hasanean HM, (1998) Annual and seasonal climatic analysis of surface air
temperature variations at six southern Mediterranean stations, Theo. & App. Climatol.
61:55-68
Ageena I, Macdonald N, Morse AP, (2012) Variability of minimum temperature across Libya
(1945-2009), Int. J. of Climatol. 33:641-653
Alexander LV, Zhang X, Peterson T.C, Caesar J, Gleason B, Klein Tank AMG, Haylock MD,
Collins B, Trewin F, Rahimzadeh A, Tagipour P, Ambenje K, Revadekar G, (2006)
Global observed changes in daily climate extremes of temperature and precipitation. J.
Geophys. Res. Atm. 111:1-22
Al-Haram F, (1995) Topography and Geomorphology, In: Geography of Libya (ID) Al-Hadi
Abo-Lohmah. Al-Dar Al-Jamahiriya LL-Nashir 101-120
Brunet M , Jones PD, Sigro J , Saladie O, Aguilar E , Moberg A, Della-Marta PM, Lister A,
Walther D, Lopez D, (2007) Spatial and temporal temperature variability and change
over Spain during 1850-2003, J. of Geophys. Res. 112:D12117
Campra P, Garcia M, Canton Y, Orueta AP, (2008) Surface temperature cooling trends and
negative radiative forcing due to land use change toward greenhouse farming in south
eastern Spain. J. of Geophys. Res. 113:D18109
Domonkos P Tar K, (2002) Long-term changes in observed temperature and precipitation
series 1901-1998 from Hungary and their relations to larger scale changes, Theo. & App.
Climatol. 75:131-147
Emgailee E, (2005) Climate of Libya, In: Geography of Libya (ID) Al-Hadi Abo-Lohmah.
Al-Dar Al-Jamahiriya LL-Nashir 101-120
El Kenawy A, Lopez-Moreno J, Vicente-Serrano S, Mekled M, (2009) Temperature trends in
Libya over the second half of the 20th century. Theo. & App. Climatol. 98:1-8
El-Tantawi M, (2005) Climate Change in Libya and Desertification of Jfarah Plain, (PhD
Research), Johannes Gutenberg-University, Mainz, German
Feidas H, Makrogiannis T, Bora-Senta E, 2004, Trend analysis of air temperature time series in
Greece and their relationship with circulation using surface and satellite data: 1955-2001,
Theo. &App. Climatol. 79, 185-208
Hasanean H, 2001, Fluctuations of surface air temperature in the eastern Mediterranean, Theo.
& App. Climatol. 68:75-87.
Hasanean H, Abdel Basset H, (2006) Variability of summer temperature over Egypt
International J. of Climatol. 26:1619-1634
Hansen J, Sato M, Ruedy R, Lo K, Lea DW, Medina-Elizade M, (2006) Global temperature
change, Proceedings of the National Academy of Sciences of the United States of
America, 103: 14288-14293
IPCC (2007) Intergovernmental panel on climate change, Climate change 2007- Observation:
surface atmospheric climate change, contribution of working Group 1 to the fourth
assessment report of the intergovernmental panel on climate change. In: Adler R,
Alexander L, Alexanderson H, Allan R, Baldwin M, Beniston M, Bromwich D,
Camilloni I, Cassou C, Cayan D R, Chang E, Christy J, Dai A , Deser C, Dotzek N,
Fasullo J, Fogt R, Folland C, Forster P, Free M, Frei C, Gleason B, Grieser J, Groisman
P, Gulev S , Hurrell J, Ishii M, Josey S, Kållberg P, Kennedy J , Kiladis G, Kripalani R,
Kunkel K, Lam C Y, Lanzante J, Lawrimore J, Levinson D, Liepert B, Marshall G ,
Mears C, Mote P, Nakamura H, Nicholls H, Norris J, Rosenlof K, Semazzi F H, Shea D,
Shepherd J M, Shepherd T, Sherwood S, Sigmund P, Simmonds I, Simmons A ,
Thorncroft C, Thorne P, Uppala S, Vose R, Wang B, Warren S, Washington R, Wheeler
M, Wielicki B, Wong T, Wuertz D (eds), Cambridge University Press, New York.
Jones PD, New M, Parker DES, Martin S, Rigor IG, (1999) Surface air temperature and its
changes over the past 150 years: American Geophysical Union. 173–199
Juan J, Antonio P, (1996) Temperature variations in Spain since 1901: A preliminary analyses.
Int. J. of Climatol. 16:808-815
Kutiel H, Maheras P, 1998, Variations in the temperature regime across the Mediterranean
during the last century and their relationship with circulation indices, Theo. & App.
Climatol. 61:39–53.
Mitchell JM, Dzerdzeevskii B, Flohn H, Hofmery WL, (1966) Climatic change. WMO
Technical Note 79. WMO No. 195. TP-100. World Meteorological Organization
(WMO), Geneva, 79
Rebetez M, Reinhard M, (2008) Monthly air trends in Switzerland 1901-2000 and 1975-2004,
Theo. & App. Climatol. 91: 27-34.
Rose S (2007) Decadal rainfall and runoff trends in the southeastern United States,
Proceedings of the 2007 Georgia Water Resources Conference, April 27-29, 2007, at the
University of Georgia
Salmi T, Maatta A, Anttila P, Ruoho-Airola T, Amnell T, (2002) Detecting trends of annual
values of atmospheric pollutants by the Mann-Kendall test and Sen’s slope estimates -the
excel template application Makesens. Helsinki, ISBN 951-697-563-1.
Sneyers R, (1990) On the statistical analysis of series of observations. Technical Note, No. 143.
World Meteorological Organization (WMO): Geneva, 192.
Soltani S, Sabohi R, Yaghmaei L, (2012) Rainfall and rainy days trend in Iran, Clim. Chang.
110:187-213
Wibig J, Glowicki B, (2002) Trends of minimum and maximum temperature in Poland, Clim.
Res. 20:123-133
Xoplaki E, Gonzalez-Rouco FJ, Gyalistras D, Luterbacher J, Wanner H, (2003) Mediterranean
summer air temperature variability and its connection to the large- scale atmospheric
circulation and SSTs. Clim. Dyn. 20: 723–739.
Figure Captions
Figure 1: Libya and the distribution of meteorological stations.
Figure 2: a) Annual means 11 day moving averages of the mean maximum daily temperature; b) of the mean average daily temperature of the coastal stations across Libya 1956-2009.
Figure 3: Decadal mean of 11 day moving averages of the mean maximum daily temperature over near decadal windows for coastal stations for the period 1961-2009
Figure 4: Decadal mean of 11 day moving averages of the mean average daily temperature over near decadal windows for coastal stations for the period 1961-2009
Figure 5: Decadal mean monthly maximum temperature over near decadal windows for nine inland stations (1951-2009), with the curves from a separate decadal block.
Figure 6: Decadal mean average monthly temperature over near decadal windows for nine inland stations (1951-2009), with the curves from a separate decadal block.
Table 1: List of the meteorological stations assessed within the study.
Table 2: The mean annual maximum and mean average temperature and daily and monthly data available at 18 synoptic stations assessed within the study.
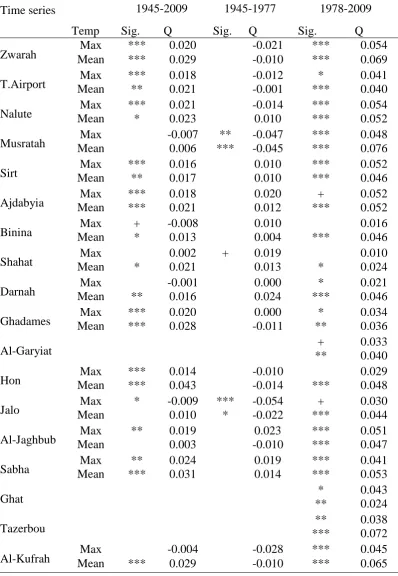
Table 3: Values of the Mann-Kendall statistic (Q) for monthly precipitation, with statistically significant levels at 15 synoptic stations
Table 4: Values of the Mann-Kendall statistic (Q) for seasonal precipitation, with statistically significant levels at 15 synoptic stations across Libya (1945-2010)
Table 5: Values of the Mann-Kendall statistic (Q) for annual precipitation, with statistically significant levels at 18 synoptic stations across Libya
Stations Latitude (o)
Longitude (o)
Elev. (m) a.m.s.l.
WMO No.
Distance from the sea (km) Zwarah 32º :53′ N 12 º :05′ E 3 062007 0.8
T. Airport 32 º :40′ N 13 º: 09′ E 81 062010 2.4
Nalute 31º: 52′ N 10 º:59′ E 621 062002 150
Musratah 32º : 19′ N 15 º: 03′ E 32 062016 4.1
Sirt 31º : 12′ N 16 º: 55′ E 13 062019 0.7
Ajdabyia 30 º: 43′ N 20 º: 10′ E 7 062053 8.5
Binina 32 º: 05′ N 20 º: 16′ E 129 062055 19
Shahat 32 º: 49′ N 21º: 51′ E 625 062056 0.5
Darnah 32 º: 47′ N 22 º:35 ′ E 26 062059 1.0
Ghadames 30 º: 09′ N 09 º:42′ E 357 062103 390
Al-Garyiat 30 º: 23′ N 13 º:35′ E 497 062120 150
Hon 29 º: 08′ N 15 º:57′ E 267 062131 240
Jalo 29 º: 02′ N 21 º:34′ E 60 062161 215
Al-Jaghbub 29 º: 45′ N 24 º:32′ E 2 062176 210
Sabha 32 º: 19′ N 12 º:05′ E 432 062124 500
Ghat 25 º: 08′ N 10 º:09′ E 692 062212 900
Tazerbou 25 º: 48′ N 21 º:08′ E 259 062259 700
[image:22.595.46.387.60.365.2]Time series
Maximum temperature (°C) Mean average temperature (°C)
Mean annual
Mean daily Mean monthly
Mean annual
Mean daily Mean monthly Period
Covered
Missing Data (%)
Period Covered
Missing Data (%)
Period Covered
Missing Data (%)
Period Covered
Missing Data (%)
Coastal
Zwarah 24.5 1956-2009 0.3 1945-2009 0.3 19.9 1956-2009 0.4 1945-2009 0.4
T. Airport 27 1956-2009 0.1 1945-2009 0 20.5 1956-2009 0.1 1945-2009 0
Nalute 24.5 1956-2009 1.5 1945-2009 0.1 19.1 1956-2009 1.6 1945-2009 0.2
Musratah 25.1 1956-2009 1.1 1945-2009 0 20.4 1957-2009 1.3 1945-2009 0
Sirt 25 1956-2009 1.2 1945-2009 0 20.5 1957-2009 1.3 1946-2009 0
Ajdabyia 26.8 1956-2009 0.2 1945-2009 0 20.7 1956-2009 0.5 1946-2009 0
Binina 25.2 1956-2009 0.9 1945-2009 0 19.9 1956-2009 1.1 1945-2009 0
Shahat 20.8 1956-2009 0.6 1945-2009 0 16.5 1956-2009 0.9 1945-2009 0
Darnah 23.4 1956-2009 1.4 1945-2009 0 20.3 1956-2009 1.5 1945-2009 0
Inland
Ghadames 29.7 1945-2008 1.1 21.9 1945-2008 1.2
Al-Garyiat 27.9 1968-2008 1.5 20.6 1968-2008 1.7
Hon 29.1 1948-2008 0.8 21.4 1948-2008 0.8
Jalo 29.6 1950-2009 1.3 22.5 1951-2009 1.5
Al-Jaghbub 29.4 1946-2008 1.0 20.9 1946-2008 1.1
Sabha 30.3 1948-2008 0.9 22.9 1948-2008 0.9
Ghat 31.8 1979-2007 0.2 24.1 1979-2007 0.3
Tazerbou 30.3 1962-2007 1.4 22.5 1963-2007 1.6
[image:23.595.51.505.69.409.2]Time series Temp JAN. FEB. MAR. APR. MAY JUN. JUL. AUG. SEP. OCT. NOV. DEC.
Zwarah Max 0.025 + 0.000 0.003 0.025* 0.026+ 0.005 0.017 0.024* 0.025* 0.038** 0.026* 0.021 + Mean 0.038*** 0.026** 0.031*** 0.032*** 0.032*** 0.017** 0.032*** 0.042*** 0.042*** 0.052*** 0.036*** 0.035***
T. Airport Max 0.016 0.000 0.016 0.014 0.020 0.008 0.026* 0.014 0.020+ 0.046** 0.014 0.017 Mean 0.014 0.006 0.022* 0.021* 0.024* 0.006 0.029** 0.029** 0.025** 0.038** 0.019* 0.015+
Nalute Max 0.033* 0.0004 0.015 0.016 0.015 0.004 0.017 0.012 0.007 0.038* 0.022+ 0.019 Mean 0.038** 0.013 0.028* 0.024* 0.017 0.014 0.024* 0.026** 0.020* 0.050*** 0.026* 0.027*
Musratah Max -0.013 -0.021 * 0.007 0.011 0.003 -0.025 ** -0.015 -0.010 0.002 0.014 -0.008 0.000 Mean 0.007 0.002 0.013 0.006 0.004 -0.013+ -0.001 0.005 0.013+ 0.022* 0.011 0.013+
Sirt Max 0.005 -0.006 0.020+ 0.025 ** 0.018 0.007 0.019* 0.024** 0.038*** 0.026* 0.010 0.015 Mean 0.012+ 0.001 0.015+ 0.017** 0.015+ 0.008 0.020* 0.023*** 0.037*** 0.027** 0.014 0.012*
Ajdabyia Max 0.022* 0.000 0.019 0.021* 0.017 0.011 0.026*** 0.031*** 0.04*** 0.02 0.01 0.02 Mean 0.020** 0.008 0.018+ 0.016* 0.021* 0.017* 0.030*** 0.040*** 0.045*** 0.023* 0.016+ 0.016*
Binina Max 0.002 -0.021 * 0.000 -0.007 -0.011 -0.014 -0.006 -0.006 0.010 -0.006 -0.014 0.000 Mean 0.012+ 0.001 0.017 0.009 0.009 0.006 0.001+ 0.011+ 0.026*** 0.018+ 0.005 0.014*
Shahat Max 0.003 -0.024 * 0.007 0.007 0.006 0.003 0.014* 0.008 0.023 ** 0.016 -0.011 0.000 Mean 0.009+ -0.009 0.011 0.013 0.001 0.006 0.020** 0.014* 0.023** 0.020+ 0.003 0.000
Darnah Max 0.002 -0.021 * 0.003 0.002 0.000 0.002 0.003 0.001 0.017* 0.010 -0.010 0.000 Mean 0.009+ -0.001 0.008 0.011 0.021** 0.014* 0.014* 0.013* 0.020** 0.022** 0.001 0.012
Ghadames Max 0.018 0.003 0.018 0.025+ 0.031* 0.003 0.016 0.029** 0.022+ 0.041** 0.021 0.008 Mean 0.017 0.009 0.029* 0.022* 0.035** 0.008 0.032** 0.050*** 0.041** 0.041** 0.034* 0.021+
Hon Max 0.010 -0.007 0.025 0.026 ** 0.025* 0.004 0.020+ 0.033 *** 0.043 ** 0.036* 0.010 0.011 Mean 0.022 -0.012 0.017 0.031 0.028+ 0.003 0.085*** 0.070*** 0.089*** 0.100*** 0.076** 0.039+
Jalo Max -0.013 -0.025 -0.022 0.001 0.006 -0.006 0.009 0.013+ 0.032 * 0.000 -0.011 -0.014 Mean 0.022 -0.012 0.024* 0.019* 0.024 0.008 0.033** 0.046*** 0.078** 0.019** 0.074 0.037+
Al-Jaghbub Max 0.015 -0.001 0.009 0.011 0.008 0.008 0.020 0.016* 0.043* 0.013 *** 0.009 0.012 Mean 0.013+ 0.000 0.001 0.001 0.007 0.006 0.030*** 0.015+ 0.047*** 0.013 0.004 0.006
Sabha Max 0.006 -0.002 0.007 0.031 ** 0.019+ 0.015 0.025* 0.031 ** 0.043 ** 0.025+ 0.007 0.019 Mean 0.020 0.006 0.029* 0.035** 0.040** 0.017+ 0.034** 0.053*** 0.051** 0.041** 0.021 0.027+
Al-Kufrah Max -0.009 -0.038 -0.015 0.007 0.000 -0.014 0.009+ 0.003 0.023+ -0.009 -0.012 -0.007 Mean 0.019* 0.010 0.021+ 0.043*** 0.029* 0.022** 0.038*** 0.026** 0.046*** 0.021+ 0.028* 0.021*
[image:24.842.50.726.51.453.2]For significant trends (***), if trend at a = 0.001 level of significance (**), if trend at a = 0.01 level of significance (*), if trend at a = 0.05 level of significance and + if trend at a = 0.1 level of significance
Time series Temp
Autumn Winter Spring Summer
Sig Q Sig Q Sig Q Sig Q
Zwarah Max ** 0.028 * 0.017 ** 0.030 0.006
Mean *** 0.045 *** 0.036 *** 0.029 *** 0.031
T.Airport Max ** 0.027 0.011 ** 0.031 * 0.014
Mean *** 0.025 0.008 ** 0.021 *** 0.025
Nalute Max 0.007 -0.008 0.001 -0.005
Mean *** 0.031 ** 0.023 * 0.019 *** 0.027
Musratah Max ** 0.025 0.011 ** 0.027 ** 0.024
Mean + 0.014 + 0.009 0.006 -0.005
Sirt Max -0.001 + -0.013 -0.001 ** -0.023
Mean *** 0.028 + 0.008 ** 0.017 *** 0.018
Ajdabyia Max ** 0.023 0.001 ** 0.021 * 0.013
Mean *** 0.030 *** 0.015 *** 0.021 *** 0.027
Binina Max *** 0.025 * 0.013 *** 0.029 ** 0.021
Mean ** 0.017 * 0.010 * 0.013 0.007
Shahat Max -0.003 -0.006 -0.006 * -0.012
Mean ** 0.015 0.011 * 0.014 * 0.012
Darnah Max + 0.012 + -0.011 + 0.007 0.005
Mean *** 0.018 * 0.008 ** 0.016 ** 0.016
Ghadames Max ** 0.028 0.011 ** 0.031 ** 0.019
Mean *** 0.044 0.014 *** 0.028 *** 0.038
Hon Max *** 0.032 0.005 *** 0.026 * 0.016
Mean *** 0.047 *** 0.025 *** 0.043 *** 0.044
Jalo Max 0.005 + -0.013 0.011 0.008
Mean + 0.018 0.004 0.001 * 0.014
Al-Jaghbub Max *** 0.031 0.010 *** 0.003 *** 0.022
Mean *** 0.025 0.007 0.003 ** 0.019
Sabha Max *** 0.032 0.010 *** 0.031 *** 0.021
Mean *** 0.036 * 0.019 *** 0.031 *** 0.033
Al-Kufrah Max 0.005 -0.012 0.014 0.005
[image:25.595.49.510.66.530.2]Mean *** 0.033 * 0.017 *** 0.029 *** 0.031
Time series Temp
1945-2009 1945-1977 1978-2009
Sig. Q Sig. Q Sig. Q
Zwarah Mean Max *** *** 0.020 0.029 -0.021 -0.010 *** *** 0.054 0.069
T.Airport Mean Max *** ** 0.018 0.021 -0.012 -0.001 *** * 0.041 0.040
Nalute Mean Max *** * 0.021 0.023 -0.014 0.010 *** *** 0.054 0.052
Musratah Mean Max -0.007 0.006 *** ** -0.047 -0.045 *** *** 0.048 0.076
Sirt Mean Max *** ** 0.016 0.017 0.010 0.010 *** *** 0.052 0.046
Ajdabyia Mean Max *** *** 0.018 0.021 0.020 0.012 *** + 0.052 0.052
Binina Mean Max + * -0.008 0.013 0.010 0.004 *** 0.016 0.046
Shahat Mean Max * 0.002 0.021 + 0.019 0.013 * 0.010 0.024
Darnah Mean Max ** -0.001 0.016 0.000 0.024 *** * 0.021 0.046
Ghadames Mean Max *** *** 0.020 0.028 -0.011 0.000 ** * 0.034 0.036
Al-Garyiat ** + 0.033 0.040
Hon Mean Max *** *** 0.014 0.043 -0.010 -0.014 *** 0.029 0.048
Jalo Mean Max * -0.009 0.010 *** * -0.054 -0.022 *** + 0.030 0.044
Al-Jaghbub Mean Max ** 0.019 0.003 -0.010 0.023 *** *** 0.051 0.047
Sabha Mean Max *** ** 0.024 0.031 0.019 0.014 *** *** 0.041 0.053
Ghat ** * 0.043 0.024
Tazerbou *** ** 0.038 0.072
[image:26.595.50.449.61.638.2]Figure 1
Figure 2
Figure 3
Figure 4
Figure 5
Figure 6
Table; Reviewer Comments and our responses
No. Reviewer Comments Our Response
1 The trends differ considerably from period to period. It is not possible to analyse the spatial variability of trends calculated for different periods. It should be improved and the analysis should be made on common period or some stations should be excluded from some parts of analysis.
The removal of stations from the analysis, or restriction of the analysis to only the period including all data would limit the available datasets considerably, we have added a line into the discussion drawing the reader to the fact that all stations are used and that there are some different timeframes with the exception of three stations, which are removed from the analysis (Al-Garyiat and Ghat and Tazerbou), we have also clearly stated this in the methodology section (e.g. Table 1), but that the fact this study is using all available data for analysis is highlighted and provides considerable advancement in current understanding for this region of N. Africa is important. We also identify that the shorter series follow the trends of the longer series during comparable periods.
2 There are four objectives of the paper defined at the end of introduction. There is no discussion on any associations between temperature and altitude or distance from the sea (only the difference between coastal and inland stations).
Accept – a short paragraph has been inserted into the papers discussion clarifying this.
3 It is not clear why the decadal variations are analysed on the ground of daily data for coastal stations and monthly for inland stations. It makes both analysis and comparison more difficult. Figures 3-6 in the form of bar graphs (six bars for each month) could be more informative.
Accept – a short paragraph has been inserted into the papers method 2.3 (first paragraph) clarifying this. This has also been clarified throughout the paper.
4 The changes on the background of standard deviations would be more legible. We are unclear as to what the reviewer is asking in this point, as we do not present standard deviations on any figures and these are clearly labelled within the text using the convention of +,*,**,*** for different degrees of
significance.
5 The discussion of results is poor. We appreciate the reviewers comment and have improved this section Authors' Response to Reviewers' Comments
6 A language should be improved. Corrections have been made and improvements added were required.
7 Page 5 lines 25-30. The details of record length and resolution are not included in Table 1, they are in Table 2
Accept –this has been clarified by providing a link to Table 2 in this sentence.
8 Page 6 lines 53-60. The Ghat record is much shorter than the others. The data for Ghat are only for the second, warmer period. Because of this the Ghat means are higher than the other. When the range of mean average annual (not monthly as is in the text in line 53) temperature is considered the Ghat station is excluded, but when the range of average annual maximum is considered the Ghat station is taken into account (31.8°C). Why? Reference to table 2 should be made after the first sentence, when the annual values are presented. The monthly values are not presented in this table.
Accept – we appreciate the reviewers comment and the correction has been made to this paragraph. Whilst we believe the inclusion of shorter series are beneficial in some sections, we accept that comparison between periods may be compromised by the shorter series, as such we have removed the shorter series from some sections of the analysis, this is clearly articulated in these sections.
9 Page 7 lines 7-9, the coefficient of variation can be a valuable measure of degree of variation not a statistical test
Accepted, statistical test deleted
10 Page 7 lines 40 page 8 line 2 the differences both series are not well seen on fig. 2.
The series of differences should be added to figure 2 with additional scale on the right side. At the moment it is not clear that mean temperature in the second period is significantly higher, especially at Binina.
New graphs of maximum and mean average temperature with a line showing the of differences between values have been inserted (Fig.2)
11 Table 3, the description is not good. The unit of Sen's slope is not indicated. Is it per year or per decade, both units are used in the text.
The Mann-Kendall Q test is not shown at all, only some indication on
statistical significance, but it is not the same. It table description a period 1945-2009 is mentioned, but some stations have much shorter records.
It should be indicated, especially when it was mentioned that the trends in the first 27 year period are quite different than in the second one.
Accepted - all the table headings have been improved and now clearly state the table contents
Accepted - all the table headings have been improved and now clearly state the table contents
[image:34.842.60.663.64.527.2]12 Page 8 line 42, the range of trends from 0.002 to 0.15 (why different number of digits?) is mentioned, but the real range in the table is from 0.002 to 0.25 (Ghat). There is no station with trend equal 0.15. Trend 0.25°C/year and more than 60 years make a change of 15 degrees. Is it really happened?
At Al Garyiat the trend is 0.13°C/year. It is almost 8 degrees during 60 years. Both stations have much shorter records. Is it possible to compare trends?
The range in Table 3 is from 0.001 (May: Shahat and July: Binina) to 0.100 (October: Hon)
Accepted Tables 3,4 & 5 all now present 3 d.p.
Accepted; Ghat, Tazerbou and Al-Garyiat have been deleted from monthly and seasonal as well as long-term annual analyses
13 Page 9 lines 7-9. Two periods 1945-1977 and 1978-2009 are being compared in this section. The remark concerning what has happened since the mid 1980s is unfounded at this place.
Accepted the (Mean monthly maximum and mean average monthly temperature has increased at all stations since the mid-1980s). has been deleted, this was a remnant from an earlier draft with a figure that showed this which was subsequently removed.
14 Table 4, the description is not good. It is not clear what the Z test mean (is it a Mann Kendall test?); "sig" is not described, Q being mentioned after Mann -Kendall test, is probably the Sen's slope. "Clim" probably represents mean temperature, but it is mentioned at all.
Titles and contents of tables 3,4,5 have been changed, all Clim replaced by mean.
15 Page 9 lines 27-57, when ranges are described, the highest trends appeared in all seasons at Ghat, the station with much shorter record. You should not compare trends in different periods, especially if you presented in the previous paragraph that they are completely different. It is crazy.
Accepted, Ghat, Al-Garyiat and Tazerbou are excluded from long-term trend analysis monthly and seasonally
16 Table 5 - the same comments as for table 4. Additionally there is not allowed to show a long term trends in Ghat, when you have only data for a shorter period. The records for Al-Garyiat and Tazerbou are also shorter and they should be excluded from long-term trend analysis.
At Binina the positive trends appear in both shorter periods but the long-term one is negative. How is it possible? Is it an abrupt change at the beginning of second period?
Accepted – see previous comments. Accepted, Ghat, Al-Garyiat and Tazerbou are excluded from long-term trend analysis, seasonally and monthly, they are now only included in the analysis o the period 1978-2009, and are not included in any comparison to earlier periods.
17 Page 10 line 10-page 11 lines 4, the trends from different periods cannot be discussed together.
The three shorter series have now been removed from the analysis on Page 10 line 10 for Maximum temperature (increases are identified at 10 stations during the period 1945-2009)
Page 11 line 4 for Mean average temperature (significant increases (Table 5) at 14 of the 18 stations at a 0.001 and at Al-Garyiat, Ghadames (0.01) and Shahat (0.05). This includes the 18 stations.
The use of 15 or 18 stations is clarified throughout the text and no comparison is made between time periods without first removing the 3 shorter series (see line in Discussion section)
Page 11 lines 13-39 and figures 3 and 4. The conclusion that the last period was the warmest is not justified well. May be the numbers of figures 3 and 4 are changed, because for me it is clearer that the mean temperature is the highest in the last period during days 170-270 (fig 4) than for the maximum temperature (fig. 3).
Because of small size of graphs with limited number pages
18 Figures 5 and 6, May be differences between periods can be better seen on bar graphs
Page 11 line 47 - page 12 line 10. All increases mentioned in the text are not well seen on the pictures. Especially rapid increases from March to October (page 12 lines 7-8).
On figures 5 and 6 the increases in late summer and early autumn can be distinguished but not in spring.
19 Page 12 lines 12 - page 13 lines 13, the discussion is chaotic and imprecise.
The global trends are mixed with those obtained for Libya. The units change from sentence to sentence, so the understanding of text is made difficult.
The trends obtained on the ground of longer periods are mixed with those obtained on the ground of the shorter ones. What does it mean "decreasing strength in the Indian air mass"?
This section has been restructured to improve these issues, with more concise sentences.
Accepted, units have been standardised (C°/year)
Sentence reworded
20 Page 13 line 58, Significant increases are at all (nine) inland stations (not coastal as it is in the text).
The text is correct, both relate to coastal stations, the first max daily the second mean daily.
21 Page 14 lines 21-30. Comparison of trends calculated for different regions and periods. Previously described trends were both positive and negative, how the present study can support all of them?