Open Access
Short Report
A new measure of population structure using multiple single
nucleotide polymorphisms and its relationship with F
ST
Hongyan Xu*, Bayazid Sarkar and Varghese George
Address: Deparment of Biostatistics, Medical College of Georgia, Augusta, GA, USA
Email: Hongyan Xu* - [email protected]; Bayazid Sarkar - [email protected]; Varghese George - [email protected] * Corresponding author
Abstract
Background: Large-scale genome-wide association studies are promising for unraveling the genetic basis of complex diseases. Population structure is a potential problem, the effects of which on genetic association studies are controversial. The first step to systematically quantify the effects of population structure is to choose an appropriate measure of population structure for human data. The commonly used measure is Wright's FST. For a set of subpopulations it is generally
assumed to be one value of FST. However, the estimates could be different for distinct loci. Since population structure is a concept at the population level, a measure of population structure that utilized the information across loci would be desirable.
Findings: In this study we propose an adjusted C parameter according to the sample size from each sub-population. The new measure C is based on the c parameter proposed for SNP data, which was assumed to be subpopulation-specific and common for all loci. In this study, we performed extensive simulations of samples with varying levels of population structure to investigate the properties and relationships of both measures. It is found that the two measures generally agree well.
Conclusion: The new measure simultaneously uses the marker information across the genome. It has the advantage of easy interpretation as one measure of population structure and yet can also assess population differentiation.
Background
Large scale genome-wide association studies are promis-ing in unravelpromis-ing the genetic basis of complex diseases in humans. There are many such studies currently being car-ried out. However, the size of the data produces several issues and challenges in analysis and interpretation. One of the potential problems is hidden population structure in the samples. It can cause spurious associations when cases and controls differ in ancestry and is thus a con-founding factor. However, the effects of population
struc-controversial. Therefore, a systematic study is needed to quantify the levels of population structure and its effects on genetic association studies.
The first step to quantify the effects of population struc-ture is to choose an appropriate measure of population structure for human data. The commonly used measure is Wright's FST [1]. For a set of subpopulations it is generally assumed to be one value of FST. However, the estimates could be different for distinct loci. It could be a problem
Published: 6 February 2009
BMC Research Notes 2009, 2:21 doi:10.1186/1756-0500-2-21
Received: 31 December 2008 Accepted: 6 February 2009
This article is available from: http://www.biomedcentral.com/1756-0500/2/21
© 2009 Xu et al; licensee BioMed Central Ltd.
genome-wide association studies because it could mask real association and lead to loss of power. With the avail-able of genomic data, we would like a measure utilizing the information across markers. Therefore, we proposed a new measure C for SNP data. The new measure is same for all loci and utilizes information across loci. It is based on the c parameters for the subpopulation that measures the divergence of the subpopulation from the common ances-tor [2]. We then performed extensive simulations to inves-tigate the performance the new measure and compared it to the traditional FST statistic.
Methods
Simulation modelWe simulated samples with population structure using the Balding-Nichols model [2,3]. Specifically, let xij be the number of copies of the chosen SNP variant at locus i in population j, αij be the corresponding allele frequency at locus i in population j, then the model specifies that
where L is the number of loci, P is the number of popula-tions, nij is the number of chromosomes genotyped at the ith SNP in the jth population, πi is the ancestral allele fre-quency for the ith SNP and the variance parameter cj spec-ifies how far the jth subpopulation's allele frequencies tend to be away from the ancestral allele frequency. In our simulations, we sample cj and πi from a uniform distribu-tion on (0, 1). The simuladistribu-tions were performed using the simMD program in the Popgen package [4].
Estimating cj parameter
For each sample in the simulated data sets, we estimate the c parameter for each subpopulation using a Bayesian approach. We assume uniform priors on both c and π parameters and use Markov Chain Monte Carlo (MCMC) methods (a Gibbs sampler) to sample from the posterior distribution. The Markov Chain was run for 20,000 itera-tions and the first 10,000 iteraitera-tions were discarded as burn-in. We estimated the c parameter by using the poste-rior mean values from the posteposte-rior samples.
New measure
When summarizing the level of population structure across subpopulations, it is desirable to have a single sta-tistic, instead of one for each subpopulation. We propose to use the weighted mean of the c parameters as the new measure of population structure. Specifically, suppose we have P subpopulations, and let cj be the variance
parame-ter for the jth subpopulation as defined above, then the new measure C is defined as
where wj is the weight for the jth subpopulation. There are many possible weighting schemes. Here we propose to use sample size from each subpopulation as a weight.
That is, , where nj is the number of
indi-viduals from subpopulation j in our sample. In our imple-mentation, we used the posterior estimate of cj and took
the weighted mean as an estimate of C.
From the simulated samples, FST was estimated using the unbiased estimator at bi-allelic SNP described by [5].
Results
Equal sample size
In the first set of simulations, we sampled equal number of chromosomes from each of the 3 sub-populations. We generated genotypes of 100 SNPs according to our simu-lation model. The posterior estimates of the variance parameter cj were obtained using MCMC method. We then estimate C by taking simple average of the estimates of the cj parameters. FST was also estimated from the same simulated sample. A total of 100 samples were simulated. The correlation coefficient between the estimates of C and
x n i L j P
i c j c j
i
ij ij ij
ij ~ , , , , , ~ , Bin Beta a
a p p
(
)
= = −(
)
(
−)
1 1 1 1 … … 1 1−(
)
⎛ ⎝ ⎜ ⎜⎜ ⎞ ⎠ ⎟ ⎟⎟ c jc j ,
w n n j j i i P = =
∑
1Linear regression of FST on the estimates of the C parame-ters with sample size 60 from each of the 3 populations
Figure 1
Linear regression of FST on the estimates of the C
parameters with sample size 60 from each of the 3 populations.
0.0 0.2 0.4 0.6 0.8 1.0
0.05 0.10 0.15 0.20 0.25 0.30 0.35 0.40 0.45 0.50
FST = 0.522C+0.065 R2
=0.92, n=60 FST
FST was calculated from a linear regression of FST by C. Fig-ure 1 shows the regression of FST by C when the sample size is 60 in each of the 3 sub-populations. As seen in Fig-ure 1, the correlation between the estimates of FST and C is very high (R2 = 0.92). The standard error of the intercept is 0.06.
We then conducted further sets of simulations with vary-ing sample sizes for each set, but equal sample size from each sub-population within each set of simulations. Sim-ilar analysis was performed to estimate FST, C, and their correlations. Table 1 gives the correlation coefficient between the estimates of FST and C with varying sample size for several simulations. The number in the sample size column is the number of individuals simulated from each sub-population. Clearly, the correlation between FST and the new measure C increases as the sample size increases. The correlation is high at all the sample sizes we have tried. Even when the sample size is as small as 30 individuals from each sub-population, we still have R2 = 0.89.
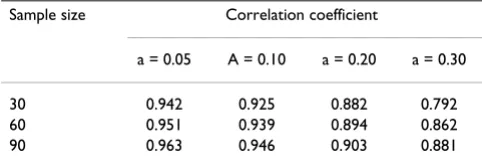
To investigate the correlation of C and FST when there are deviations of the Balding-Nichols model, we simulated samples with αij from a mixture of two Beta distributions, with probability (1-a) and a respectively from the two dis-tributions. Table 2 gives the result with a series of values of a. The correlation remains high with 20% mixture.
Unequal sample size
Next we simulated samples with unequal number of indi-viduals from each sub-population. We simulated two sce-narios. Specifically, in scenario 1, the number of individuals from the 3 populations are 30, 40, 90, respec-tively and 30, 60, 70, respecrespec-tively in scenario 2. The total sample sizes in the two scenarios are the same. For each scenario, we simulated 100 samples, each with informa-tion from 100 SNPs. Here because we have unequal sam-ple sizes, we compared 3 weighting schemes for the new measure C. In scheme 1, we estimated C by taking simple average of the cj parameters. In scheme 2, we calculated weighted average of cj using number of individuals from each sub-population as the weight. In scheme 3, we calcu-lated weighted average of cj using the square root of the number of individuals from each sub-population as the weight. Table 3 gives the correlation coefficients from the
regression. It can be seen from Table 3 that when sample size is unequal from each sub-population, the simple average in scheme 1 gives the lowest correlation between the estimates of FST and C, while the sample size weighted average in scheme 2 gives the highest correlation. The square root of sample size weighted average in scheme 3 gives a slightly lower correlation than weighting scheme 2. Based on these results, we proposed to use sample size from each sup-population as a weight to estimate the new measure C as detailed in the methods section.
Varying number of SNPs
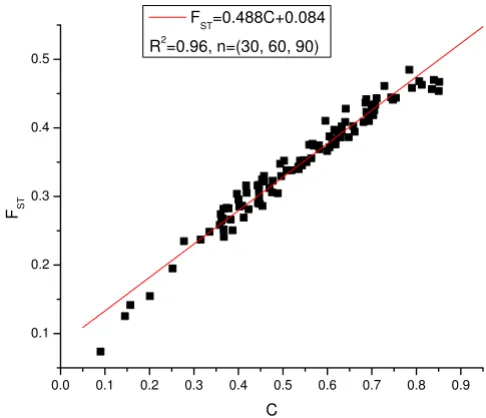
Next we consider the effects of the number of SNPs on the correlation between the estimates of FST and the new measure C. In the simulations of previous sections, we simulated samples with 100 SNPs. In this section, we increased the number of SNPs to 1000. We simulated 30, 60, 90 individuals from the three subpopulations respec-tively. A total of 100 samples were simulated. Figure 2 shows the regression of FST by C with 1000 SNPs. The R2 in this case reaches 0.96. Compared with the case of 100 SNPs and the same sample size configuration (30, 60, 70 from the 3 sub-populations) shown in Table 3, the corre-lation increases as the number of SNPs increases (R2 = 0.91 in the case of 100 SNPs).
Varying number of sub-populations
[image:3.612.313.554.113.197.2]In this section, we studied the effects of varying number of sub-populations on the correlations of the new measure C with FST. We performed further simulations in 3 scenarios with equal sample size from each subpopulation. In sce-nario 1, we simulated 2 sub-populations with 90 individ-uals from each sub-population. In scenario 2, 45 individuals were simulated from each of 4 sub-popula-tions. In scenario 3, 36 individuals were simulated from each of 5 sub-populations. Thus, in these simulations, we changed the number of sub-populations but keep the total sample size constant at 180. For each individual, genotypes at 100 SNPs were simulated. We simulated 100 samples. Table 4 gives the correlation coefficient in the 3 scenarios and the simulation with 60 individuals from each of the 3 sub-populations. It can be seen that the cor-relation increases with more sub-populations even
Table 1: Correlation coefficient of estimates of FST and C from simulations with varying sample sizes
Sample size Correlation coefficient
30 0.944
60 0.959
[image:3.612.53.295.667.729.2]90 0.973
Table 2: Correlation coefficient of estimates of FST and C from simulations with ij from a mixture distribution
Sample size Correlation coefficient
a = 0.05 A = 0.10 a = 0.20 a = 0.30
though the total sample size is constant. However, the cor-relation levels off with 3 or more sub-populations.
Discussion
Natural populations of the same species from different geographic regions tend to differ genetically. Human pop-ulation is no exception. Previous research has shown that ignoring the genetic differences among sub-populations is a potential problem for genetic association studies of human diseases, especially for genome-wide association studies [6]. The problem could be severe for large multi-centered studies and/or studies in admixed populations, such as African Americans.
The explosion of SNP data in human populations pro-vides an unprecedented opportunity to further character-ize population structure and relationships. In this paper, we proposed a new measure of population structure spe-cifically for SNPs. It is based on the c parameter which is population specific and measures the differentiation of
the population from the common ancestor population. In contrast, the new measure C is an index of the overall lev-els of population structure across populations. Through extensive simulations, we showed that the new measure C has very high correlations with the traditional Wright's FST. The correlation increases as we have more informa-tion (more SNPs and/or more sub-populainforma-tions in the samples).
While the new measure is different from the c parameter, it has some inherited advantages from the c parameters. First, it is specific for SNPs and takes account of the ascer-tainment bias in the process of SNP discovery. Since SNP discovery is generally conducted in small samples, SNPs with high minor allele frequencies are more likely to be discovered than SNPs with low minor allele frequencies, thus creating the possible ascertainment bias. It has been shown that the ascertainment bias could affect the estima-tion of populaestima-tion parameters in genetic analysis [7]. This ascertainment bias has been explicitly accounted for in the model for estimating the individual c parameter for each sub-population. It is assumed that a large number of potential loci are examined in small samples from each of the sub-populations, and a locus is chosen if it is not fixed for the same allele in all sub-populations.
Second, the new measure is based on inferences from a Bayesian framework. Therefore, it is very flexible in mod-eling and can incorporate prior information on the parameters. In our simulation studies, we used
unin-Table 3: Correlation of the estimates of FST and C from several weighing schemes
Weighting scheme Correlation coefficient
Sample size (30, 40, 90) Sample size (30, 60, 70)
Scheme 1 0.866 0.875
Scheme 2 0.940 0.947
Scheme 3 0.931 0.937
[image:4.612.50.559.100.210.2]Linear regression of FST on the estimates of the C parame-ters with 1000 SNPs
Figure 2
Linear regression of FST on the estimates of the C parameters with 1000 SNPs.
0.0 0.1 0.2 0.3 0.4 0.5 0.6 0.7 0.8 0.9 0.1
0.2 0.3 0.4 0.5
F
ST=0.488C+0.084 R2=0.96, n=(30, 60, 90)
FST
[image:4.612.52.295.472.681.2]C
Table 4: Correlation of the estimates of FST and C with varying
number of sub-populations
Sample size Correlation coefficient
(90, 90) 0.874
(60, 60, 60) 0.959
(45, 45, 45, 45) 0.965
[image:4.612.313.553.621.730.2]Publish with BioMed Central and every scientist can read your work free of charge "BioMed Central will be the most significant development for disseminating the results of biomedical researc h in our lifetime."
Sir Paul Nurse, Cancer Research UK
Your research papers will be:
available free of charge to the entire biomedical community
peer reviewed and published immediately upon acceptance
cited in PubMed and archived on PubMed Central
yours — you keep the copyright
Submit your manuscript here: BioMedcentral
formative prior distributions for the c and π parameters. If we have any prior knowledge regarding the distribution, we could easily incorporate it in the estimations, which can lead to more accurate estimates than the moment-based estimates of FST [2].
In summary, we proposed a new measure of population structure based on a Bayesian hierarchical model for SNPs. It uses the information at multiple markers and has high correlations with the traditional measure FST. We rec-ommend reporting the new measure along with the indi-vidual c parameters for sub-populations so that we could get an idea of the level of population structure and the divergence of each sub-population as well.
Competing interests
The authors declare that they have no competing interests.
Authors' contributions
HX conceived of the study, performed the analysis and drafted the manuscript. BS participated in the analysis and helped to draft the manuscript. VG participated in the design and coordination of the study. All authors read and approved the final manuscript.
Acknowledgements
We thank the two anonymous reviewers for their constructive comments. This work is supported by R21NS057506 from US National Institute of Health and Scientist Training Grant from Medical College of Georgia to HX.
References
1. Wright S: Isolation by Distance. Genetics 1943, 28:114-138. 2. Nicholson G, Smith AV, Jónsson F, Gústafsson Ó, Stefánsson K,
Don-nelly P: Assessing population differentiation and isolation from single-nucleotide polymorphism data. J R Stat Soc Ser B Stat Methodol 2002, 64(4):695-715.
3. Balding DJ, Nichols RA: A method for quantifying differentia-tion between populadifferentia-tions at multi-allelic loci and its implica-tions for investigating identity and paternity. Genetica 1995,
96(1–2):3-12.
4. Marchini's Hompage [http://www.stats.ox.ac.uk/~marchini/soft ware.html]
5. Weir BS, Cockerham CC: Estimating F-statistics for the analy-sis of population structure. Evolution 1984, 38:1358-1370. 6. Xu H, Shete S: Effects of population structure on genetic
asso-ciation studies. BMC Genet 2005, 6(suppl 1):S109.
7. Wakeley J, Nielsen R, Liu-Cordero SN, Ardlie K: The discovery of single-nucleotide polymorphisms – and inferences about human demographic history. Am J Hum Genet 2001,