R E S E A R C H A R T I C L E
Open Access
Implementing integrated services in routine
behavioral health care: primary outcomes
from a cluster randomized controlled trial
Mehret T. Assefa
1, James H. Ford II
2, Eric Osborne
3, Amy McIlvaine
2, Ahney King
3, Kevin Campbell
4, Booil Jo
5and
Mark P. McGovern
1*Abstract
Background:An estimated 8.2 million adults in the United States live with co-occurring mental health and substance use disorders. Although the benefits of integrated treatment services for persons with co-occurring disorders has been well-established, gaps in access to integrated care persist. Implementation research can address this gap. We evaluated if the Network for the Improvement of Addiction Treatment (NIATx) implementation strategy was effective in increasing integrated services capacity among organizations treating persons with co-occurring disorders.
Methods:This study employed a cluster randomized waitlist control group design. Forty-nine addiction treatment organizations from the State of Washington were randomized into one of two study arms: (1) NIATx strategy (active implementation strategy), or (2) waitlist (control). The primary outcome was a standardized organizational measure of integrated service capability: the Dual Diagnosis in Addiction Treatment (DDCAT) Index. Intent-to-treat analyses and per-protocol analyses were conducted to address the following questions: (1) Is NIATx effective in increasing integrated service capacity? and (2) Are there differences in organizations that actually use NIATx per-protocol versus those that do not?
Results:From baseline to one-year post active implementation, both the NIATx strategy and waitlist arms demonstrated improvements over time in DDCAT Index total and DDCAT dimension scores. In intent-to-treat analyses, a moderate but statistically significant difference in improvement between study arms was seen only in theProgram Milieudimension (p= 0.020, Cohen’s d = 0.54). In per-protocol analyses, moderate-to-large effects in
Program Milieu(p= 0.002, Cohen’s d = 0.91) andContinuity of Care(p= 0.026, Cohen’s d = 0.63) dimensions, and in total DDCAT Index (p= 0.046, Cohen’s d = 0.51) were found.
Conclusions:Overall, organizations in both study arms improved DDCAT Index scores over time. Organizations in the NIATx strategy arm with full adherence to the NIATx protocol had significantly greater improvements in the primary outcome measure of integrated service capacity for persons with co-occurring disorders.
Trail registration:ClinicalTrials.gov,NCT03007940. Retrospectively registered January 2017
Keywords:Implementation research, Co-occurring disorders, Integrated treatment
© The Author(s). 2019Open Access This article is distributed under the terms of the Creative Commons Attribution 4.0 International License (http://creativecommons.org/licenses/by/4.0/), which permits unrestricted use, distribution, and reproduction in any medium, provided you give appropriate credit to the original author(s) and the source, provide a link to the Creative Commons license, and indicate if changes were made. The Creative Commons Public Domain Dedication waiver (http://creativecommons.org/publicdomain/zero/1.0/) applies to the data made available in this article, unless otherwise stated. * Correspondence:[email protected]
1
Center for Behavioral Health Services and Implementation Research, Division of Public Health & Population Sciences, Department of Psychiatry and Behavioral Sciences, Stanford University School of Medicine, Palo Alto, CA 94304, USA
Background
An estimated 8.2 million adults in the United States live with co-occurring mental health and substance use
disorders [1]. The strong association between
sub-stance use disorders and other psychiatric disorders is
well-documented [2–5]. Research evidence supports
the effectiveness of integrated treatment: both sub-stance use and mental health disorders are treated at the same time, during the same treatment episode, and
by the same providers [6–11]. The benefits of
inte-grated treatment include, improved health outcomes for patients [12]; higher patient satisfaction levels com-pared to standard treatment [13]; substantial reduction in utilization and costs of acute care services such as
emergency room visits and hospital stays [14]; and
cost-effectiveness [15].
Longstanding efforts to improve access to integrated treatment services have been made. However, barriers to delivery of integrated care still persist. The current state of access to adequate treatment for co-occurring disor-ders remains profoundly limited, and the percentage of specialty addiction programs and mental health pro-grams offering integrated services remain low and highly variable [1,10,16–20].
Implementation science may serve to address this gap in treatment access [21].A relatively new discipline, the goal of implementation research is to identify processes and fac-tors related to successful implementation and sustainment of evidence-based practices, programs and policies [22]. Given the lack of treatment availability for co-occurring disorders, a clear need exists to employ implementation research to understand how to scale-up evidence-based integrated treatment effectively [20,23,24].
Several studies have demonstrated the effectiveness of the Network for the Improvement of Addiction Treatment (NIATx) for simple practice change in behavioral health set-tings [25–30]. The NIATx model is a multi-faceted imple-mentation strategy, which combines process improvement with principles from industrial engineering. The process im-provement tools and techniques include Plan-Do-Study-Act (PDSA) rapid change cycles and consumer-centered walk-through, and quality improvement interventions include learning sessions, coaching, and interest circle calls [31–33]. However, NIATx has not been evaluated in terms of fidelity or adherence--the extent of key activity com-pletion--or been connected with a range of implemen-tation outcomes. This is the first study to evaluate a well-documented implementation strategy, in this case NIATx, to install and hopefully sustain integrated treatment services for individuals with co-occurring disorders.
The study described aims to address the following research questions: (1) Is NIATx effective in improving integrated services? and (2) Are there differences in
organizations that actually use NIATx per-protocol versus those that do not?
Herein, we report primary outcome results from a cluster randomized controlled trial to evaluate the ef-fectiveness of NIATx in implementing integrated ser-vices for persons with co-occurring substance use and mental health disorders. The primary outcome meas-ure is the Dual Diagnosis in Addiction Treatment (DDCAT) Index, a widely used instrument to evaluate integrated services capacity at the organizational level. The DDCAT has established psychometric properties, includes an overall total score and subscale scores on seven dimensions that assess policy, clinical practices and workforce domains. It is a comprehensive and ob-jective measure with an established track record of guiding addiction treatment services organizations and systems. In this study, the specific objectives included examination of the primary outcome, DDCAT Index, by conducting: (1) Intent-to-treat analyses by study arm; and (2) Per-protocol analyses by level of NIATx participation. We hypothesized that organizations in the active NIATx study arm would demonstrate greater gains in integrated service capacity, as mea-sured by the DDCAT, compared to the waitlist group.
Methods
Design and setting
The study employed a cluster randomized waitlist con-trol group design to evaluate the effectiveness of NIATx in implementing integrated services for persons with co-occurring substance use and mental health disorders. This multi-faceted implementation strategy was used to install and sustain integrated treatment services for programs within community addiction treatment organizations. Agencies were randomized at baseline into either the NIATx strategy or waitlist study arm. NIATx strategies were initiated in the first 12 months for agencies in the NIATx strategy arm, while agencies in the control arm were waitlisted. At the end of year 1, the NIATx strategy group transi-tioned into the sustainment phase, while the waitlist group began utilizing NIATx strategies. More informa-tion on study methods is available in the protocol paper [34].
Participants
necessary standardized patient-level data. State repre-sentatives sent a recruitment letter to all eligible orga-nizations, which included 468 state-licensed addiction treatment providers. In response to this letter, 53 (11.3%) agencies were recruited or volunteered to par-ticipate in the study. Four of these agencies declined to continue study participation prior to randomization. The remaining 49 agencies were assigned at baseline to either the NIATx strategy (n = 25) or waitlist (n = 24) study arms.
Primary outcome measure DDCAT index
The DDCAT Index (Version 4.0) is a quantitative measure of addiction treatment programs capacity for integrated services for persons with co-occurring
sub-stance use and mental health disorders [35]. This
organizational measure consists of 35 benchmark items
across seven dimensions: (1) Program Structure; (2)
Program Milieu; (3) Clinical Process: Assessment; (4)
Clinical Process: Treatment; (5)Continuity of Care; (6)
Staffing; and (7) Training. Each item is rated on a Likert scale ranging from 1 to 5 with scoring anchors
of 1 (Addiction Only Services–AOS), 3 (Dual
Diagno-sis Capable – DDC), and 5 (Dual Diagnosis Enhanced
– DDE); an intermediate score of 2 or 4 is given to
items that fall between these anchor scores. All items are scored based on data collected by independent evaluators during onsite visits. DDCAT Index dimen-sion and overall scores are derived by calculating the mean of items within a dimension and mean of dimen-sions, respectively. Using the standard of 80%, addiction treatment programs are categorized as: (1) AOS if less than 80% of scores are rated a 3 or higher; (2) DDC if at least 80% of scores are at a 3 or higher; and (3) DDE if at least 80% of scores are at a 5. Psychometric studies have supported the reliability and validity of the DDCAT Index measure [16,19,35–37]. The DDCAT Index Toolkit (Ver-sion 4.0) [38] is available athttps://www.centerforebp.case. edu/resouces/tools/ddcat-toolkit. The current version of the DDCAT Index measure (Version 4.1) is public domain and available upon request.
To illustrate the characteristics of programs that are categorized as AOS, DDC or DDE, the following brief examples are provided. AOS programs typically either do not screen or treat psychiatric disorders either inde-pendent or co-morbid with substance use disorders. The entire focus of the organization’s policy, treatment and workforce is to address substance-related issues only. In fact, AOS programs may exclude patients with known psychiatric disorders from admission. Whereas, DDC programs do provide integrated services for co-occurring psychiatric disorders, but generally only admit patients with a mild to moderate or stable
psychiatric condition such as depression or anxiety. Fi-nally, DDE programs typically can provide integrated services to patients with more severe and potentially more acute psychiatric conditions, ranging from depression and anxiety to bipolar and psychotic spectrum diagnoses. DDE programs integrate addiction and mental health services across policy, practice and workforce domains.
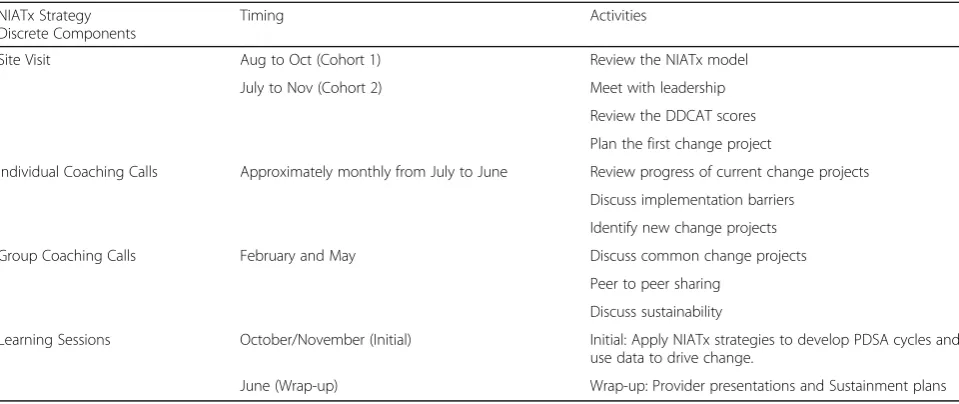
Implementation strategy–NIATx
The NIATx implementation strategy included a coach led site visit, individual coaching calls, group coaching calls and learning sessions (Table 1). For a typical pro-gram, the coach made contact approximately two weeks after the DDCAT visit and followed that call up with a site visit planning call two weeks later. Typically, the site visit occurred a month after the site visit planning call but the actual timing was dependent on program staff member availability. The first cohort-wide learning ses-sion occurred in October/November which was after the site visit for all but three programs. After the site visit, individual coach calls occurred approximately every 40 days but the actual number of calls varied by program. Two group coaching calls occurred in February and May. The NIATx intervention concluded at the end of June after the wrap-up learning session.
Procedures Data collection
Evaluators
Independent and trained evaluators were from the Washington State Department of Social and Health Services within the Division of Behavioral Health and Recovery (DBHR). A pair of evaluators conducted each site visit independently and one-year post active imple-mentation assessments were completed within a
two-month window. All evaluators (n = 10) received the
same one-day training at the start of the study as well as annual refresher trainings. Trainings incorporated didactic, observational, and experiential approaches, where evaluators observed a site visit and were evalu-ated conducting a site visit.
Ethics
Institutional Review Boards at Stanford University School of Medicine, the University of Wisconsin-Madison, and the State of Washington Department of Social and Health Services reviewed and deemed the study exempt.
Data analysis
First, we conducted descriptive statistics of baseline characteristics of participating programs.
Next, standard linear mixed effects modeling [39, 40] was employed to estimate changes in DDCAT Index scores from baseline to one-year post active implemen-tation. Following the intent-to-treat principle, all ran-domized organizations were included in analyses as long as data from at least one of the two assessments/time periods were available. Therefore, a total of 49 organiza-tions in NIATx strategy (n = 25) and waitlist (n = 24) study arms were included in the longitudinal modeling of the primary outcome, DDCAT Index. Maximum likelihood embedded in the Mplus program Version 8 [41] was used for all model estimations. Specifically, we
employed a random intercept model assuming linear change over time.
[image:4.595.58.538.98.300.2]Initial comparisons included assessment of the esti-mated trajectories across study arms as randomized (intent-to-treat). In subsequent secondary per-protocol analyses, we compared the two study arms after ex-cluding organizations that were assigned to the NIATx strategy study arm but did not meet the criteria for full participation in NIATx strategies. NIATx participation was determined based on careful consideration of three main components of the Stages of Implementation Completion (SIC), which included: (1) Proportion of completed NIATx activities (e.g., coach calls, webinars, and in-person attendance); (2) Duration of NIATx ac-tivities; and (3) Total time from initial to last NIATx activity. Based on these factors, per protocol was de-fined as organizations in the NIATx strategy group with full adherence (i.e., values above or equal to the average across all three categories) versus organiza-tions in the waitlist group. For full adherence, an agency would complete all NIATx related activities. Since duration of activities and total time are related to the activities completed, full adherence, as measured by duration or total time, is not a construct that can be determined. A univariate GLM examined differences in the three SIC variables based on level of adherence. Given that per-protocol comparisons do not compare groups as randomized, a causal approach known as complier average causal effect (CACE) [42–45] estima-tion was also employed as a way of sensitivity analysis. In addition, NIATx adherence was examined by the magnitude of DDCAT Index total change scores from baseline to one-year post active implementation. DDCAT Index change categories were defined as: (1) Large positive change (score≥1.5); (2) Moderate positive change (1.5 > Table 1NIATx Multi-component Implementation Strategy: Components, Timing and Activities
NIATx Strategy Discrete Components
Timing Activities
Site Visit Aug to Oct (Cohort 1) Review the NIATx model
July to Nov (Cohort 2) Meet with leadership
Review the DDCAT scores
Plan the first change project
Individual Coaching Calls Approximately monthly from July to June Review progress of current change projects
Discuss implementation barriers
Identify new change projects
Group Coaching Calls February and May Discuss common change projects
Peer to peer sharing
Discuss sustainability
Learning Sessions October/November (Initial) Initial: Apply NIATx strategies to develop PDSA cycles and use data to drive change.
score≥0.5); (3) Small positive change (0.0≤score < 0.5); and (4) Negative change (score < 0.0).
Results
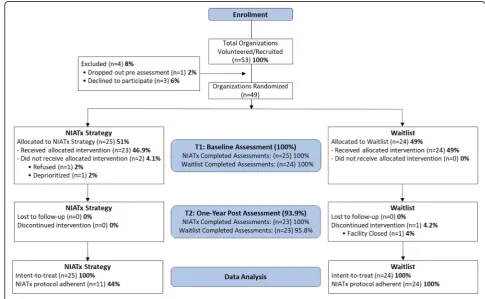
CONSORT extension for cluster designs
In 2016, a total of 53 community addiction treatment organizations volunteered or were recruited into the study (Fig.1). Of those, 49 organizations were random-ized to either NIATx strategy (n= 25) or waitlist (n= 24). At the end of the one-year post active implemen-tation strategy, 23 organizations in each study arm remained. Reasons for dropping out included: depriori-tized (n= 1), refused ((n= 1), and facility closed ((n= 1). Follow-up DDCAT assessments were conducted one-year post-baseline, i.e. 2017.
Baseline characteristics of participating organizations Overall, the majority of organizations were publicly funded and provided outpatient/intensive outpatient (IOP) care. The addiction treatment agencies were lo-cated across the State of Washington in 21 of the 39 counties, located predominantly in cities with medium sized populations (i.e., 26,000 – 249,000). Across the state, of the ten regional behavioral health networks providing funding and treatment services oversite to behavioral health agencies, nine were represented in this study.
Across both study arms, most agencies (55.1%) oper-ated within a medically underserved area. Healthcare shortages in primary care and behavioral health were also identified by participating organizations (71.4 and 75.5%, respectively), with no significant difference by study arm.
Primary outcome: DDCAT index
Outcomes were analyzed in two ways, with and without consideration of NIATx adherence. Based on the study definition of full NIATx adherence, 13 out of 25 agen-cies (54%) assigned to NIATx strategy did not show ad-equate participation (per-protocol) with the intervention.
Intent-to-treat comparison of changes in DDCAT index
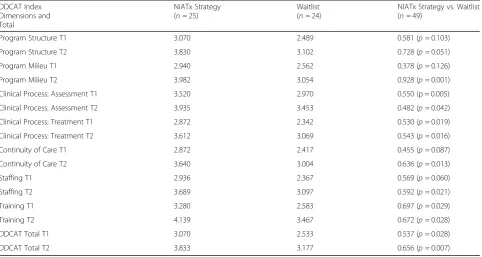
Intent-to-treat (ITT) analyses were conducted by in-cluding all randomized agencies in NIATx strategy (n= 25) and waitlist (n= 24), regardless of their adher-ence status. Results from longitudinal mixed effects modeling in line with the ITT principle are summa-rized in Tables2and3. In Table3, Cohen’s d is calcu-lated based on observed standard deviation pooled across the NIATx strategy and waitlist study arms at one-year post active implementation. At baseline, organi-zations in the active NIATx condition arm had higher DDCAT Index total and dimension scores compared to waitlist. Both study arms showed improvements over time
[image:5.595.52.538.419.718.2]in the DDCAT Index total and in all of the seven dimen-sions scores. However, the two study arms were generally not significantly different in their rate of change, except in theProgram Milieudimension, in which organizations in the NIATx strategy arm showed significantly greater
im-provement in Program Milieu compared to the waitlist
(p= 0.020).
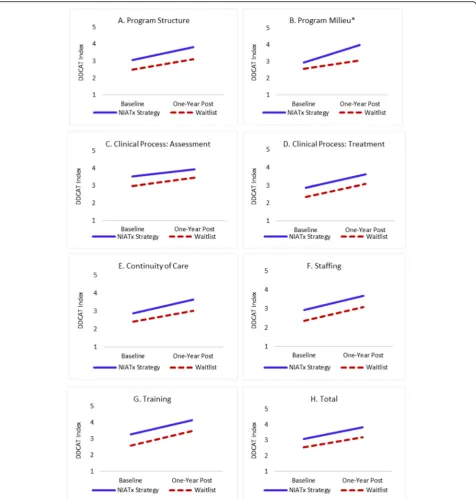
Figure 2a–h present estimated trajectories of
DDCAT Index total and dimension scores based on
ITT analyses (graphic depiction of Table 3 data). The
two study arms improved similarly in the DDCAT
Index total and most dimension scores. In theProgram
Milieu dimension, moderate difference in terms of im-provement were found among the two groups. Overall,
the effect of NIATx was less evident in ITT compari-sons versus the per-protocol analyses presented below. Just less than half (47.8%) of organizations assigned to NIATx were categorized as protocol adherent
Per-protocol comparison of changes in DDCAT index accounting for NIATx adherence
NIATx participation varied between organizations
[image:6.595.58.541.99.356.2]within the NIATx strategy study arm (see Table 4). Of the 23 organizations that completed NIATx strategy, a total of 11 (47.8%) had full NIATx adherence. The remaining organizations had partial or no adherence to NIATx, both 26.1% respectively. Fully NIATx adherent agencies were more likely to complete NIATx activities Table 2Estimated DDCAT means at baseline (T1) and post (T2) based on mixed effects modeling
DDCAT Index Dimensions and Total
NIATx Strategy (n= 25)
Waitlist (n= 24)
NIATx Strategy vs. Waitlist (n= 49)
Program Structure T1 3.070 2.489 0.581 (p= 0.103)
Program Structure T2 3.830 3.102 0.728 (p= 0.051)
Program Milieu T1 2.940 2.562 0.378 (p= 0.126)
Program Milieu T2 3.982 3.054 0.928 (p= 0.001)
Clinical Process: Assessment T1 3.520 2.970 0.550 (p = 0.005)
Clinical Process: Assessment T2 3.935 3.453 0.482 (p= 0.042)
Clinical Process: Treatment T1 2.872 2.342 0.530 (p= 0.019)
Clinical Process: Treatment T2 3.612 3.069 0.543 (p= 0.016)
Continuity of Care T1 2.872 2.417 0.455 (p= 0.087)
Continuity of Care T2 3.640 3.004 0.636 (p= 0.013)
Staffing T1 2.936 2.367 0.569 (p= 0.060)
Staffing T2 3.689 3.097 0.592 (p= 0.021)
Training T1 3.280 2.583 0.697 (p= 0.029)
Training T2 4.139 3.467 0.672 (p= 0.028)
DDCAT Total T1 3.070 2.533 0.537 (p= 0.028)
[image:6.595.58.540.580.715.2]DDCAT Total T2 3.833 3.177 0.656 (p= 0.007)
Table 3Intent-to-treat DDCAT Index change scores by dimension and total (baseline to one-year post) based on mixed effects modeling ((n= 49)
DDCAT Index Total and Dimensions NIATx Strategy ((n= 25)
Waitlist ((n= 24)
NIATx Strategy vs. Waitlist ((n= 49)
Program Structure 0.760*** 0.613*** 0.147 (d = 0.11)ƚ
Program Milieu 1.042*** 0.491*** 0.551 (d = 0.54)*
Clinical Process: Assessment 0.415** 0.483*** −0.068 (d = 0.08)
Clinical Process: Treatment 0.740*** 0.727*** 0.012 (d = 0.01)
Continuity of Care 0.768*** 0.588*** 0.180 (d = 0.20)
Staffing 0.753*** 0.730*** 0.023 (d = 0.02)
Training 0.859*** 0.884*** −0.025 (d = 0.02)
Total 0.763*** 0.644*** 0.119 (d = 0.14)
*p≤0.05, **p≤0.01, ***p≤0.001
(85%) versus agencies with no NIATx adherence (41%)(Table 5). Similar significant differences were found for the duration of activities completed (296 versus 128 days) and the total time (291 versus 125 days) between fully adherent and non-adherent NIATx agencies. Partially adherent agencies had a higher proportion of completed activities and a longer duration than non-adherent
agen-cies. Figure 3 depicts NIATx strategy adherence among
organizations by magnitude of DDCAT Index total change score. Organizations with large positive (i.e., score≥1.5) and moderate positive (i.e., 1.5 > score≥ 0.5) DDCAT Index change scores had more organiza-tions with full adherence than those with small positive (i.e., 0.0≤score < 0.5) or negative (i.e., score < 0.0) change scores. Although two of the six organizations with no NIATx adherence had moderate to large
[image:7.595.61.538.87.588.2]change scores, the majority of non-adherent organiza-tions had either small or negative changes.
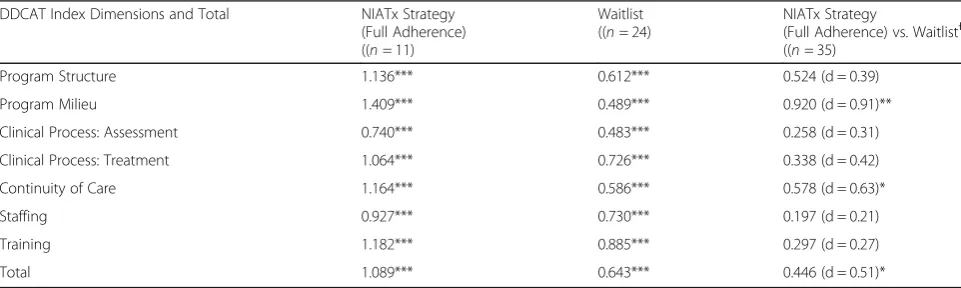
Per-protocol analyses where NIATx strategy organiza-tions showing insufficient adherence were excluded from mixed effects analyses are presented in Table 5. In per-protocol analyses, the difference in improvement for DDCAT Index total scores between the two study arms becomes statistically significant (p= 0.046), with a clinic-ally meaningful effect size (Cohen’s d = 0.51). Among the
seven DDCAT Index dimensions, Program Milieu
showed the largest effect (p = 0.002, Cohen’s d = 0.91) and Continuity of Careshowed the second largest effect (p= 0.026, Cohen’s d = 0.63).
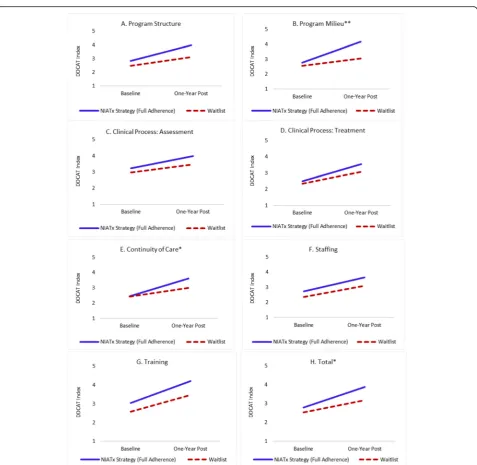
Figure4a–h present estimated trajectories of DDCAT Index total and dimension scores based on per-protocol
analyses. The comparison between Figs. 2 and 4
illus-trates how group differences varied noticeably depending on whether inadequate adherence among organizations in the NIATx strategy group were included or excluded. In per-protocol analyses, the NIATx strategy group improved considerably more than the waitlist group. The two groups show a remarkably large difference in
improvement in the Program Milieu dimension.
Sensi-tivity analysis using a causal approach known as
com-plier average causal effect (CACE) [42–44] revealed
[image:8.595.64.539.99.224.2]similar results, supporting the validity of the findings based on per-protocol comparisons. There were no sta-tistically significant differences between NIATx adherent and non-adherent programs on baseline characteristics including DDCAT total or dimension scores.
Table 4NIATx protocol adherence among organizations (n= 24)
NIATx Adherenceƚ Full adherence to NIATx Partial adherence to NIATx No adherence to NIATx
NIATx Strategy n (%) 11 (45.8) 7 (29.2) 6 (25.0)
Proportion of Completed ActivitiesA 85.1% 79.5% 41.4%
Duration of Activities (Days)B 295.7 211.1 128.3
Total Time (Days)C 290.6 229.0 124.8
Prior NIATx Experience n (%) 3 (27%) 1 (14%) 1 (17%)
Change Projects Implemented mean (sd)D 2.55 (0.93) 1.71 (1.25) 0.83 (0.41)
Number of Coaching Calls mean (sd)E 7.00 (2.32) 7.14 (2.97) 2.66 (2.16)
Meeting Attendance ((n= 4) n (%) 3.0 (75%) 2.6 (65%) 1.8 (45%)
ƚNIATx adherence consists of three NIATx Stages of Implementation Completion components: 1) proportion of completed activities; 2) duration of activities; and 3)
total time from first to last activity. Full adherence to NIATx was any agency with values≥the average across all three components; Partial adherence was any agency with values≤the average across any two of the three components; and No adherence was any agency with a value≤the average across all three components
A
Significant difference between groups (F= 19.77,p< 0.001). Full adherence differs from no adherence (p= 0.003) and partial adherence differs from no adherence (p= 0.007)
B
Significant difference between groups (F= 33.47,p< 0.001). Full adherence differs from partial and no adherence and partial adherence differs from no adherence. Allp-values < 0.001
C
Significant difference between groups (F= 25.43,p< 0.001). Full adherence differs from partial (p< 0.001) and no adherence (p= 0.012). No significant difference between partial and no adherence (p= 0.071)
D
Significant difference between groups (F= 5.82,p= 0.007). Full adherence differs from no adherence (p= 0.005)
E
[image:8.595.57.538.571.715.2]Significant difference between groups (F= 6.99,p= 0.005). Full adherence differs from no adherence (p= 0.007) and partial adherence differs from no adherence (p= 0.011)
Table 5Per-protocol DDCAT Index change scores by dimension and total (baseline to one-year post) based on mixed effects modeling (n= 35)
DDCAT Index Dimensions and Total NIATx Strategy (Full Adherence) ((n= 11)
Waitlist ((n= 24)
NIATx Strategy
(Full Adherence) vs. Waitlistƚ ((n= 35)
Program Structure 1.136*** 0.612*** 0.524 (d = 0.39)
Program Milieu 1.409*** 0.489*** 0.920 (d = 0.91)**
Clinical Process: Assessment 0.740*** 0.483*** 0.258 (d = 0.31)
Clinical Process: Treatment 1.064*** 0.726*** 0.338 (d = 0.42)
Continuity of Care 1.164*** 0.586*** 0.578 (d = 0.63)*
Staffing 0.927*** 0.730*** 0.197 (d = 0.21)
Training 1.182*** 0.885*** 0.297 (d = 0.27)
Total 1.089*** 0.643*** 0.446 (d = 0.51)*
*p≤0.05, **p≤0.01, ***p≤0.001
Discussion
Summary of findings
Changes in DDCAT Index scores were observed for both study arms. Improvements in DDCAT Index total and dimension scores at one-year post active implemen-tation may indicate that even the audit and feedback of DDCAT Index scores alone, which were also provided to both the active NIATx and the waitlist control group, were useful to initiate important and significant changes in both study arms.
In this study, just over one half of organizations (52.2%) assigned to NIATx strategy failed to suffi-ciently adhere to NIATx protocol and therefore, fully benefit from the implementation support. Fully adher-ent agencies reported having prior experience using NIATx implementation strategies (27% vs. 15%) versus non-adherent (i.e. partial or no adherence) agencies. Prior staff knowledge of NIATx benefits may have con-tributed, on average, to the implementation of more change projects (2.5 vs. 1.3), participation in coaching calls (7.0 vs. 5.1), and greater meeting attendance (75% vs. 55%) for fully adherent agencies versus other non-adherent agencies. In addition, fully non-adherent agencies were less likely to be located in medically underserved areas or healthcare shortage areas for behavioral health and primary care. Geographic location may have im-pacted the type and number of change projects imple-mented by non-adherent organizations. As a result, the differential impact of NIATx was limited via intent-to-treat analyses. Nevertheless, Program Milieushowed sig-nificant difference with meaningful effect size (d = 0.54). One possible explanation is that within the context of the one-year strategy, some of the implementation focus could
have been on Program Milieu, such as displaying
bro-chures, and therefore, may have been an easier change to make when compared to more complex integrated treatments or policy and staffing changes found within the other dimensions.
But in so far as adherence to NIATx was taken into account, as demonstrated in the per-protocol analyses results, NIATx implementation strategy effects on
DDCAT Index outcomes were more robust (Cohen’s
d = 0.51 for DDCAT Index total, d = 0.91 for Program
Milieu dimension, and d = 0.63 for Continuity of Care dimension). Of interest, a few of the other DDCAT Index dimensions, although not statistically significant (perhaps because of other unaccounted variation), still had varying small-to-moderate effect sizes (d = 0.31– 0.42).
Previous studies have published results using the DDCAT Index to assess addiction treatment programs across the United States [16, 18, 19, 35–37, 46]. Results have varied, but most report the need for sustained improvements to addiction treatment programs. For
ex-ample, Lambert-Harris et al. [37], conducted DDCAT
Index assessments in 180 community addiction treat-ment programs. In this study, most programs (81.8%) of-fered addition-only services. In yet another study [18], approximately 18% of the 256 addiction treatment pro-grams across the United States met the criteria for dual diagnosis capable services. A study of 30 California treat-ment programs found that 43% of the programs were at dual diagnosis capable or higher, but still faced ongoing barriers to overcome [46]. In this sample, the majority of NIATx strategy and waitlist organizations met the cri-teria for addiction-only services at baseline (61 and 83%,
[image:9.595.55.540.85.315.2]respectively). However, by the end of one-year follow-up, approximately 22% of NIATx strategy organization provided dual diagnosis enhanced services and only 26% still providing addiction-only services. The waitlist arm also saw a reduction in the number of organiza-tions providing addiction-only services (52%). For both arms, these improvements are meaningful. Two-year follow-up data is needed to determine if organizations in the NIATx strategy are able to sustain improve-ments and if those in the waitlist are able to make sub-stantial improvements.
Strengths and limitations
One strength of the study is the experimental design, including randomization at the organizational level. Another strength is the robust primary outcome meas-ure. Furthermore, to date, this is the first study to evaluate a well-documented implementation strategy, NIATx, to install and hopefully sustain integrated treatment services.
The study had some limitations. First, sampling biases due to volunteer or Hawthorne effects were possible. Be-cause of keen interest among participating organizations
[image:10.595.60.538.82.547.2]to integrate behavioral health services in both groups, there may have been some volunteer bias.
Second, because of the convenience sampling used, the external validity of the finds will depend on future studies in different populations. Replication in other set-tings are needed to verify internal validity.
The DDCAT has excellent psychometric properties and higher scores associated with higher rates of inte-grated services delivery and improved outcomes for patients with co-occurring disorders. However, in this study it served as the omnibus and proxy outcome of integrated service capacity. Additional measures of outcome would add to the strength of interpretation of findings.
Lastly, because assessments were conducted by eval-uators from the State of Washington, it may have pre-vented some organizations to speak freely about their progress in the study and reveal relevant information during the course of the half-day site visit. To mitigate this, all evaluators stated clearly the purpose of the study, and that evaluations were conducted in their capacity as members of the research team and not as official state employees.
Conclusions
Many of the agencies enrolled in the study were “early adopters” and participation in the study was partially motivated by the announcement of a new state mandate requiring agencies to transition to integrated behavioral health services for persons with co-occurring disorders. This is evident by the overall improvements found in DDCAT Index scores over time. This level of interest among participating organizations in implementing inte-grated behavioral health services might also explain the positive DDCAT Index change scores, galvanizing not only organizations in the NIATx strategy arm, but also those in the waitlist. Therefore, these study findings may be specific to this setting. Replication in different con-texts and settings may be warranted.
An important finding is that there were hardly robust differences between the NIATx and the waitlist groups on change in integrated service capability, as measured by the DDCAT, using intent-to-treat analyses. Baseline differences between the groups were not eliminated by randomization, so it’s possible that ceiling effects may have undermined a fair comparison. However, if examin-ing the impact of NIATx adherence or participation, much like the dose response effect with medications or psychosocial treatments, more differences between the groups were displayed. Future research might consider designs such as Sequential Multiple Assignment Ran-domized Trial, such as utilized by Kilbourne et al. [47]. Measuring the impact of an initial discrete strategy (e.g. DDCAT assessment as audit and feedback), and then
adapting strategies based on primary outcome measure response or participant adherence, would add a level of rigor and real-world application that this project did not feature.
This study is currently completing two-year follow-up data. Further analysis on sustainment of improvements in follow-up assessments can be examined, and the im-pact of active implementation for organizations in the waitlist group remains to be seen.
To summarize, providing integrated treatment for persons with co-occurring disorders is important. Its benefits have been demonstrated and yet gaps in inte-grated services persist. Our findings show that NIATx is effective in implementing integrated services for persons with co-occurring substance use and mental health disorders. It also demonstrates the importance of adherence to the NIATx protocol for significant improvements to be made. To evaluate whether these improvements in DDCAT Index scores correlate with improved patient outcomes, additional analyses will be conducted. Possible implications for behavioral health include determining co-occurring capacity at baseline, guiding and measuring evidence-based practice imple-mentation initiatives, and improving patient outcomes.
Abbreviations
CACE:Complier average causal effect; DDCAT: Dual diagnosis capability in addiction treatment; DSHS: Department of social and health services; IOP: Intensive outpatient; IRB: Institutional review board; NIATx: Network for the Improvement of addiction treatment; NIDA: National Institute on drug abuse; PDSA: Plan-Do-Study-Act; SIC: Stages of implementation completion
Acknowledgements
The authors acknowledge the team of evaluators from the Washington State Department of Social and Health Services, and the team of coaches from the School of Pharmacy at the University of Wisconsin-Madison. They would also like to acknowledge the leadership, staff and patients from all participating community addiction treatment programs.
Authors’contributions
All authors made significant contributions to this manuscript. MPM and JHF designed the study. MTA developed and drafted the initial manuscript. MPM also wrote significant portions. Data collection/extraction was completed by EO, AM, AK and KC. Data analyses were conducted by BJ. All authors read and approved the final manuscript.
Funding
This study was funded by NIDA (R01DA037222)(PI: McGovern, Ford). NIDA was not involved in data collection, data analysis or writing of this paper. The statements made here are those of the authors.
Availability of data and materials
Datasets generated and/or analyzed during the current study are not publically available, but are available from the corresponding author on reasonable request. The DDCAT Index measure (V4.1) is available from the authors upon request.
Ethics approval and consent to participate
This study has been reviewed and deemed not to meet the definition of human subject research as defined in federal regulations at 45 CFR 46.102 by the Institutional Review Boards at Stanford University, University of Wisconsin-Madison, and the State of Washington Department of Social and Health Services. Because voluntary participation occurred at the
were provided to eligible sites, and informed consent was obtained by study enrollment.
Consent for publication Not applicable.
Competing interests
The authors declare that they have no competing interests.
Author details
1Center for Behavioral Health Services and Implementation Research, Division of Public Health & Population Sciences, Department of Psychiatry and Behavioral Sciences, Stanford University School of Medicine, Palo Alto, CA 94304, USA.2School of Pharmacy–Social and Administrative Sciences Division, University of Wisconsin–Madison, Madison, WI 53705, USA.3Office of Behavioral Health and Managed Care, Division of Behavioral Health and Recovery, Washington State Department of Social and Health Services, Olympia, WA 98504, USA.4Washington State Health Care Authority, Olympia, WA 98501, USA.5Center for Interdisciplinary Brain Sciences Research, Department of Psychiatry and Behavioral Sciences, Stanford University School of Medicine, Palo Alto, CA 94304, USA.
Received: 4 February 2019 Accepted: 10 October 2019
References
1. SAMHSA. Key substance use and mental health indicators in the United States. In: Results from the 2016 National Survey on Drug Use and Health. Rockville, MD: Center for Behavioral Health Statistics and Quality, Substance Abuse and Mental Health Services Administration: HHS Publication No. SMA 17–5044, NSDUH Series H-52; 2017.
2. Lai HM, Cleary M, Sitharthan T, Hunt GE. Prevalence of comorbid substance use, anxiety and mood disorders in epidemiological surveys, 1990-2014: a systematic review and meta-analysis. Drug Alcohol Depend. 2015;154:1–13.
https://doi.org/10.1016/j.drugalcdep.2015.05.031.
3. Rosenthal RN, Nunes EV, Le Fauve CE. Implications of epidemiological data for identifying persons with substance use and other mental disorders. Am J Addict. 2012;21(2):97–103.https://doi.org/10.1111/j.1521-0391.2011.00198.x. 4. Clark RE, Samnaliev M, McGovern MP. Impact of substance disorders on
medical expenditures for medicaid beneficiaries with behavioral health disorders. Psychiatr Serv. 2009;60(1):35–42.https://doi.org/10.1176/appi. ps.60.1.35.
5. Grant BF, Stinson FS, Dawson DA, Chou SP, Dufour MC, Compton WM, et al. Prevalence and co-occurrence of substance use disorders and independent mood and anxiety disorders: results from the National Epidemiologic Survey on alcohol and related conditions. Arch Gen Psychiatry. 2004;61(8):807–16.
https://doi.org/10.1001/archpsyc.61.8.807.
6. Kelly TM, Daley DC. Integrated treatment of substance use and psychiatric disorders. Soc Work Public Health. 2013;28(3–4):388–406.https://doi.org/10. 1080/19371918.2013.774673.
7. Baigent M. Managing patients with dual diagnosis in psychiatric practice. Curr Opin Psychiatry. 2012;25(3):201–5.https://doi.org/10.1097/YCO. 0b013e3283523d3d.
8. Hides LM, Elkins KS, Scaffidi A, Cotton SM, Carroll S, Lubman DI. Does the addition of integrated cognitive behaviour therapy and motivational interviewing improve the outcomes of standard care for young people with comorbid depression and substance misuse? Med J Aust. 2011;195(3):S31–7. 9. Baker AL, Kavanagh DJ, Kay-Lambkin FJ, Hunt SA, Lewin TJ, Carr VJ, et al.
Randomized controlled trial of cognitive-behavioural therapy for coexisting depression and alcohol problems: short-term outcome. Addiction. 2010; 105(1):87–99.https://doi.org/10.1111/j.1360-0443.2009.02757.x. 10. Hawkins EH. A tale of two systems: Co-occurring mental health and
substance abuse disorders treatment for adolescents. Annu Rev Psychol. 2009;60:197–227.https://doi.org/10.1146/annurev.psych.60.110707.163456. 11. CSAT. Substance abuse treatment for persons with co-occurring disorders, treatment improvement protocol (TIP) series 42. In: Treatment CfSA, editor. Rockville, MD: Substance Abuse and Mental Health Services Administration: DHHS publication No SMA-13-3992; 2005.
12. Drake RE, Mueser KT, Brunette MF, McHugo GJ. A review of treatments for people with severe mental illnesses and co-occurring substance use disorders. Psychiatr Rehabil J. 2004;27(4):360–74.
13. Schulte SJ, Meier PS, Stirling J. Dual diagnosis clients' treatment satisfaction - A systematic review. BMC Psychiatry. 2011;11:64–244.https://doi.org/10. 1186/1471-244X-11-64.
14. Morse S, Bride BE. Reduction in healthcare utilization and costs following residential integrated treatment for co-occurring substance use and mental health disorders. J Hosp Adm. 2016;5(6).https://doi.org/10.5430/jha.v5n6p53. 15. Worley MJ, Trim RS, Tate SR, Hall JE, Brown SA. Service utilization during and
after outpatient treatment for comorbid substance use disorder and depression. J Subst Abus Treat. 2010;39(2):124–31.https://doi.org/10.1016/j. jsat.2010.05.009.
16. McGovern MP, Lambert-Harris C, McHugo GJ, Giard J, Mangrum LF. Improving the dual diagnosis capability of addiction and mental health treatment services: implementation factors associated with program level changes. J Dual Diagn. 2010;6:237–50.
17. Priester MA, Browne T, Iachini A, Clone S, DeHart D, Seay KD. Treatment access barriers and disparities among individuals with co-occurring mental health and substance use disorders: an integrative literature review. J Subst Abus Treat. 2016;61:47–59.https://doi.org/10.1016/j.jsat.2015.09.006. 18. McGovern MP, Lambert-Harris C, Gotham HJ, Claus RE, Xie H. Dual diagnosis
capability in mental health and addiction treatment services: an assessment of programs across multiple state systems. Admin Pol Ment Health. 2014; 41(2):205–14.https://doi.org/10.1007/s10488-012-0449-1.
19. Sacks S, Chaple M, Sirikantraporn J, Sacks JY, Knickman J, Martinez J. Improving the capability to provide integrated mental health and substance abuse services in a state system of outpatient care. J Subst Abus Treat. 2013; 44(5):488–93.https://doi.org/10.1016/j.jsat.2012.11.001.
20. Perron BE, Bunger A, Bender K, Vaughn MG, Howard MO. Treatment guidelines for substance use disorders and serious mental illnesses: Do they address co-occurring disorders? Substance Use and Misuse. 2010;45(7–8): 1262–78.https://doi.org/10.3109/10826080903442836.
21. Brownson RC, Colditz GA, Proctor EK. Dissemination and implementation research in health: translating science to practice: Oxford University Press; 2017.
22. Colditz GA. The promise and challenges of dissemination and
implementation research. In: Brownson RC, Colditz GA, Proctor EK, editors. Dissemination and implementation research in health: translating science to practice. New York: Oxford University Press; 2012. p. 3–22.
23. Powell BJ, Proctor EK, Glass JE. A systematic review of strategies for implementing empirically supported mental health interventions. Res Soc Work Pract. 2014;24(2):192–212.https://doi.org/10.1177/1049731513505778. 24. Brunette MF, Asher D, Whitley R, Lutz WJ, Wieder BL, Jones AM, et al.
Implementation of integrated dual disorders treatment: a qualitative analysis of facilitators and barriers. Psychiatr Serv. 2008;59(9):989–95.https:// doi.org/10.1176/appi.ps.59.9.989.
25. Hoffman KA, Ford JH, Choi D, Gustafson DH, McCarty D. Replication and sustainability of improved access and retention within the Network for the Improvement of Addiction Treatment. Drug Alcohol Depend. 2008;98(1–2): 63–9.https://doi.org/10.1016/j.drugalcdep.2008.04.016.
26. Hoffman KA, Ford JH, Tillotson CJ, Choi D, McCarty D. Days to treatment and early retention among patients in treatment for alcohol and drug disorders. Addict Behav. 2011;36(6):643–7.https://doi.org/10.1016/j.addbeh. 2011.01.031.
27. McCarty D, Gustafson DH, Wisdom JP, Ford JH, Choi D, Molfenter T, et al. The network for the improvement of addiction treatment (NIATx): enhancing access and retention. Drug Alcohol Depend. 2007;88(2–3):138– 45.https://doi.org/10.1016/j.drugalcdep.2006.10.009.
28. Quanbeck A, Wheelock A, Ford JH, Pulvermacher A, Capoccia V, Gustafson D. Examining access to addiction treatment: scheduling processes and barriers. J Subst Abus Treat. 2013;44(3):343–8.https://doi.org/10.1016/j.jsat. 2012.08.017.
29. Schmidt LA, Rieckmann TR, Abraham A, Molfenter T, Capoccia V, Roman P, et al. Advancing recovery: implementing evidence-based treatment for substance use disorders at the systems level. J Stud Alcohol Drugs. 2012; 73(3):413–22.
30. Ford JH 2nd, Abraham AJ, Lupulescu-Mann N, Croff R, Hoffman KA, Alanis-Hirsch K, et al. Promoting adoption of medication for opioid and alcohol use disorders through system change. J Stud Alcohol Drugs. 2017;78(5):735–44.
32. Hoffman KA, Green CA, Ford JH, Wisdom JP, Gustafson DH, McCarty D. Improving quality of care in substance abuse treatment using five key process improvement principles. J Behav Heal Serv Res. 2012;39(3):234–44.
https://doi.org/10.1007/s11414-011-9270-y.
33. Gustafson DH, Johnson KA, Capoccia V, Cotter F, Ford JH II, Holloway D, et al. The NIATx model: process improvement in behavioral health. Madison: University of Wisconsin-Madison; 2011.
34. Ford JH, Osborne EL, Assefa MT, McIlvaine AM, King AM, Campbell K, et al. Using NIATx strategies to implement integrated services in routine care: a study protocol. BMC Health Serv Res. 2018;18(1):431.https://doi.org/10.1186/ s12913-018-3241-4.
35. McGovern MP, Matzkin AL, Giard J. Assessing the dual diagnosis capability of addiction treatment services: the dual diagnosis capability in addiction treatment (DDCAT) index. J Dual Diagn. 2007;3(2):111–23.https://doi.org/10. 1300/J374v03n02_13.
36. Gotham HJ, Claus RE, Selig K, Homer AL. Increasing program capability to provide treatment for co-occurring substance use and mental disorders: organizational characteristics. J Subst Abus Treat. 2010;38(2):160–9.https:// doi.org/10.1016/j.jsat.2009.07.005.
37. Lambert-Harris C, Saunders EC, McGovern MP, Xie H. Organizational capacity to address co-occurring substance use and psychiatric disorders: assessing variation by level of care. J Addict Med. 2013;7(1):25–32.https://doi.org/10. 1097/ADM.0b013e318276e7a4.
38. Giard J, Kincaid R, Gotham HJ, Claus RE, Lambert-Harris C, McGovern MP, et al. The dual diagnosis capability in addiction treatment (DDCAT) toolkit, version 4.0. Substance Abuse and Mental Health Services Administration: Rockville; 2011.
39. Raudenbush SW, Bryk AS. Hierarchical linear models: applications and data analysis methods. 2nd ed. California: Sage; 2002.
40. Singer JD, Willett JB. Applied longitudinal data analysis: modeling change and event occurrence. 1st ed. New York: Oxford University Press; 2003. 41. Muthén LK, Muthén BO. Mplus User’s Guide. 8th ed. Los Angeles: Muthén &
Muthén; 1998-2017.
42. Angrist JD, Imbens GW, Rubin DB. Identification of causal effects using instrumental variables. J Am Stat Assoc. 1996;91(434):444–55.https://doi.org/ 10.1080/01621459.1996.10476902.
43. Jo B. Estimation of intervention effects with noncompliance: alternative model specifications. J Educ Behav Stat. 2002;27(4):385–409.
44. Jo B, Stuart EA. On the use of propensity scores in principal causal effect estimation. Stat Med. 2009;28(23):2857–75.https://doi.org/10.1002/sim.3669. 45. Jo B, Wang CP, Ialongo NS. Using latent outcome trajectory classes in causal
inference. Stat Its Interface. 2009;2(4):403–12.
46. Padwa H, Larkins S, Crevecoeur-Macphail DA, Grella CE. Dual diagnosis capability in mental health and substance use disorder treatment programs. J Dual Diagn. 2013;9(2):179–86.https://doi.org/10.1080/15504263.2013. 778441.
47. Kilbourne AM, Smith SN, Choi SY, Koschman E, Liebrecht C, Rusch A, et al. Adaptive school-based implementation of CBT (ASIC): Clustered-SMART for building an optimized adaptive implementation intervention to improve uptake of mental health interventions in schools. Implement Sci. 2018;13: 119.https://doi.org/10.1186/s13012–018–0808-8.
Publisher’s Note