TECHNICAL NOTE
Simple and fast quantification
of DNA damage by real-time PCR, and its
application to nuclear and mitochondrial DNA
from multiple tissues of aging zebrafish
Shusen Zhu and James A. Coffman
*Abstract
We describe a real-time (rt) PCR-based method of quantifying DNA damage, adapted from the long-run rtPCR method of DNA damage quantification (LORD-Q) developed by Lehle et al. (Nucleic Acids Res 42(6):e41, 2014). We show that semi-long run rtPCR, which generates amplicons half the length of those generated in LORD-Q, provides equivalent sensitivity for detecting low lesion frequencies, and better sensitivity for detecting high frequencies. The smaller amplicon size greatly facilitates PCR optimization and allows greater flexibility in the use of detection dyes, and a modified data analysis method simplifies the calculation of lesion frequency. The method was used to measure DNA damage in the nuclear and mitochondrial genomes of different tissues in zebrafish of different ages. We find that nuclear DNA damage generally increases with age, and that the amount of mitochondrial DNA damage varies sub-stantially between tissues, increasing with age in liver and brain but not in heart or skeletal muscle, the latter having the highest levels of damage irrespective of age.
Keywords: DNA damage, Quantitative PCR, Nuclear, Mitochondrial, Aging, Zebrafish
© The Author(s) 2017. This article is distributed under the terms of the Creative Commons Attribution 4.0 International License (http://creativecommons.org/licenses/by/4.0/), which permits unrestricted use, distribution, and reproduction in any medium, provided you give appropriate credit to the original author(s) and the source, provide a link to the Creative Commons license, and indicate if changes were made. The Creative Commons Public Domain Dedication waiver (http://creativecommons.org/ publicdomain/zero/1.0/) applies to the data made available in this article, unless otherwise stated.
Background
The information encoded in the nucleotide sequence of genomic DNA is essential for biological function, and cells employ numerous mechanisms to repair damaged DNA and maintain genomic integrity. None-theless, the frequency of genotoxic insults can over-come a cell’s capacity for DNA repair, leading to the accumulation of DNA damage that can in turn lead to cell death or senescence, or transformation to non-functional or pathological cellular phenotypes. The question of how much damage is present in the DNA of a cell, tissue, or organism at different stages of a life cycle or in different environmental or physiological circumstances is central to various fields of biomedi-cine, including toxicology, oncology, and gerontology;
hence, robust, sensitive, and user-friendly methods of quantifying DNA damage are widely called for in bio-medical science.
Since lesions that disrupt DNA integrity interfere with DNA replication, DNA damage can be measured by polymerase chain reaction (PCR). Quantitative PCR (qPCR) methods of measuring DNA damage make use of the fact that replication efficiency is proportional to the average frequency of lesions within a defined region, and hence the length of that region [1]. Generally these methods work by comparing the ratios of long and short amplicons obtained from different samples, the latter providing a baseline (virtually damage-free) reference. Originally this approach made use of end-point PCR [2]. More recently a real-time PCR method of using long-run real-time (rt) PCR for DNA damage quantification (LORD-Q) was described which allowed sensitive and robust detection of the number of lesions (including dou-ble-stranded breaks, abasic sites, thymine dimers, and
Open Access
5-hydroxymethyl dC) within a defined sequence [3]. As originally described this method requires amplification of relatively long sequences, ~3–4 kb in length.
Although PCR is straightforward in theory, in practice it often requires extensive optimization to maximize efficiency and specificity, and the ease of optimization decreases with increasing amplicon length. We there-fore asked whether the LORD-Q method could be adapted to work with shorter amplicons. We find that semi-long run (SLR) amplicons of ~1.5–2 kb provide sensitivity equivalent to that provided by LORD-Q for detection of low-frequency damage, and better sensitiv-ity for high-frequency damage. Shorter amplicons make PCR conditions less stringent and therefore easier to optimize. To demonstrate the utility of this method, we use it to quantify DNA damage in the nuclear and mito-chondrial genomes from multiple tissues of zebrafish of different ages. Unlike most studies in the past that that made such measurements following differential isolation of the mtDNA and nDNA, in our analysis the mtDNA and nDNA were co-isolated, allowing their direct comparison. Our results show that DNA dam-age varies between tissues, is on averdam-age higher in mito-chondrial DNA than in nuclear DNA, and generally increases with age.
Methods
DNA isolation and purification
Total DNA was purified from zebrafish tissues using E.Z.N.A. tissue DNA kit (OMEGA, USA). DNA quan-tity and purity were determined by spectrometry using a Nanodrop 1000. The purified DNA (A260/A280 ≥1.8) was stored at 4 °C.
Primers for the real‑time PCR
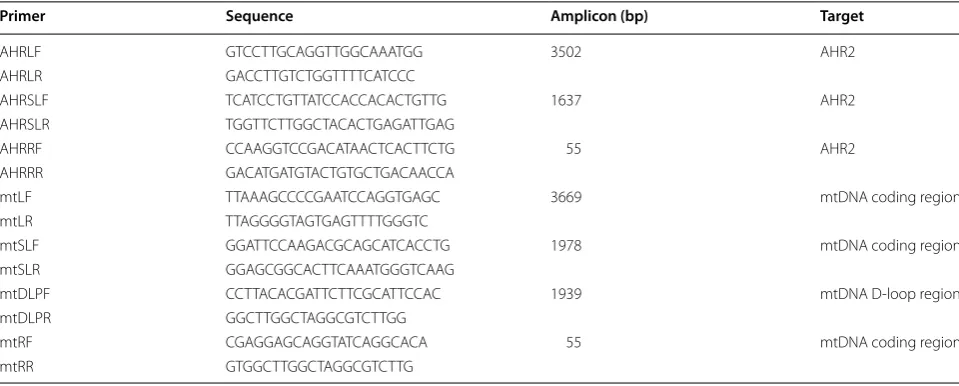
For comparison of the sensitivity and accuracy of long run (LR) and semi-long run (SLR) PCR of nuclear DNA (nDNA) and mitochondrial DNA (mtDNA), and to examine the difference in the amount of damage in cod-ing region and D-loop regions of mtDNA, we designed 2 pairs of long-run primers for amplicons of 3.5–4 kb, 3 pairs of semi-long-run primers for amplicons of 1.6–2 kb, and 2 pairs of short run primers for amplicons of 55 bp which served as internal undamaged references for nor-malization (Table 1). All three pairs of primers for nDNA are located in the zebrafish (Danio rerio) aryl hydrocar-bon receptor2 (AHR2) gene, and the four pairs of primers for zebrafish mtDNA cover different regions. The prim-ers were designed using program NCBI/primer-BLAST (http://www.ncbi.nlm.nih.gov/tools/primer-blast/) and synthesized by Integrated DNA Technologies (IDT, USA) with standard desalting.
Enzymatic digestion of isolated DNA
For quantification of defined lesion frequencies, 5 µg of total DNA isolated from 7 month-old zebrafish brains was subjected to enzymatic digestion with the restric-tion endonuclease PvuII (for SLR PCR), identified as single cutter for both the targeted nDNA (1637 bp of AHR2 gene) and mtDNA (1978 bp), or NdeI (for LR PCR), identified as single cutter for both the targeted nDNA (3502 bp of AHR2 gene) and mtDNA (3669 bp), using the NEBcutter V2.0 software (http://nc2.neb.com/ NEBcutter2). Digestion was carried out at 37 °C for 2 h in a 100-µl volume using 50 units PvuII and NdeI (NEB) respectively. For the analysis of DNA-lesion frequency, digested and undigested DNA was diluted and mixed at
Table 1 Primers and targets
Primer Sequence Amplicon (bp) Target
AHRLF GTCCTTGCAGGTTGGCAAATGG 3502 AHR2
AHRLR GACCTTGTCTGGTTTTCATCCC
AHRSLF TCATCCTGTTATCCACCACACTGTTG 1637 AHR2
AHRSLR TGGTTCTTGGCTACACTGAGATTGAG
AHRRF CCAAGGTCCGACATAACTCACTTCTG 55 AHR2
AHRRR GACATGATGTACTGTGCTGACAACCA
mtLF TTAAAGCCCCGAATCCAGGTGAGC 3669 mtDNA coding region
mtLR TTAGGGGTAGTGAGTTTTGGGTC
mtSLF GGATTCCAAGACGCAGCATCACCTG 1978 mtDNA coding region
mtSLR GGAGCGGCACTTCAAATGGGTCAAG
mtDLPF CCTTACACGATTCTTCGCATTCCAC 1939 mtDNA D-loop region
mtDLPR GGCTTGGCTAGGCGTCTTGG
mtRF CGAGGAGCAGGTATCAGGCACA 55 mtDNA coding region
[image:2.595.57.537.532.725.2]different ratios (Additional file 1: Table S1) prior to real-time PCR quantification.
DNA irradiation
1.5 µl of purified DNA from brains of 5-month-old zebrafish was loaded on a piece of parafilm and exposed to ultraviolet C radiation (UVC) at dose of 0.5, 1, 2, 5, 10, 20 and 50 mJ/cm2 in a UV crosslinker (UVP HL-2000 HybriLinker, USA). Irradiated DNA was then diluted to 16 ng/µl for nDNA and 2 ng/µl for mtDNA damage assay.
Real‑time PCR
Real-time PCR (rtPCR) for DNA damage quantification was carried out in a LightCycler 480 II system (Roche) in 96-well plates. The PCR conditions were optimized for the different primers and different targets to get specific products which were confirmed by melting curve analy-sis and agarose gels (Fig. 1). The PCR amplification was monitored by real-time measurement of the intercala-tion of the saturating fluorescent dye into dsDNA. 4 ng of nDNA sample or 1 ng of mtDNA sample was applied in 10 µl of total reaction volume. Standard curves were created by serial dilution of the undamaged control with concentration of 16, 4, 1, 0.25 ng of nDNA and 4, 1, 0.25, 0.0625 ng of mtDNA for quantification of all targets of different sizes. Total DNA from brains of 5-month-old zebrafish (found to have the lowest amount of DNA dam-age; see Fig. 4) served as undamaged reference. Each sample was assayed in triplicate. For LR and SLR real-time PCR, Platinum Pfx DNA polymerase (ThermoFisher Scientific, USA) was employed and the reactions con-taining 1X fluorescent dye were performed in 96-well clear plates. Resolight dye was used for all experiments
except that which compared the effect of different dyes on the specificity and efficiency of the PCR, which used 1X Resolight (Roche), 1.5 µM SYTO-9 (ThermoFisher Scientific, USA) or 1X EvaGreen (Biotium, USA). For ref-erence quantification (short run), PerfeCTa SYBR Green FastMix (Quanta BioSciences) was used, and the reac-tions were performed in 96-well white plates. In initial trials comparing Pfx DNA polymerase with hot start Taq polymerase, Pfx was found to be more efficient and more specific than hot start Taq.
Data analysis
Absolute quantification and second derivative maximum analysis methods were applied for all PCRs (LightCycler 480 Instrument Operator’s Manual, v1.5, 2012). Sample and reference DNA were analyzed side-by-side. DNA damage is quantified by normalizing the concentration values of samples to the concentration values of the inter-nal reference. The resulting values are converted to rela-tive lesion frequencies per 10 kb DNA by application of the Poisson distribution (lesions/amplicon = −ln(At/ A0)), where At represents the amplification (normalized concentration) of treated samples and A0 is the amplifica-tion of untreated or undamaged controls [1].
long fragment represents the LR or SLR amplicon. Statistical analysis of intergroup differences was per-formed using one-way or two-way ANOVA and Student’s t test.
Results
Semi long‑run PCR is more efficient than long‑run PCR and the products are more specific
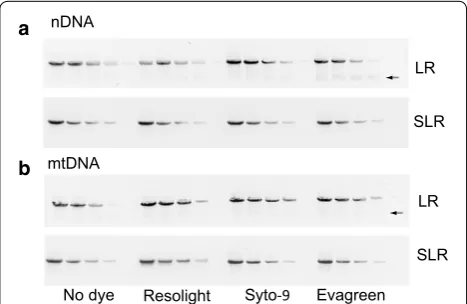
We first used standard PCR to compare the specificity of the LR PCR (3–4 kb) used in LORD-Q to that of SLR PCR (1.6–2 kb), as assessed by the appearance of non-specific amplification products on a gel. This was done both with-out dye added to the reaction, and in the presence of a fluorescent intercalating dye such as is used in real-time PCR. The commonly used fluorescent dye SYBR Green inhibits synthesis of long PCR products, so LORD-Q instead uses the non-inhibitory dye Resolight [3]. We also tested two additional dyes reported to have low inhibi-tory effects, Syto-9 and Evagreen, which are considerably less expensive than Resolight (340- and 11-fold, respec-tively). With both nDNA and mtDNA primer sets, SLR PCR yielded a single product in the presence of all three dyes (Fig. 1). In contrast, the LR PCRs generated non-specific products visible as smears or non-non-specific bands following agarose gel electrophoresis (Fig. 1, arrows), indicating that all three dyes reduce the specificity of LR Lesions per10 kbDNA
=(−ln(At/A0))×10,000 [bp]/size of long fragment[bp]
SLR LR
No dye Resolight Syto-9 Evagreen
nDNA
SLR LR mtDNA
a
b
[image:3.595.57.291.515.667.2]PCR, with Evagreen having the biggest negative effect. These results indicate that in the presence of intercalating dye SLR PCR is more specific than LR PCR.
The sensitivity of the SLR real‑time PCR based DNA damage assay is comparable to the LORD‑Q method
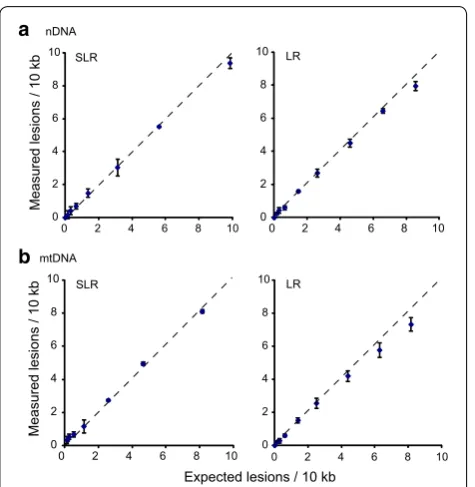
To compare the use of SLR versus LR PCR in a real-time PCR-based DNA damage assay, we digested DNA with restriction endonucleases predicted to make a single cut within the amplified mtDNA and nDNA fragments. The digested DNA was then mixed with undigested DNA at different ratios to generate a standard curve, and both SLR and LR real-time PCR were performed to measure the premade DNA damage. The expected lesion rates were calculated and plotted against the experimentally measured damage (Fig. 2; Additional file 1: Table S1). With both LR and SLR PCR, the measured lesion fre-quencies tracked the expected frefre-quencies for both the mtDNA and nDNA, albeit more closely with SLR PCR with increasing levels of damage (Fig. 2), suggesting that the latter provides somewhat greater accuracy at higher levels of damage.
To further compare the sensitivity of SLR and LR for measuring a range of DNA damage, we subjected naked nDNA and mtDNA (extracted DNA in a small volume of Tris–EDTA buffer) to UVC. DNA damage generated by 5 J/m2 (0.5 mJ/cm2) UVC should be in the range of 1.5–2 lesions/10 kb [4], and this is what we measured by both
methods (Fig. 3; Additional file 1: Table S2). The results also showed that DNA damage increases in a UV dose-dependent manner. At low dose of UVC, the amount of damage in both nDNA and mtDNA detected by SLR PCR is very close to that detected by LR PCR, indicat-ing similar sensitivities. With increasindicat-ing UVC dose, the signal produced by LR PCR saturated sooner than that produced by SLR PCR (Fig. 3), again indicating that SLR PCR is more sensitive than LR PCR at detecting higher levels of DNA damage.
Use of SLR rtPCR to measure damage in nuclear and mitochondrial DNA from tissues of zebrafish of different ages
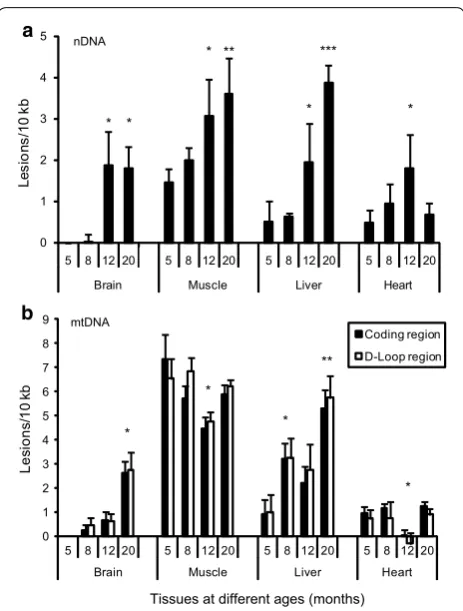
As an application we asked whether SLR rtPCR could detect differences in the amount of DNA damage in the nuclear and/or mitochondrial genomes of different tis-sues of adult zebrafish of different ages, from young adulthood (5 months) through middle age (20 months). Nuclear DNA damage in all the four tissues of zebrafishes was found to increase with age, becoming statistically significant after 12-months (except in 20-month old heart sample) (Fig. 4a). Mitochondrial DNA damage increases with age in brain and liver, with the increase becoming statistically significant at 20-months in brain and after
Expected lesions / 10 kb
Measured lesions / 10 kb
nDNA
mtDNA a
b
SLR SLR
0 2 4 6 8 10
0 2 4 6 8
10 LR
Measured lesions / 10 kb
0 2 4 6 8 10
0 2 4 6 8 10
0 2 4 6 8 10 0 2 4 6 8 10
0 2 4 6 8 10 0 2 4 6 8 10
LR
Fig. 2 Correlation of calculated and measured DNA lesion frequen-cies in a nDNA and b mtDNA. Error bars indicate standard deviation of three technical replicates of the PCR
Le
si
on
s/
10
kb SLRLR
Le
si
on
s/10
kb
UVC (mJ/cm2)
SLR nDNA
mtDNA
a
b
1 10 100
0.1 1 10 100
1 10 100
0.1 1 10 100
LR
Fig. 3 Measurement of DNA damage induced by UVC exposure in
[image:4.595.307.539.413.679.2] [image:4.595.57.295.445.689.2]8-months in liver. No significant change with age was observed in muscle and heart, except in the 12-month old heart sample which had less damage (Fig. 4b). Previ-ous studies have shown that D-loop region of mtDNA, which exhibits a triple-stranded, semi-stable DNA struc-ture during replication, is more vulnerable to oxidative damage and radiation [5, 6]. We therefore asked whether the coding region and the control region containing the D-Loop structure had different amounts of DNA dam-age. Two-way ANOVA of the results did not show any significant difference in the cumulative in vivo damage displayed by the two regions of mtDNA in brain, muscle and liver, whereas the coding region had slightly higher levels of damage than D-Loop region (p < 0.05) in heart.
Discussion
Our results indicate that SLR rtPCR provides several advantages to LORD-Q for quantifying DNA damage. With low levels of DNA damage, the sensitivity of SLR rtPCR is comparable to that of the LR rtPCR employed in
LORD-Q, whereas with high levels of DNA damage the sensitivity and hence accuracy of SLR rtPCR exceeds that of LORD-Q (Figs. 2, 3). This may be because the LR PCR generates more non-specific product (Fig. 1). In addi-tion, the long amplicons utilized by LORD-Q are inher-ently less sensitive to high levels of DNA damage than are shorter amplicons: since a single lesion within the ampli-fied region is likely sufficient to block amplification, mul-tiple lesions within a single stretch of DNA are invisible to this method, leading to earlier signal saturation. While shorter amplicons are inherently more sensitive to higher levels of damage, they are less sensitive to low levels. Nev-ertheless, our results (Figs. 2, 3) demonstrate that SLR provides sensitivity equivalent to LORD-Q for detecting low levels of DNA damage. Since results from previous studies indicate that even shorter amplicons are less sen-sitive [5], we believe that the ~2 kb employed by our SLR rtPCR method may be optimal for this type of analysis. Importantly, SLR rtPCR makes PCR optimization easier and hence faster, and offers greater flexibility in selection of fluorescent dyes for real time detection (Fig. 1). Finally, whereas the LORD-Q data analysis method requires the use of the Fit Point method to generate the amplification efficiency for the calculation of lesion frequency, our cal-culation of DNA lesion frequency using normalized con-centration values enables the use of the 2nd derivative maximum analysis method (see “Methods”; Additional file 1: Table S3), which offers the advantages of higher accuracy, speed and simplicity.
Applying our method to both the nuclear and mito-chondrial genomes of various somatic tissues in aging zebrafish we find that DNA damage accumulates with age, consistent with the widely held view that aging in senescing animals entails loss of genomic stability in somatic tissues. It should be noted that the average lev-els of DNA damage detected do not reflect per-cell levlev-els of damage, but rather the average level of DNA damage throughout the tissue. Thus the increase in DNA damage seen in several of the tissues probably reflects increasing numbers of senescent or dying cells, rather than increas-ing loads of DNA damage within healthy cells. Although previous studies have examined the levels of DNA dam-age and repair capacities in specific tissues at different life cycle stages [7–11], none so far have reported direct comparisons of the amount of DNA damage in different tissues in an adult animal and its change with age. Our measurements showed that both brain and heart have lower nuclear and mitochondrial DNA damage than muscle and liver, consistent with the higher repair capac-ity that might be expected in the former tissues. The results from muscle and liver are consistent with studies showing that in most tissues levels of DNA damage are higher in mitochondria than in nuclei [11, 12]. Finally,
0 1 2 3 4 5
5 8 12 20 5 8 12 20 5 8 12 20 5 8 12 20 Brain Muscle Liver Heart
Les
io
ns
/1
0
kb
0 1 2 3 4 5 6 7 8 9
5 8 12 20 5 8 12 20 5 8 12 20 5 8 12 20 Brain Muscle Liver Heart
Le
si
ons
/1
0
kb
Tissues at different ages (months)
Coding region D-Loop region a
b
nDNA
mtDNA
* *
* **
* ***
*
*
*
* **
*
[image:5.595.58.290.85.391.2]• We accept pre-submission inquiries
• Our selector tool helps you to find the most relevant journal
• We provide round the clock customer support
• Convenient online submission
• Thorough peer review
• Inclusion in PubMed and all major indexing services
• Maximum visibility for your research
Submit your manuscript at www.biomedcentral.com/submit
Submit your next manuscript to BioMed Central
and we will help you at every step:
whereas damage in nuclear DNA was found to increase with age in each of the somatic tissues examined, dam-age in mitochondrial DNA increased in brain and liver, but not in heart or skeletal muscle, wherein the highest levels of DNA damage were found irrespective of age. These results suggest that aging entails increasing levels of nuclear DNA damage in somatic tissues, consistent with what has been found in previous studies [13, 14].
Abbreviations
PCR: polymerase chain reaction; rtPCR: real-time PCR; LR: long run; SLR: semi-long run; LORD-Q: semi-long-run DNA damage quantification; nDNA: nuclear DNA; mtDNA: mitochondrial DNA.
Authors’ contributions
SZ performed all the experiments and data analysis and drafted the figures and parts of the manuscript; JAC directed the research and wrote the manu-script. Both authors read and approved the final manumanu-script.
Acknowledgements
We thank Ellen I. Hartig for providing the zebrafish tissues used for DNA dam-age analysis.
Competing interests
The authors declare that they have no competing interests.
Availability of data and materials
All data generated or analysed during this study are included in this published article and its additional information files.
Ethics approval and consent to participate
All procedures involving vertebrate animals (zebrafish) were approved by the Institutional Animal Care and Use Committee (IACUC) of the MDI Biological Laboratory.
Funding
Research reported in this publication was supported by Institutional Develop-ment Awards (IDeA) from the National Institute of General Medical Sciences of the National Institutes of Health under Grant Numbers P20-GM104318 and P20-GM103423.
Publisher’s Note
Springer Nature remains neutral with regard to jurisdictional claims in pub-lished maps and institutional affiliations.
Received: 30 December 2016 Accepted: 1 July 2017
References
1. Hunter SE, Jung D, Di Giulio RT, Meyer JN. The QPCR assay for analysis of mitochondrial DNA damage, repair, and relative copy number. Methods. 2010;51(4):444–51.
2. Santos JH, Meyer JN, Mandavilli BS, Van Houten B. Quantitative PCR-based measurement of nuclear and mitochondrial DNA damage and repair in mammalian cells. Methods Mol Biol. 2006;314:183–99.
3. Lehle S, Hildebrand DG, Merz B, Malak PN, Becker MS, Schmezer P, Essmann F, Schulze-Osthoff K, Rothfuss O. LORD-Q: a long-run real-time PCR-based DNA-damage quantification method for nuclear and mito-chondrial genome analysis. Nucleic Acids Res. 2014;42(6):e41. 4. Meyer JN. QPCR: a tool for analysis of mitochondrial and nuclear DNA
damage in ecotoxicology. Ecotoxicology. 2010;19(4):804–11. 5. Rothfuss O, Gasser T, Patenge N. Analysis of differential DNA damage in
the mitochondrial genome employing a semi-long run real-time PCR approach. Nucleic Acids Res. 2010;38(4):e24.
6. Zhou X, Liu X, Zhang X, Zhou R, He Y, Li Q, Wang Z, Zhang H. Non-rand-omized mtDNA damage after ionizing radiation via charge transport. Sci Rep. 2012;2:780.
7. Mitchell DL, Hartman PS. The regulation of DNA repair during develop-ment. BioEssays. 1990;12(2):74–9.
8. Barbin A, Ohgaki H, Nakamura J, Kurrer M, Kleihues P, Swenberg JA. Endogenous deoxyribonucleic acid (DNA) damage in human tissues: a comparison of ethenobases with aldehydic DNA lesions. Cancer Epide-miol Biomark Prev. 2003;12(11 Pt 1):1241–7.
9. Karahalil B, Hogue BA, de Souza-Pinto NC, Bohr VA. Base excision repair capacity in mitochondria and nuclei: tissue-specific variations. FASEB J. 2002;16(14):1895–902.
10. Lin LH, Cao S, Yu L, Cui J, Hamilton WJ, Liu PK. Up-regulation of base exci-sion repair activity for 8-hydroxy-2′-deoxyguanosine in the mouse brain after forebrain ischemia-reperfusion. J Neurochem. 2000;74(3):1098–105. 11. Hamilton ML, Guo Z, Fuller CD, Van Remmen H, Ward WF, Austad
SN, Troyer DA, Thompson I, Richardson A. A reliable assessment of 8-oxo-2-deoxyguanosine levels in nuclear and mitochondrial DNA using the sodium iodide method to isolate DNA. Nucleic Acids Res. 2001;29(10):2117–26.
12. Yakes FM, Van Houten B. Mitochondrial DNA damage is more extensive and persists longer than nuclear DNA damage in human cells following oxidative stress. Proc Natl Acad Sci USA. 1997;94(2):514–9.
13. Hamilton ML, Van Remmen H, Drake JA, Yang H, Guo ZM, Kewitt K, Walter CA, Richardson A. Does oxidative damage to DNA increase with age? Proc Natl Acad Sci USA. 2001;98(18):10469–74.
14. Best BP. Nuclear DNA damage as a direct cause of aging. Rejuvenation Res. 2009;12(3):199–208.
Additional file